Upgrading Sewage Plants for Nitrification with Immobilised Biomass
•
0 j'aime•417 vues

The document discusses using adsorbing, porous carriers to immobilize biomass for upgrading municipal sewage treatment plants. Field tests showed that adding 12-15% carrier volumes enabled stable and efficient nitrification even at low temperatures of 10-15°C. A second test simulated increased daily loads up to 5 kg COD/m3xd and the plant maintained 90% COD removal and some level of nitrification. A third test established nitrification and removed PAHs more effectively compared to suspended biomass alone under elevated loading rates.

Recommandé
Contenu connexe
Tendances
Tendances (20)
En vedette
En vedette (18)
Similaire à Upgrading Sewage Plants for Nitrification with Immobilised Biomass
Similaire à Upgrading Sewage Plants for Nitrification with Immobilised Biomass (20)
Plus de Amit Christian
Plus de Amit Christian (18)
Dernier
Dernier (20)
Upgrading Sewage Plants for Nitrification with Immobilised Biomass
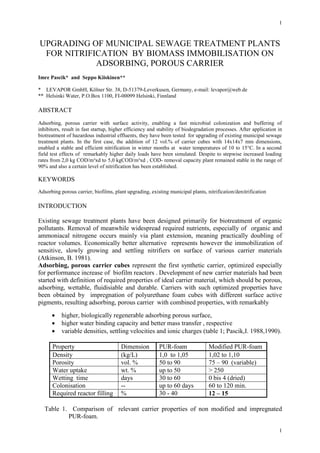
- 1. 1 1 UPGRADING OF MUNICIPAL SEWAGE TREATMENT PLANTS FOR NITRIFICATION BY BIOMASS IMMOBILISATION ON ADSORBING, POROUS CARRIER Imre Pascik* and Seppo Kiiskinen** * LEVAPOR GmbH, Kölner Str. 38, D-51379-Leverkusen, Germany, e-mail: levapor@web.de ** Helsinki Water, P.O.Box 1100, FI-00099 Helsinki, Finnland ABSTRACT Adsorbing, porous carrier with surface activity, enabling a fast microbial colonization and buffering of inhibitors, result in fast startup, higher efficiency and stability of biodegradation processes. After application in biotreatment of hazardous industrial effluents, they have been tested for upgrading of existing municipal sewage treatment plants. In the first case, the addition of 12 vol.% of carrier cubes with 14x14x7 mm dimensions, enabled a stable and efficient nitrification in winter months at water temperatures of 10 to 15°C. In a second field test effects of remarkably higher daily loads have been simulated. Despite to stepwise increased loading rates from 2,0 kg COD/m³xd to 5,0 kgCOD/m³xd , COD- removal capacity plant remained stable in the range of 90% and also a certain level of nitrification has been established. KEYWORDS Adsorbing porous carrier, biofilms, plant upgrading, existing municipal plants, nitrification/denitrification INTRODUCTION Existing sewage treatment plants have been designed primarily for biotreatment of organic pollutants. Removal of meanwhile widespread required nutrients, especially of organic and ammoniacal nitrogene occurs mainly via plant extension, meaning practically doubling of reactor volumes. Economically better alternative represents however the immobilization of sensitive, slowly growing and settling nitrifiers on surface of various carrier materials (Atkinson, B. 1981). Adsorbing, porous carrier cubes represent the first synthetic carrier, optimized especially for performance increase of biofilm reactors . Development of new carrier materials had been started with definition of required properties of ideal carrier material, which should be porous, adsorbing, wettable, fluidisiable and durable. Carriers with such optimized properties have been obtained by impregnation of polyurethane foam cubes with different surface active pigments, resulting adsorbing, porous carrier with combined properties, with remarkably higher, biologically regenerable adsorbing porous surface, higher water binding capacity and better mass transfer , respective variable densities, settling velocities and ionic charges (table 1; Pascik,I. 1988,1990). Property Dimension PUR-foam Modified PUR-foam Density (kg/L) 1,0 to 1,05 1,02 to 1,10 Porosity vol. % 50 to 90 75 – 90 (variable) Water uptake wt. % up to 50 > 250 Wetting time days 30 to 60 0 bis 4 (dried) Colonisation -- up to 60 days 60 to 120 min. Required reactor filling % 30 - 40 12 – 15 Table 1. Comparison of relevant carrier properties of non modified and impregnated PUR-foam.
- 2. 2 2 Fig. 1. Cross-section of porous, adsorbing LEVAPOR-carrier The effects of carrier-material properties on removal efficiency of the biomass, fixed on their surface have been demonstrated clearly by comparing cumulative methane productions during biodegradation of the toxic 3-chloro-benzoic acid in batch tests under anaerobic conditions by an adapted mixed culture immobilized on various carriers (Bock,M. 1991) Fig. 2: Influence of various carriers on methane production The reason of the best performance of adsorbing LEVAPOR-carrier (Fig. 2) is the impregnation of foam matrix with activated carbon, enabling a faster colonization of the carrier surface and biofilm formation (over 90% colonization within one hour) than other carrier materials, a fast adsorption/buffering of toxic pollutants, reducing the threshold concentration in the liquid medium, enabling a fast and efficient start of bioprocesses. During the degradation of adsorbed substrate a biological regeneration of adsorbtion capacity takes place (Loidl, M.1994) and a remarkably lower degree of reactor filling of only 12 to 15 vol.%
- 3. 3 3 Preliminary lab scale tests for nitrification of mechanically pretreated municipal sewage, operated at LV.TKN ~ 0,6 g TKN/Lxday in presence of 4,0 g/L suspended MLSS confirmed higher efficiency of surface-activated carrier compared with non modified foam cubes and suspended activated sludge (fig.3.). control PUR-foam adsorbing carrier Figure 3. Influence of carrier properties on nitrification of municipal effluents EXPERIMENTAL PART In two existing municipal sewage treatment plants effects of carrier addition on stability and performance of bioprocess under varied process conditions have been investigated with the target, to establish nitrification and to simulate remarkably increased hydraulic loading rates. After installation of devices for their retention in the bioreactor, 12 to 15 vol.% carrier were added and process monitoring started. Startup and establishment of nitrification at low temperatures Main targets of long term field tests, carried out in Espoo (Finnland) in a municipal treatment plant, where nitrification took place only in summer, were investigation of start and establishment of stable nitrification in the operated existing bioreactor achieving 70% nitrification also at low temperatures during the winter. Technical data of the plant Volume, Veff. = 45 m³ Carrier = 5,5 m³ (12 vol.%) adsorbing, porous LEVAPOR cubes (14x14x7mm) Vol. of clarifyer = 15 m³ Aeration = fine bubble membrane aerators. Process data Sewage flow, Q = 6,7 to 12,5 m³/h Hydraulic retention time, = 3,6 bis 6,7 hrs. Temperature, t = 7 °C to 18 °C Dissolved O2 ~ 3,0 mg/L
- 4. 4 4 BOD5 = 80 to 180 mg/L TKN = 27 to 52 mg/L N-volumetric loading rate, LV = 0,15 to 0,3 kg TKN/m³ x day. sampling and analyses: 3 x per week. Carrier material has been added in the begin of November into the reactor, cubes became wetted and fluidised within few hours. Nitrification has started after three weeks at 17°C, achieving a degree of ammonia oxidation of 70 to 80 % , keeping stable also at 12°C in mid of December (figure 4), respective over the winter months. A hydraulic peak loading caused end of March an almost quantitative washout of the suspended part of biomass and a peak in the N-loading rate, resulting in reduced N-removal efficiencies (days 33 to 38), however due to the immobilised part of biomass, the nitrification efficiency has been recovered within 2 to 3 weeks. After stabilisation and increased temperatures of 17 to 18°C , nitrification capacity reached 60 to 80 g N/kg MLSS x day achieving 90 to 98% TKN- removals (Tab.3, Fig. 5). Process conditions VDS-N (gNoxidized/kg MLSSxday ) suspended sludge at 10-13°C 10 to 20 immobilised sludge at 10-13°C 40 to 50 immobilised sludge at 17-18°C 60 to 80 Tab.3 Nitrification capacity of the biomass at different conditions 0,0 5,0 10,0 15,0 20,0 25,0 30,0 35,0 40,0 45,0 50,0 1 3 5 7 9 11 13 15 17 19 21 23 25 27 29 31 33 35 37 39 41 43 45 47 49 N(mg/L) TKNein 07.11 NH4Nab NO3Nab 12.12 02.0502.02 28.03 Fig. 4 TKN-inlet- and NH4N-/NO3N-outlet values of nitrification with immobilised microorganisms at 10 to 17°C Additionally to immobilised part, a remarkable amount of suspended biomass was present in the fluidised medium, improving the elimination .The amount of sludge growing on the carrier surface was determined via dry weight analyses.
- 5. 5 5 As the test period continued, the carries began to develop visible growths and finally the sludge measured from the carrier material corresponded to 4,2 g/L of activated sludge), while the excess of the attached sludge had been removed automatically by fluidisation of the medium. 0,000 20,000 40,000 60,000 80,000 100,000 120,000 1 3 5 7 9 11 13 15 17 19 21 23 25 27 29 31 33 35 37 39 41 43 45 47 49 F:MN VDS-N °C 07.11 02.0212.12. 28.03 02.05 gN/kgMLSSxd Fig. 4 Nitrogene F:M-ratio and nitrification capacity during the tests The behaviour of colonised carriers in the reactor was studied by determining the carrier density (cubes/L) in the reactor as a function of air volume. Carrier density was determined three times, approximately once a month and all tests gave similar results. The highest density as a function of air flow was found at 6 to 7 m³ / m² basin surface per hour, within the range required for aeration of aerobic basins (fig. 5). In measurement glass tests, the settling velocity of colonised carriers was measured at 100- 150 m/h. During breaks in aeration all carriers sunk to the bottom. Due to the anoxic zones generated inside of carrier cubes, 40 to 60 % of the produced nitrate load became denitrified. 0 10 20 30 40 50 60 70 0 2 4 6 8 10 12 12.Apr. 27. Apr 27. Mai wL-air (m³/m²xh) cubes/L Fig.5 Fluidisation of colonised carrier at different aeration densities
- 6. 6 6 Process alternative with pre-denitrification In order to study efficiency and process stability with standard preliminary denitrification, after a year the pilot plant has been reconstructed into a two-step plant (Fig. 6) with sludge recycling rates varied from 315% to 480%. Additionally, for phosphate removal a peristalting pump for continuous dosage of 53 to 89 g/m³ FeSO4 x7 H2O has been installed. At increased volumetric N-loading rates and low temperatures a stable nitrification has been established soon after startup (Fig. 6). Pre-denitrification step resulted in enhanced total nitrogene elimination (Kangas, A. 1991). 0,0 10,0 20,0 30,0 40,0 50,0 60,0 1 3 5 7 9 11 13 15 17 19 21 23 25 27 29 31 33 35 37 39 41 43 45 47 N (mg/L) TKNZul. NH4NAbl. Tage NO3NAbl. Fig.6 Nitrification with preliminary denitrification at 11 to 17°C A successful reproduction of the process in a 1000 m³ reactor using 130 m³ carrier, followed by analysis of process economy showed, that plant upgrading by this way is possible to realize for ca. 35 to 45 % of costs of equivalent plant extension. Elimination of hazardous organic pollutants In a further test under similar conditions (Friehmelt,V. 2005.) nitrification and removal of hazardous polycondensated aromatics (PAH) by immobilised and suspended sludge have been compared. Additionally to a better nitrification, immobilised cells have removed both a higher amount of produced nitrate and polycondensed aromatic compounds, especially naphthalene. Parameter inlet Outlet: plant w. susp. biomass Outlet: plant w. LEVAPOR COD * (mg/L) 215 - 300 42 - 135 22 - 35 NH4N+ * (mg/L) 33 - 51 2,5-9,6 0,5 -1,5 Naphtalene (mg/l) 0,19 0,01 Phenantrene (mg/l) 0,16 0,03 0,02 Fluoranthene (mg/l) 0,14 0,02 0,01 Sum PAH,(EPA) (mg/l) 0,92 0,34 (-63%) 0,05 (-96%) Tab. 4 Elimination of hazardous pollutants in plants using adsorbing, porous carrier
- 7. 7 7 COD- and NH4N-removal at elevated loading rates Due to increasing population and industrial production, several sewage treatment plants in Egypt use to be operated on, or in some cases also over their capacity limits. Because of limited space and high costs for new plants, their upgrading became an attractive alternative. In order to check, if by plant upgrading an expensive extension could be avoided, in the lab of a large municipal plant removing only COD and BOD, applicability and removal limits of biofilm technology were investigated under stepwise enhanced loading rates. The test plant, filled with 15 vol.% carrier cubes was started under conditions of full scale plant (Tab. 5). : hydraulic retention time, H.R.T = 6,4 hrs. corresponding with volumetric loading rates, Lv = 2,0 kgCOD/m³xd, following results: parameter dimension inlet outlet COD mg/L 522 54 BOD mg/L 267 21 NH4N mg/L 25,9 NH4N = 9,3 mg/L NO3N = 1,9 mg/L Table 5 Performance of the full scale plant at startup of biotests After startup and stabilisation, water flow, resp. loading rates were increased stepwise every 3-4 weeks and operated under varied conditions until a volumetric COD loading rate of Lv = 3,0 g COD/L x d . Due to the results presented in figures 7, resp. table 6. after addition of carrier COD- and BOD-removal became more efficient and remained stable even under elevated loading rates, while outlet COD- and BOD values fluctuated within moderate limits. Further also SVI- values decreased remarkably after phase A, while suspended solid concentrations in clarifier outlet remained within a usual range of fluctuations practically stable. Phase HRT LVCOD SVI CODout BODout NH4Nout (h) g/Lxd mL/g mg/L mg/L mg/L A 6,6 1,2 107,2 35,0 6,0 0,7 B 5,24 1,,5 67,5 44,9 8,0 11,9 C 3,94 2,1 70,4 43,3 9,0 7,0 D 2,66 3,0 72,0 49,9 7,9 5,9 Table 6. Proces conditions and average plant performances during various process conditions Although not required, nitrification has started directly after carrier-addition under simultaneous removal of generated nitrate under aerobic conditions, remaining stable despite to suddenly increased loading rates. A week later however, process became unstable, but reco-vered efficiency within ten-eleven days, despite to further increased loading rates (Fig. 8). Nevertheless, in phase D with further elevation of COD- and N-loading rates by 47,1 % nitrification became again unstable. Although not a research target, but it should be noted that under higher constancy of process conditions this process would achieve higher efficiency.
- 8. 8 8 0,00 10,00 20,00 30,00 40,00 50,00 60,00 70,00 1 3 5 7 9 11 13 15 17 19 21 23 25 27 29 31 33 35 37 39 41 N (mg/L) NH4Nin NH4Nout NO3Nout phase B phase C phase D d +27,1% +33,1% +47,1% Fig. 7 Influence of increased loading rates on stability of nitrification CONSLUSIONS Combining polymeric foams and different adsorbing pigments with defined characteristics, new types of synthetic carrier materials with wider fields of application have been obtained. Their application in the treatment of municipal sewage enabled in the practice establishment of an efficient nitrification process, stable also in winter, plus a more effective removal of hazardous pollutants (PAH), confirming the advantages and applicability of the method also in this field. At unusually COD volumetric loading rates of Lv ~ 5,0 g COD/L*d , practically the same COD- and BOD outlet concentrations were registered as at 2,0 g COD/L*d. REFERENCES Atkinson, B. (editor) „Biological Fluidised Bed Treatment of Water and Wastewater“, Ellis Howard Ltd, Chichester, 1981 Bock, M. „Anaerober Abbau von 3-Chlorbenzoesäure mit trägerfixierten Mikroorganismen“, Abschlußbericht des Forschungsprojektes, Jülich (Jan. 1991) Friehmelt, V. et al. “Verfahren zum Abbau organischer Schadstoffe in Abwasserbehandlungs- anlagen”, KA-Abwasser,Abfall 2005 (52),4, 415 – 426. Kangas, A. „Experimences on Free Swimming Carrier Material in a Nitrifying Activated Sludge Process“, Report to Water and Wastewater Authority, Jan. 1991, 1 - 30 Loidl, M. u.a. „Steigerung der Detoxifikationsleistung eines Bioreaktors durch den Zusatz eines PU-Schaums“, Forum Städte-Hygiene, 45, (1994), 142 - 147 Loidl, M., u.a. „Mikrobielle Detoxifikation von Anilin- und Chloranilingemischen unter
- 9. 9 9 Einsatz eines PUR-Trägers“, ibid., S 50 – 51 Loidl, M. „Evaluation of the Effects of a Polyurethare Carrier on the Degradation of Chlori- nated Anilines by Pseudomonas acidovorans CA 50“,Acta Biotechnol, 14 (1994), 1, 3 – 12 Pascik, I. „Modified Polyurethane Carriers for Biochemical Waste Water Treatment“, Wat. Sci. Techn., Vol. 22, No. 1/2. 33 - 42, 1990 Pascik, I. und Henzler, J. „Anaerobic treatment of waste water from pulp bleaching plants with immobilized organisms.”, Anaerobic digestion 1988, 5th International Symposium on Anaerobic Digestion, Bologna, Advances in Water Pollution Control, Vol. 5, 491 - 497