PMP Chap 6 - Project Time management - Part2

Free Video Training on Youtube - PMBOK6th edition: 1. Integration Management: https://youtu.be/NdzADFfoRxA 2. Scope Management: https://youtu.be/9u6f2NXlGnI 3. Quality Management: https://youtu.be/8zteKSxDyt4 4. Stakeholder management: https://youtu.be/Vhjc6T9R4d8 PMBOK 6th edition slides by process: https://www.slideshare.net/anandbobade/chap-60-schedule-management-overview https://www.slideshare.net/anandbobade/chap-61-plan-schedule-management https://www.slideshare.net/anandbobade/chap-62-define-activity https://www.slideshare.net/anandbobade/chap-63-sequence-activity https://www.slideshare.net/anandbobade/chap-64-estimate-activity-duration https://www.slideshare.net/anandbobade/chap-65-define-schedule https://www.slideshare.net/anandbobade/chap-66-control-schedule

Recommandé
Recommandé
Contenu connexe
Tendances
Tendances (20)
En vedette
En vedette (20)
Similaire à PMP Chap 6 - Project Time management - Part2
Similaire à PMP Chap 6 - Project Time management - Part2 (20)
Plus de Anand Bobade
Plus de Anand Bobade (18)
Dernier
Dernier (20)
PMP Chap 6 - Project Time management - Part2
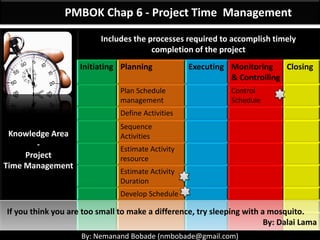
- 1. By: Anand Bobade (nmbobade@gmail.com) Plan Schedule management Define Activities Sequence Activities Estimate Activity resource Estimate Activity Duration Develop Schedule Control Schedule Planning Monitoring & Controlling Learn Project Management & prepare for PMP exam: • Learn visually • Detailed coverage of all PMP concepts • Sample Questions Chapter 6 : Project Time Management (Part 2)
- 2. By: Anand Bobade (nmbobade@gmail.com) 6.5 Estimate Activity Duration Estimate Activity Duration Definition Important terms Estimate Activity Duration : ITTO Main activity estimation techniques Data flow diagram Review Guidelines for exam questions Self Assessment 6.1 I T&T O
- 3. By: Anand Bobade (nmbobade@gmail.com) 6. Project Time Management 6.1 Plan Schedule management: The process of establishing policies, procedures, & documentation for planning, developing, managing, executing, & controlling the project schedule 6.2 Define Activities: The process of identifying and documenting the specific actions to be performed to produce the project deliverables. 6.3 Sequence Activities: The process of identifying and documenting relationships among the project activities.
- 4. By: Anand Bobade (nmbobade@gmail.com) 6. Project Time Management 6.4: Estimate Activity resource: Estimating the type and quantities of material, human resources, equipment, or supplies required to perform each activity 6:5 Estimate Activity Duration: Estimating the number of work periods needed to complete individual activities with estimated resources 6:6 Develop Schedule: Analysing activity sequences, durations, resource requirements, and schedule constraints to create the project schedule model 6.7 Control Schedule: Monitoring the status of project activities to update project progress and manage changes to the schedule baseline to achieve the plan.
- 5. By: Anand Bobade (nmbobade@gmail.com) 6.5 Estimate Activity Duration-> Introduction SME Technical Lead Solution Architect Quality expert Estimation is joint activity, respective experts has to estimate their work. PM is responsible to aggregation.
- 6. By: Anand Bobade (nmbobade@gmail.com) 6.5 Estimate Activity Duration Estimating number of work periods needed to complete each activity with estimated resources. It is a major input to Develop Schedule process. Activity Estimating Work Periods per activity With estimated resources
- 7. By: Anand Bobade (nmbobade@gmail.com) 6.5 Estimate Activity Duration-> Important Terms Example: Painting a house • 20 daysEfforts • 10 days • With 2 resources Duration • 15 days • Includes (2 weekends & 1 day holiday by resources) Elapsed Time Day1 Day2 Day3 Day4 Day5 Day6 Day7 Day8 Day9 Day10 Day11 Day12 Day13 Day14 Day15 Work Started 1-Jan (Sunday) Work completed 15-Jan (Sunday) Weekend Weekend Resource on Holiday
- 8. By: Anand Bobade (nmbobade@gmail.com) 6.5 Estimate Activity Duration-> Important Terms Efforts: • Labour units required to complete activity. • Expressed in Hours, Days or Weeks. Duration (work days or work weeks): • Total time (work periods) to complete the activities based on the resources availability. • Does not include holidays & waiting periods. Elapsed Time • Calendar time required to complete activities based on resource availability & including holidays.
- 9. By: Anand Bobade (nmbobade@gmail.com) 6.5 Estimate Activity Duration Inputs (10) • Schedule management plan • Activity list • Activity attributes • Activity resource requirements • Resource calendars • Project scope statement • Risk register • RBS (Resource breakdown Structure) • EEF • OPA Tools & Techniques (6) • Expert judgment • Analogous estimating • Parametric estimating • Three-point estimating • Group decision-making techniques • Reserve analysis Outputs (2) • Activity duration estimates • Project documents updates
- 10. By: Anand Bobade (nmbobade@gmail.com) 6.5 Estimate Activity Duration -> Input Schedule Management Plan Activity list Activity Attributes Activity resource req. Resource Calendars Project Scope Statement Risk Register Resource breakdown structure EEF OPA
- 11. By: Anand Bobade (nmbobade@gmail.com) 6.5 Estimate Activity Duration->Input->Schedule MP Schedule Management plan Estimation techniques & guidelines. Project Schedule Model Organizational Policies & procedure Process Description Establishes policies, procedures & documentation for planning, developing, managing, executing & controlling project schedule.
- 12. By: Anand Bobade (nmbobade@gmail.com) 6.5 Estimate Activity Duration->Input->Activity List Activity list A list of all activities under each work package. Activity ID WBS Id Name Description 501 W50 Compare Furniture brands 502 W50 Find showrooms 503 W50 Get Quotes 504 W50 Compare Quotes
- 13. By: Anand Bobade (nmbobade@gmail.com) 6.5 Estimate Activity Duration->Input->Activity Attributes Activity attributes Additional details of activities, which are useful for estimation. Activity description Predecessor activities Successor activities Logical relationships Leads and lags Resource requirements Imposed dates Constraints Assumptions Person responsible Geographic area or place Calendar
- 14. By: Anand Bobade (nmbobade@gmail.com) 6.5 Estimate Activity Dur.->Inputs->Activity Resource Req Activity Resource Requirements The types and quantities of resources required for each activity in a work package. Aggregated to determine resource estimation for each work package. Resource Type Resource Quantity Total Resources for Work Package Activity ID WBS Id Name Resource Type Quantity 601 W51 Unit Testing Developer 5 602 W51 System Testing Test Analyst 10 603 W51 Performance Testing Sr. Performance Test Analyst 2 604 W51 Security testing Security expert 2
- 15. By: Anand Bobade (nmbobade@gmail.com) 6.5 Estimate Activity Duration->Input->Resource Calendar Identifies working days & shifts when each resource is available. Details about how long resource will be available. Other details – Skill, Skill levels, location etc Resource Calendars • Resource may be material, human resources, equipment etcRemember:
- 16. By: Anand Bobade (nmbobade@gmail.com) 6.5 Estimate Activity Dur.->Input->Project Scope Statement Project Scope statement Project scope statement provides description of the Project scope Major deliverables Assumptions & Constraints • Expect senior expert to work on the technical design due to requirements complexity. • Impact on estimation: Longer estimate; multiple resource may not be able to reduce estimate proportionally. Assumption • Requirement has to be implemented before 1-Aug, due to government legislation. • Impact on estimation: Multiple resource may be added to shorten the duration of activity. Constraint
- 17. By: Anand Bobade (nmbobade@gmail.com) 6.5 Estimate Activity Duration->Input->Risk Register Risk Register Concerns with results of Risk analysis & response planning. List of Risks related to estimations & resources.
- 18. By: Anand Bobade (nmbobade@gmail.com) 6.5 Estimate Activity Duration->Inputs-> RBS Resource Breakdown Structure Hierarchical representation of resources by category or type. Used for searching Resources. Construction Project Labor Managers Manager1 Manager2 Workers Worker1 Worker2 Worker3 Material Building Office setup Equipment Desktop Laptop Printer Projector Supplies Printer Cartridges Papers Stationary
- 19. By: Anand Bobade (nmbobade@gmail.com) 6.5 Estimate Activity Duration -> Input -> EEF EEF Duration estimating databases & other reference data. Productivity metrics. Published commercial information. Location of team members.
- 20. By: Anand Bobade (nmbobade@gmail.com) 6.5 Estimate Activity Duration -> Input -> OPA OPA Historical duration information. Project calendars. Scheduling methodology. Lessons learned.
- 21. By: Anand Bobade (nmbobade@gmail.com) 6.5 Estimate Activity Duration ->Tools & Techniques Expert Judgement Analogues estimation Parametric estimation Three point estimation Group decision making Reserve Analysis
- 22. By: Anand Bobade (nmbobade@gmail.com) 6.5 Estimate Activity Duration -> T&T -> Expert Judgement Expert Judgement All estimations should be done by Experts. Expert can be internal or external. Complex project need many experts. Uses experience of similar projects or instinct. SME Technical Lead Solution Architect Quality expert
- 23. By: Anand Bobade (nmbobade@gmail.com) 6.5 Estimate Activity Duration -> T&T Estimation Techniques: Same in Time management & Cost management Analogues estimation Parametric estimation Three point estimation
- 24. By: Anand Bobade (nmbobade@gmail.com) 6.5 Estimate Activity Duration -> T&T -> Analogues estimation Analogues estimation Estimate duration of activity using historical data from a similar activity or a project. Uses historical information, expert judgment. Think “analogy” – something similar Relatively quick and low cost It is gross value estimation approach. Parameters used: Duration Budget Size Weight Complexity
- 25. By: Anand Bobade (nmbobade@gmail.com) 6.5 Estimate Activity Duration -> T&T -> Analogues estimation Analogues estimation Computer Lab in School A Computer Lab in School B Used when: • Limited information is available. • Similar project information available. • Experienced estimator. In this scenarios - Information available is • Computer configurations • Computer installation duration - 30 min • No. of computer configured - 20 Similar
- 26. By: Anand Bobade (nmbobade@gmail.com) 6.5 Estimate Activity Duration -> T&T -> Parametric estimation Parametric estimation Algorithm is used to calculate duration based on historical data & project parameters. Uses statistical relationship between historical data & other parameters. Railroad Project Highway Project • Accuracy of historical data. • Sophistication & scalability of model. • Quantifiable parameters Can be highly accurate based on: E.g., Construction estimation software
- 27. By: Anand Bobade (nmbobade@gmail.com) 6.5 Estimate Activity Duration->T&T->Three point estimation Three point estimation Estimate duration by applying an average of optimistic, pessimistic & most likely estimates when there is uncertainty in estimates. This is also called as PERT techniques (Program Evaluation and Review Technique). • = (O + M + P) / 3Triangular Distribution • = (O + 4M + P) / 6 Beta Distribution (Weighted average) What's efforts required for activity1: Optimistic = 10 hours (coding guru) Most likely = 12 hours (Regular prog.) Pessimistic = 16 hours (New prog.) Estimation Discussion meeting • = 10+12+16 / 3 • = 12.66 hours Triangular • = [10 + (4X12) + 16] / 6 • = 12.33 hours Beta
- 28. By: Anand Bobade (nmbobade@gmail.com) 6.5 Estimate Activity Duration->T&T->Three point estimation Question: In software project, a module was estimated to take 25 hours for average programmer as the most likely estimate. The pessimistic estimate of 35 hours may be based on the assumption for a newbie, whereas optimistic estimate of 20 hours for a veteran programmer. Calculate the estimation using the weighted average technique. A. 25 B. 25.5 C. 25.83 D. 26 Weighted average = (P + 4M + O)/6 = (20 + 4*25 + 35)/6 = 25.83 hours
- 29. By: Anand Bobade (nmbobade@gmail.com) 6.5 Estimate Activity Duration->T&T->Three point estimation Three point estimation • = ( P – O ) / 6Standard Deviation (SD) Standard deviation represents the distance a given point is from the mean. It is also called sigma, or s. Standard Deviation’s: ±1σ = 68.27% ±2σ = 95.45% ±3σ = 99.73% This is really an approximation of standard deviation. SD calculation/formula in Quality theories like Six Sigma is different. mean, median, and mode are all the same.
- 30. By: Anand Bobade (nmbobade@gmail.com) 6.5 Estimate Activity Duration->T&T->Three point estimation Question: In software project, a module was estimated to take 25 hours for average programmer as the most likely estimate. The pessimistic estimate of 35 hours may be based on the assumption for a newbie, whereas optimistic estimate of 20 hours for a veteran programmer. Using the weighted average technique, you determine that there is a 95.5% probability that the module will be completed in: A. Between 25.83 and 28.33 hours B. Between 23.33 and 28.33 hours C. Between 25.83 and 30.33 hours D. Between 20.83 and 30.33 hours
- 31. By: Anand Bobade (nmbobade@gmail.com) 6.5 Estimate Activity Duration->T&T->Three point estimation Step 1: • Weighted average = (P + 4M + O)/6 • = (20 + 4*25 + 35)/6 = 25.83 hours Step 2: • Standard deviation = (P – O)/6 • = 2.5 hours Step 3: What is the range? • Upper end of the range equals the weighted average + (1, 2, or 3 SD) • = weighted average + 2σ (Refer to SD 2σ values) • = 25.83 + 2*2.5 = 30.83 hours • Lower end of the range equals the weighted average – (1, 2, or 3 SD). • = 25.83 – 2*2.5 hours = 20.83 hours • The answer therefore is D
- 32. By: Anand Bobade (nmbobade@gmail.com) 6.5 Estimate Activity Duration->T&T->Three point estimation Three point estimation Steps: Get the total of the estimates for all activities along the critical path. Take the variance for each activity. Sum them up across the whole project. Take the square root. Variance Formula is used, if you trying to get the estimate for the whole project. • = SD ^ 2Activity Variance (AV) AV is square root of sum of total activity variance. SD for project as a whole is sum of all AV’s.
- 33. By: Anand Bobade (nmbobade@gmail.com) 6.5 Estimate Activity Duration->T&T->Three point estimation Three point estimation AV is square root of sum of total activity variance. SD for project as a whole is sum of all AV’s. 4,356 + 0 + 1,089 + 4,356 = 9,801 AV = √9801 AV= 99 Task1- If SD = 33, then 33 - 100 = -662=4,356 Task2- If SD = 100, then 100 - 100 = 02=0 Task3- If SD = 133, then 133 - 100 = 332=1,089 Task4- If SD = 166, then 166 - 100 = 662=4,356 If SD = 33, then 332 = 1,089. If you sum those figures 1089 + 10,000 + 17,689 + 2,7556 = 56,334. Then AV = √ 56,334 or 237.34. The AV is not the mean. The mean would be 56,334 ÷ 4 = 14,083 The AV is also not the mean of the sum of the SD. That would be 33 + 100 + 133 + 166 = 432 ÷ 4 = 108
- 34. By: Anand Bobade (nmbobade@gmail.com) 6.5 Estimate Activity Duration->T&T-> Reserve Analysis Reserve Analysis Contingency reserves (time reserves or buffers) are used in schedule to account schedule uncertainty. PM has to use reserve to protect baseline & constantly reduce or eliminate it. Quantitative analysis like Monte Carlo can be used to identify reserves. Reserve can be @ Activity level Work package level Can be fixed amount Can be % of the estimates
- 35. By: Anand Bobade (nmbobade@gmail.com) 6.5 Estimate Activity Duration->T&T->Group decision Making Brainstorming: To generate and collect Multiple ideas related to estimation. Delphi Techniques: Structured communication technique developed as systematic, interactive forecasting method which relies on a panel of experts. Nominal group techniques: Enhances brainstorming with a VOTING process used to rank the most useful ideas for further brainstorming or for prioritization Group Decision Making Assessment process with multiple alternatives with an expected outcome in the form of future actions.
- 36. By: Anand Bobade (nmbobade@gmail.com) 6.5 Estimate Activity Duration -> Output Activity duration estimates Project Documents update
- 37. By: Anand Bobade (nmbobade@gmail.com) 6.5 Estimate Activity Duration->Output->Activity Duration estimates Activity duration estimates • It is important to properly communicate estimates. • Estimates should be given in range. • State the confidence level. Communicatin g estimate: Sr. No Activity Duration Description 1 Requirement Gathering 30 days 2 Development 90 days 3 System Testing 15 days 4 User acceptance Testing 20 days 5 Performance Testing 5 days 6 Handover 5 days 7 Project closure 5 days
- 38. By: Anand Bobade (nmbobade@gmail.com) 6.5 Estimate Activity Duration->Outputs->Proj. doc. update Project Documents update • Duration estimates • Basis of estimates Activity attributes • Assumptions • Contingencies Risk register
- 39. By: Anand Bobade (nmbobade@gmail.com) 6.5 Estimate Activity Duration
- 40. By: Anand Bobade (nmbobade@gmail.com) 6.5 Estimate Activity Duration->Review Estimate should be given by experts Three estimating techniques - Analogues, Parametric & Three point Estimation should be performed for each activity Perform reserve analysis
- 41. By: Anand Bobade (nmbobade@gmail.com) 6.5 Estimate Activity Duration-> Questions -1 Which one of the below is not a Three point estimation technique: A. PERT estimation B. Triangular Distribution C. Beta Distribution D. Standard Deviation D - Standard Deviation Both are estimation techniques (BETA distribution [also called as PERT] and Triangular Distribution )
- 42. By: Anand Bobade (nmbobade@gmail.com) 6.5 Estimate Activity Duration-> Questions -2 Which one of the below is not a estimation technique that is used in both Duration & Cost estimates: A. Analogues estimation B. Parametric estimation C. Three point estimate D. Aggregation D - Aggregation All three are estimation techniques except aggregation
- 43. By: Nemanand Bobade (nmbobade@gmail.com) Learn Project Management & prepare for PMP exam: • Learn visually • Detailed coverage of all PMP concepts • Sample Questions
- 44. By: Anand Bobade (nmbobade@gmail.com) 6.6 Develop Schedule Develop Schedule Definition Develop Schedule : ITTO What is PDM & schedule network diagram? What is critical path? What is critical chain? What is Float or Slack? Review Guidelines for exam questions Self Assessment 6.1 I T&T O
- 45. By: Anand Bobade (nmbobade@gmail.com) 6. Project Time Management 6.1 Plan Schedule management: The process of establishing policies, procedures, & documentation for planning, developing, managing, executing, & controlling the project schedule 6.2 Define Activities: The process of identifying and documenting the specific actions to be performed to produce the project deliverables. 6.3 Sequence Activities: The process of identifying and documenting relationships among the project activities.
- 46. By: Anand Bobade (nmbobade@gmail.com) 6. Project Time Management 6.4: Estimate Activity resource: Estimating the type and quantities of material, human resources, equipment, or supplies required to perform each activity 6:5 Estimate Activity Duration: Estimating the number of work periods needed to complete individual activities with estimated resources 6:6 Develop Schedule: Analysing activity sequences, durations, resource requirements, and schedule constraints to create the project schedule model 6.7 Control Schedule: Monitoring the status of project activities to update project progress and manage changes to the schedule baseline to achieve the plan.
- 47. By: Anand Bobade (nmbobade@gmail.com) 6.6 Develop Schedule -> Introduction • Use existing Schedule model(template) • Update with information from previous processes (Activity, sequencing, resources, Duration etc) Enter • Developed Project schedule model • Optimize schedule by Resource leveling/smoothing, resource crashing/Fast tracking etc Optimize
- 48. By: Anand Bobade (nmbobade@gmail.com) 6.6 Develop Schedule Analysing activity sequences, durations, resource requirements & schedule constraints to create project schedule model. Activity sequences Activity Durations Resource Requirements Schedule Constraints To create Project Schedule Analyze It generates schedule model with planned dates for completing project activities.
- 49. By: Anand Bobade (nmbobade@gmail.com) 6.6 Develop Schedule Inputs (13) • Schedule management plan • Activity list • Activity attributes • Project schedule network diagram • Activity resource requirements • Resource calendars • Activity duration estimates • Project scope statement • Risk register • Project staff assignments • RBS • EEF & OPA Tools & Techniques(8) • Schedule network analysis • Critical path method • Critical chain method • Resource optimization techniques • Modelling techniques • Leads and lags • Schedule compression • Scheduling tool Outputs (6) • Schedule baseline • Project schedule • Schedule data • Project calendars • Project management plan updates • Project documents updates
- 50. By: Anand Bobade (nmbobade@gmail.com) 6.6 Develop Schedule -> Input Schedule Manag. plan Activity list Activity Attributes Proj. Schedule Network diagram Activity resource req. Resource Calendars Activity Duration Estimates Proj. scope Statement Risk Register Project Staff assignment Resource breakdown structure EEF & OPA
- 51. By: Anand Bobade (nmbobade@gmail.com) 6.6 Develop Schedule -> Input -> All Schedule Management Plan: • Scheduling method • Tool to be used & Schedule model etc Activity list: • List of all activities to be included in the schedule model. Activity Attributes: • Detailed activity information that will be helpful to develop schedule. Project Schedule Network diagram: • Graphically shows activity dependencies. • Shows predecessors and successors.
- 52. By: Anand Bobade (nmbobade@gmail.com) 6.6 Develop Schedule -> Input -> All Activity resource requirement: • Resource type & quantity. Resource Calendars: • Holidays, resource vacations, resource availability. Activity Duration Estimates: • Work periods required to complete each activity. Project scope Statement: • Milestones • Assumptions & Constraints.
- 53. By: Anand Bobade (nmbobade@gmail.com) 6.6 Develop Schedule -> Input -> All Risk Register: • Schedule, estimation & resources related risks. Project Staff assignment: • Resource allocations & commitment to specific activities. Resource breakdown structure: • Resource category, helpful for finding resources used during resource analysis & Reporting EEF: • Communication channel details, Scheduling tool OPA: • Schedule methodology
- 54. By: Anand Bobade (nmbobade@gmail.com) 6.6 Develop Schedule->Tools & Techniques Schedule network Analysis Critical Path method Critical chain method Resource optimization Technique Modeling Technique Leads & Lag Schedule Compression Scheduling tool
- 55. By: Anand Bobade (nmbobade@gmail.com) 6.6 Develop Schedule->T&T->Schedule Network Analysis Schedule network Analysis Various analytical techniques are used to perform Schedule Network Analysis & optimize schedule. Critical path method Critical chain method What-if analysis Resource optimization
- 56. By: Anand Bobade (nmbobade@gmail.com) 6.6 Develop Schedule->T&T->Schedule Network Analysis Schedule network Analysis Activity Activity Description Duration (days) Predecessor A Collect Requirement 50 - B System Design 25 A C Build Module 1 40 B D Build Module 2 50 C E Build Module 3 10 B F Build Module 4 15 E G Build Module 5 30 B H System Testing 25 D,F,G Lets create Project schedule network diagram based on below activities:
- 57. By: Anand Bobade (nmbobade@gmail.com) 6.6 Develop Schedule->T&T->Schedule Network Analysis Creatig a Project Schedule Network diagram: Collect Requirements (A - 50days) Start System Design (B - 20d) Build module 1 (C - 40 day) Build module 2 (D - 50 day) Build module 3 (E - 10 day) Build module 5 (G - 30 day) Testing (H-25 days) Build module 4 (F - 15 day) End • = A->B->C->D->H = 50+20+40+50+25 = 185Path1 • = A->B->E->F->H = 50+20+10+15+25 = 120Path2 • = A->B->G->H = 50+20+30 = 100Path3
- 58. By: Anand Bobade (nmbobade@gmail.com) 6.6 Develop Schedule->T&T-> Schedule network Analysis Critical Path: • Sequence of activities that represents longest path through the project. Critical path is the shortest possible project duration. Collect Req.(50d) Start System Design(20d) Build module 1 (40 day) Build module 2 (50 day) Testing (25 day) End All below activities are on critical path Any delay to activity on critical path will delay project
- 59. By: Anand Bobade (nmbobade@gmail.com) 6.6 Develop Schedule->T&T->Critical Path Method Critical Path method Calculates Early start, Early finish, Late start & Late finish dates. Performing a forward & backward pass analysis through the schedule network. Does not consider resource limitations. • Defines how long non-critical activities can be delayed without delaying project Slack (Float) Method used to estimate minimum project duration Determine amount of scheduling flexibility (Float) on the logical network paths.
- 60. By: Anand Bobade (nmbobade@gmail.com) 6.6 Develop Schedule->T&T->Critical Path Method ES (Early Start) Duration EF (Early Finish) Activity LS (Late Start) Total Float LF (Late Finish) Early Start (ES)EF of immediately preceding activity + 1 (ES+Duration)-1 (LS+Duration)-1 Latest activity can start without delaying project
- 61. By: Anand Bobade (nmbobade@gmail.com) 6.6 Develop Schedule->T&T->Critical Path Method ES Duration (50 days) EF Collect Requirement (A) LS Total Float LF ES Duration (20 days) EF System Design (B) LS Total Float LF Start End Calculate ES, EF, LS, LF using Forward & Backward pass:
- 62. By: Anand Bobade (nmbobade@gmail.com) 6.6 Develop Schedule->T&T->Critical Path Method ES Duration (50 days) EF Collect Requirement (A) LS Total Float (0) LF Early Start (ES) ES Duration (20 days) EF System Design (B) LS Total Float (0) LF Start First activity start on day1 ES = 1 EF=(1+50)-1 = 50 Forward Pass Backward Pass ES = 50 +1 = 51 EF = (51+20)-1 = 70 LS = (70-20)+1 = 51LF = 51 -1 = 50LS = (50-50)+1 = 1 1 50 51 70 7051501
- 63. By: Anand Bobade (nmbobade@gmail.com) 6.6 Develop Schedule->T&T->Critical Path Method 51 20 70 System Design (B) 51 0 70 40 Build – Module1(C) 50 Build – Module2(D) 25 Testing(H) 10 Build – Module3(E) 15 Build – Module4(F) 30 Build – Module4(G) Lets calculate ES, EF, LS, LF for remaining activities:
- 64. By: Anand Bobade (nmbobade@gmail.com) Lets calculate ES, EF, LS, LF for remaining activities: 6.6 Develop Schedule->T&T->Critical Path Method 51 20 70 System Design (B) 51 70 40 Build–Module1(C) 50 Build – Module2(D) 25 Testing(H) 10 Build – Module3 (E) 15 Build – Module4(F) 30 Build – Module4(G) Select largest no 71 71 71 110 100 80 111 81 95 160 161 185
- 65. By: Anand Bobade (nmbobade@gmail.com) 6.6 Develop Schedule->T&T->Critical Path Method 51 20 70 System Design (B) 51 71 40 110 Build–Module1(C) 111 50 160 Build – Module2(D) 161 25 185 Testing(H) 71 10 80 Build – Module3 (E) 81 15 95 Build – Module4(F) 71 30 100 Build – Module4(G) Select smallest no 185161 160 160 160 146 111 145 110 136 71 131 70 Lets calculate ES, EF, LS, LF for remaining activities:
- 66. By: Anand Bobade (nmbobade@gmail.com) 6.6 Develop Schedule->T&T->Critical Path Method 51 20 70 System Design (B) 51 70 71 40 110 Build–Module1(C) 71 110 111 50 160 Build – Module2(D) 111 160 161 25 185 Testing(H) 161 185 71 10 80 Build – Module3 (E) 136 145 81 15 95 Build – Module4(F) 146 160 71 30 100 Build – Module4(G) 131 160 • FF = Earliest ES of next Activity – ES of current Activity – Duration of current activity Amount of time activity can be delayed Without delaying next activity. Slack or Float are same. Total Float TF = LF - EF Total Float TF = LS - ES 65 65 TF = 136 - 71 = 65 60 0 0 0 0 TF = 51-51 = 0 TF of activities on critical path are Zero FF for Activity F 161-81-15 = 65
- 67. By: Anand Bobade (nmbobade@gmail.com) 6.6 Develop Schedule->T&T->Critical Path Method • Total amount of time activity can be delayed Without delaying Project finish date. • TF= Late Start– Early Start • TF= Late Finish– Early Finish Total Float • Amount of time activity can be delayed Without delaying next activity. • FF = Earliest ES of next Activity – ES of current Activity – Duration of current activity Free Float Critical Path method Difference between Total & Free float:
- 68. By: Anand Bobade (nmbobade@gmail.com) 6.6 Develop Schedule->Questions The following is a small section taken from a large network diagram of CRM project schedule, which of the statements is true? A) Task 1 has a free float of 3 days B) Task 2 has a free float of 6 days C) Task 3 has a free float of 9 days D) Task 4 has a free float of 5 days. Answer : Calculate TF for all Tasks: Task1 = 2, Task 2 = 8, Task 3 = 2 & Task 4 = 2 FF for Task1: ES of next – ES of current – Duration of current => 7 – 1 - 6 = 0 FF for Task2: ES of next – ES of current – Duration of current => 17-7-4 = 6 FF for Task3: ES of next – ES of current – Duration of current => 17-7-10 = 0 FF for Task4: ES of next – ES of current – Duration of current => ???? -17-8 = Can’t calculate Hence Answer is B) Task 2 has a free float of 6 days 1 6 days 6 Task1 3 8 7 4 days 10 Task2 15 18 17 8 days 24 Task4 19 26 7 10 days 16 Task 3 9 18 FF = 0 FF = 6 FF = 0 2 8 2 2
- 69. By: Anand Bobade (nmbobade@gmail.com) 6.6 Develop Schedule->T&T->Critical Chain Method Critical chain method Two types: Feeding Buffer Project Buffer Placing buffers on any project schedule path to account for limited resources & project uncertainties. It considers effects of resource allocation, optimization, levelling.
- 70. By: Anand Bobade (nmbobade@gmail.com) 6.6 Develop Schedule->T&T->Critical Chain Method • Placed at point where a chain of activities are not on critical chain. • Feeds into the critical chain. Feeding buffers • Single buffer. • Placed at the end of the critical chain. • Protect slippage along the critical chain. Project buffer Feeding Buffer Feeding Buffer Project Buffer
- 71. By: Anand Bobade (nmbobade@gmail.com) 6.6 Develop Schedule->T&T-> Resource optimization Resource Levelling: • Start and finish dates are adjusted based on resource constraints. • Goal is to balance demand for resources with the available supply. Resource Smoothing: • Adjusts schedule activities. • Ensure requirements for resources do not exceed certain predefined resource limits. • May not be able to optimize all resources. How to allocate resources in a way to bring maximum output. Resource optimization Technique
- 72. By: Anand Bobade (nmbobade@gmail.com) 6.6 Develop Schedule->T&T-> Resource optimization Resource Smoothing: • Critical path is not changed & completion date is same • Activities may be delayed within their free & total float. Resource Levelling: • Notice Change in Duration (Critical path changed) • Timelines extended to adjust resource constraint
- 73. By: Anand Bobade (nmbobade@gmail.com) 6.6 Develop Schedule->T&T-> Modeling Technique Modeling Technique What-If Scenario Analysis: • Evaluating scenarios to predict their effect on schedule. • Achieved by performing Network analysis. • Used to assess feasibility of project schedule under adverse conditions. • Used in contingency & response planning. Enter schedule in Scheduling tool Enter various scenarios Simulate•Scenario1 •Scenario4 •Scenario3 •Scenario2
- 74. By: Anand Bobade (nmbobade@gmail.com) Randomly choose parameters Risk 1 Risk 2 Constraints - Resource Constraints - Milestone 6.6 Develop Schedule->T&T-> Modeling Technique Simulation (Monte Carlo): • Monte Carlo is simulation technique. • It calculate multiple project durations with different sets of activity assumptions. • Uses probability distributions constructed from 3 Point estimates to account for uncertainty. Modeling Technique Develop the analysis Model Generate Multiple options
- 75. By: Anand Bobade (nmbobade@gmail.com) 6.6 Develop Schedule->T&T-> Modeling Technique Business Requirement (BRS) System Requirement (SRS) Sign Contract Team On- board Lead 1 week Lag 3 week Lead: It is amount of time where successor activity can be advanced w.r.t. predecessor activity. Lag: It is amount of time whereby a successor activity will be delayed w.r.t. a predecessor activity. Leads & lags Business Requirement (BRS – 4 weeks) System Requirement (SRS – 4 weeks) W1 W2 W3 W4 W5 W6 W7 W8 W1 W2 W3 W4 W5 W6 W7 W8 Sign Contract Team On- board
- 76. By: Anand Bobade (nmbobade@gmail.com) 6.6 Develop Schedule->T&T-> Schedule Compression Schedule Compression Reduce schedule duration without reducing project scope. Adhere to schedule constraints, imposed dates, or other schedule objectives. Crashing Fast tracking
- 77. By: Anand Bobade (nmbobade@gmail.com) 6.6 Develop Schedule->T&T-> Schedule Compression Crashing: Shorten schedule duration for least cost by adding resources. Fast tracking: Activities done in sequence are performed in parallel for at least some portion of their duration. BRS (1 BA) SRS (1 SA) BRS (2 BA) SRS (2 SA) Design Testing Design Testing W1 W2 W3 W4 W5 W6 W7 W8 Crashed by adding resources W1 W2 W3 W4 W5 W6 W7 W8 Fast tracked by executing activities in parallel
- 78. By: Anand Bobade (nmbobade@gmail.com) 6.6 Develop Schedule->T&T-> Schedule Compression Difference between Crashing & Fast tracking • Adding resources. • Increases cost. • Works with activity on critical path. Crashing: • May result in rework. • Increase Risk. • Assign activity with negative float. Fast tracking:
- 79. By: Anand Bobade (nmbobade@gmail.com) 6.6 Develop Schedule->T&T->Scheduling Tool Scheduling tool It contain schedule model & expedite scheduling process. It generate start and finish dates based on the inputs of activities, resources, activity durations etc.
- 80. By: Anand Bobade (nmbobade@gmail.com) 6.6 Develop Schedule -> Output Schedule baseline Project Schedule Schedule Data Project Calendars PMP updates Project Documents update
- 81. By: Anand Bobade (nmbobade@gmail.com) 6.6 Develop Schedule->Output-> Schedule Baseline Schedule baseline The approved version of a schedule model that can be changed only through formal change control procedures. It is approved by stakeholders as the schedule baseline Approved baseline dates are compared to the actual to determine variance. The schedule baseline is a component of the project management plan.
- 82. By: Anand Bobade (nmbobade@gmail.com) 6.6 Develop Schedule->Output-> Project Schedule Project Schedule Presents linked activities with planned dates, durations, milestones, & resources in the form of Presentation. It is not completed until resources are assigned Should be completed along with PM plan Schedule may be summary or in detail Presented in Graphical formats - Below three forms Milestone Chart Bar Chart or Gantt Chart Schedule network Diagram
- 83. By: Anand Bobade (nmbobade@gmail.com) 6.6 Develop Schedule->Output-> Project Schedule Milestone Chart
- 84. By: Anand Bobade (nmbobade@gmail.com) 6.6 Develop Schedule->Output-> Project Schedule Bar chart or Gantt Chart
- 85. By: Anand Bobade (nmbobade@gmail.com) 6.6 Develop Schedule->Output-> Project Schedule Project Schedule Network Diagram
- 86. By: Anand Bobade (nmbobade@gmail.com) 6.6 Develop Schedule->Output-> Schedule Data Schedule Data Resource requirements by time period - Resource histogram. Scheduling of contingency reserves. Supporting data generated during preparation of the schedule. Milestones Schedule activities Activity attributes Assumptions Constraints. Alternative schedules Best-case or worst-case Not resource- leveled or resource- leveled With or without imposed dates
- 87. By: Anand Bobade (nmbobade@gmail.com) 6.6 Develop Schedule -> Output-> Project Calendars Project Calendars A calendar that identifies working days and shifts that are available for scheduled activities. Identify available work days Marked holidays Multiple Project calendars may be used Get updated throughout the project May identify need of maintaining resource calendars
- 88. By: Anand Bobade (nmbobade@gmail.com) 6.6 Develop Schedule -> Output -> PMP Updates PMP updates • If any change is identify in project schedule management Update Schedule Management plan • Scope changes • Resources assigned to activities Update Schedule baselines
- 89. By: Anand Bobade (nmbobade@gmail.com) 6.6 Develop Schedule -> Output-> Project Documents update Project Documents update • Duration estimates • Basis of estimates Activity attributes • New recourse Activity Resource requirements • Assumptions • Contingencies Risk register • Changes to CalendarCalendars
- 90. By: Anand Bobade (nmbobade@gmail.com) 6.6 Develop Schedule
- 91. By: Anand Bobade (nmbobade@gmail.com) 6.6 Develop Schedule -> Review How to develop schedule & its inputs Schedule network Analysis Critical Path method (Total & Free float) Critical chain method (Feeding Buffer & Project Buffer) Resource optimization Technique (Resource levelling, Smoothing) Modeling Technique (What if analysis, Simulations) Schedule Compression (Crashing & Fast Tracking) Scheduling tool Project schedule (Presentation, Bar or Gantt chart, Milestone chart, Project Schedule Network Diagram)
- 92. By: Nemanand Bobade (nmbobade@gmail.com) Learn Project Management & prepare for PMP exam: • Learn visually • Detailed coverage of all PMP concepts • Sample Questions
- 93. By: Anand Bobade (nmbobade@gmail.com) 6.7 Control Schedule Control Schedule Definition Control Schedule & Integrated change Control Control Schedule : ITTO What is performance review? What are schedule forecast? Data flow diagram Review Guidelines for exam questions Self Assessment 6.1 I T&T O
- 94. By: Anand Bobade (nmbobade@gmail.com) 6.7 Control Schedule • The current status of the project scheduleDetermine • If the project schedule has changedMonitor • The factors that create schedule changesInfluence • The actual changes as they occur & minimize RisksManaging
- 95. By: Anand Bobade (nmbobade@gmail.com) 6.7 Control Schedule If any agile approach is utilized, control schedule is concerned with below: Determining current status of project schedule by comparing total amount of work delivered & accepted against estimates of work completed for elapsed time cycle Conducting retrospective reviews (scheduled reviews to record lessons learned) for correcting processes and improving, if required Reprioritizing the remaining work plan (backlog) Determining the rate at which the deliverables are produced, validated, and accepted (velocity) in given time per iteration Determining that the project schedule has changed Managing the actual changes as they occur.
- 96. By: Anand Bobade (nmbobade@gmail.com) 6.7 Control Schedule-> Definition Monitoring the status of project activities to update project progress & manage changes to schedule baseline to achieve plan. Monitoring status of Project activities Update project progress Manage schedule baseline changes It provides the means to recognize the deviation from the plan, & take corrective & preventive actions & thus minimize the risk.
- 97. By: Anand Bobade (nmbobade@gmail.com) 6.7 Control Schedule Inputs (6) • Project management plan • Project schedule • Work performance data • Project calendars • Schedule data • Organizational process assets Tools & Techniques (7) • Performance reviews • Project management software • Resource optimization techniques • Modelling techniques • Leads and lags • Schedule compression • Scheduling tool Outputs (6) • Work performance information • Schedule forecasts • Change requests • Project management plan updates • Project documents updates • Organizational process assets updates
- 98. By: Anand Bobade (nmbobade@gmail.com) 6.7 Control Schedule -> Input PM Plan Project Schedule Work performance Data Project Calendars Schedule Data OPA
- 99. By: Anand Bobade (nmbobade@gmail.com) 6.7 Control Schedule -> Input ->PMP PM Plan • How to manage Schedule • How to control Schedule Schedule Management Plan • Planned & actual dates • Used for comparisons Schedule baselines
- 100. By: Anand Bobade (nmbobade@gmail.com) 6.7 Control Schedule -> Input->Project Schedule Project Schedule Presents linked activities with planned dates, durations, milestones, & resources in the form of Presentation. Having most recent data is key to control the schedule Latest version of the document Latest activity details (start & completed activity dates)
- 101. By: Anand Bobade (nmbobade@gmail.com) 6.7 Control Schedule -> Input->WPD Work performance Data It is the raw data of the project’s status. Actual cost Actual duration The raw observations & measurements identified during execution of activities.
- 102. By: Anand Bobade (nmbobade@gmail.com) 6.7 Control Schedule -> Input-> Project Calendars Identify available work days Marked holidays Multiple Project calendars may be used Get updated throughout the project May identify need of maintaining resource calendars Project Calendars
- 103. By: Anand Bobade (nmbobade@gmail.com) 6.7 Control Schedule -> Input -> Schedule data Schedule Data All information which are useful to control schedule activities. It is constantly reviewed & updated. List of activities & attributes Milestones Assumptions Constraints
- 104. By: Anand Bobade (nmbobade@gmail.com) 6.7 Control Schedule -> Input ->OPA OPA Schedule control related organizational policies Schedule control tools Monitoring & reporting methods used in organization
- 105. By: Anand Bobade (nmbobade@gmail.com) 6.7 Control Schedule->Tools & Techniques Performance review Project Management Software Resource optimization Technique Modeling Technique Leads & Lag Schedule Compression Scheduling tool
- 106. By: Anand Bobade (nmbobade@gmail.com) 6.7 Control Schedule->T&T->Performance Review Performance review It measure, compare, & analyze schedule performance E.g., Actual start & finish dates, % complete & remaining duration for work in progress. Determine any Deviation from the plan Help take corrective & preventive action Trend Analysis Earn Value Management Critical chain method Critical path method
- 107. By: Anand Bobade (nmbobade@gmail.com) 6.7 Control Schedule->T&T->Performance Review Trend Analysis • Examines project performance over time • Determine whether performance is improving or deteriorating. Pattern Trend Valuable for understanding current performance & for comparison to future performance goals. Detect Trends in work performance data
- 108. By: Anand Bobade (nmbobade@gmail.com) 6.7 Control Schedule->T&T->Performance Review Earn value management • Schedule & Cost performance measurements • As per PMI this is best technique to measure project performance. Percentage complete method: • Comparing planned activity dates against actual dates. • Identify variances between baseline & actuals • Difficult to estimate & may not provide actual picture Schedule performance measurements (SV & SPI) • Schedule variance (SV) • Schedule performance index (SPI) • Assess the magnitude of variation to baseline. Activity start : 1-Jan Status: Not started(0%) Status: 6- Jan (In progress) (40% completed) Activity complete: 15-Jan Status : Completed (100%)
- 109. By: Anand Bobade (nmbobade@gmail.com) 6.7 Control Schedule->T&T->Performance Review Critical path Method • Comparing progress along critical path can help determine schedule status. • The variance on critical path will have a direct impact on the project end date. Critical chain method: • Comparing amount of buffer remaining to amount of buffer needed to protect delivery dates. • Difference between buffer needed & buffer remaining can determine whether corrective action is required or not.
- 110. By: Anand Bobade (nmbobade@gmail.com) 6.7 Control Schedule->T&T->Project Management software Project Management Software Software used for project planning, scheduling, resource allocation, change management , communication etc. Control costs and schedule Baseline Comparison SV, SPI and CV, CPI Cash flow management Monitor & Inform Schedule progress Missed milestones Changes to Critical path Also used for collaboration and communication. Project planning Task management Document sharing and collaboration Calendar and contact sharing Risk and issue management
- 111. By: Anand Bobade (nmbobade@gmail.com) 6.7 Control Schedule->T&T->Project Management software Project Management Software Software used for project planning, scheduling, resource allocation, change management , communication etc. Example, Microsoft Project
- 112. By: Anand Bobade (nmbobade@gmail.com) 6.7 Control Schedule->T&T-> Leads & Lags Leads & lags Lead: It is amount of time where successor activity can be advanced w.r.t. predecessor activity. Lag: It is amount of time whereby a successor activity will be delayed w.r.t. a predecessor activity. Business Requirement (BRS) System Requirement (SRS) Sign Contract Team On- board Lead 1 week Lag 3 week Business Requirement (BRS – 4 weeks) System Requirement (SRS – 4 weeks) W1 W2 W3 W4 W5 W6 W7 W8 W1 W2 W3 W4 W5 W6 W7 W8 Sign Contract Team On- board
- 113. By: Anand Bobade (nmbobade@gmail.com) 6.7 Control Schedule->T&T-> Resource optimization Resource optimization Technique It primarily focus on how to allocate resources in a way to bring maximum output. Resource Levelling: • Start and finish dates are adjusted based on resource constraints • Goal is to balance demand for resources with the available supply. Resource Smoothing: • Adjusts activities of a schedule model • Ensure requirements for resources on project do not exceed certain predefined resource limits.
- 114. By: Anand Bobade (nmbobade@gmail.com) 6.7 Control Schedule->T&T-> Schedule Compression BRS (1 BA) SRS (1 SA) BRS (2 BA) SRS (2 SA) Design Testing Design Testing W1 W2 W3 W4 W5 W6 W7 W8 Crashed by adding resources W1 W2 W3 W4 W5 W6 W7 W8 Fast tracked by executing activities in parallel Schedule Compression Crashing: Shorten the schedule duration for the least incremental cost by adding resources. Fast tracking: Activities or phases normally done in sequence are performed in parallel for at least a portion of their duration.
- 115. By: Anand Bobade (nmbobade@gmail.com) 6.7 Control Schedule->T&T-> Modeling Technique Modeling Technique What-If Scenario Analysis: • Process of evaluating scenarios in order to predict their effect • This is achieved by performing Network analysis • Used to assess the feasibility of project schedule under adverse conditions, • Also used in preparing contingency & response plans. Simulation: • Calculating multiple project durations with different sets of activity assumptions. • Uses probability distributions constructed from 3 Point estimates to account for uncertainty. • Common simulation technique is Monte Carlo
- 116. By: Anand Bobade (nmbobade@gmail.com) 6.7 Control Schedule->T&T-> Scheduling Tool Scheduling tool It contain the schedule model and expedite the scheduling process. It generate project start and finish dates based on the inputs of activities, network diagrams, resources and activity durations. Can calculate floats and generate critical path. Can create schedule baselines & preserve it.
- 117. By: Anand Bobade (nmbobade@gmail.com) 6.7 Control Schedule -> Output Work Performance Information Schedule Forecast Change Request PMP updates Project Documents update OPA updates
- 118. By: Anand Bobade (nmbobade@gmail.com) 6.7 Control Schedule->Output->WPI Work Performance Information The calculated SV and SPI for the WBS components (Control account, work package) Documented and communicated to stakeholders SV SPI
- 119. By: Anand Bobade (nmbobade@gmail.com) 6.7 Control Schedule->Output->Schedule Forecast Schedule Forecast Predictions of projects future conditions & events Projects execution data is constantly analysed which results in WPI. Forecasts are updated and reissued based on WPI. Performance review Trend Analysis EVM WPI
- 120. By: Anand Bobade (nmbobade@gmail.com) 6.7 Control Schedule->Output->Change Request Change Request Modifications to the project scope or project schedule may result in change requests Schedule baseline Scope baseline Components of PMP.
- 121. By: Anand Bobade (nmbobade@gmail.com) 6.7 Control Schedule -> Output PMP updates: • Schedule baseline • Schedule Management plan • Cost Baseline Project Documents update: • Schedule Data • Project Schedule • Risk Register OPA updates: • Causes of variances • Corrective action chosen and the reasons • Other types of lessons learned from project schedule control
- 122. By: Anand Bobade (nmbobade@gmail.com) • Executing PG ->Direct & Manage process • Generates WPD • Monitor & Control PG - > All Control process • Generate WPI •Monitoring & Controlling PG-> Monitor & Control Project work 6.7 Control Schedule->Output-> WPD & WPI
- 123. By: Anand Bobade (nmbobade@gmail.com) 6.7 Control Schedule -> Data Flow Diagram
- 124. By: Anand Bobade (nmbobade@gmail.com) 6.7 Control Schedule -> Review How to control schedule? Schedule performance review? Schedule forecast? Schedule Compression (Crashing & Fast Tracking) Scheduling tool
- 125. By: Nemanand Bobade (nmbobade@gmail.com) Learn Project Management & prepare for PMP exam: • Learn visually • Detailed coverage of all PMP concepts • Sample Questions
- 126. By: Anand Bobade (nmbobade@gmail.com) To Learn Project Management, Contact Anand Bobade (055 5932004) •nmbobade@gmail.com •https://ae.linkedin.com/in/anandbobade •http://www.slideshare.net/anandbobade •Conduct Online training, Corporate Training, evening & weekend workshops. Free learning resources