Rising Above_ Dubai Floods and the Fortitude of Dubai International Airport.pdf
Kinematics 2011 part2
1. flipperworks.com
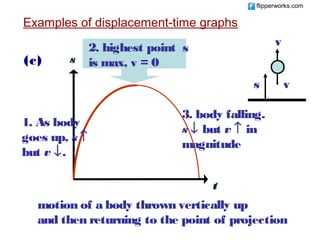
Examples of displacement-time graphs
K v
2. highest point s
i (c) s is max, v = 0
n
s v
e
m 3. body falling.
1. As body
a goes up, s ↑ s ↓ but v ↑ in
t but v ↓. magnitude
i
c t
s motion of a body thrown vertically up
and then returning to the point of projection
2. flipperworks.com
Velocity and Acceleration
Definition Graphically
Velocity Rate of ds Gradient of s-t
change of v= graph
displacement dt
Acceleration Rate of Gradient of v-t
dv
change of
velocity
a= graph
dt
3. flipperworks.com
K [b] Velocity-time graph
i
n shows the velocity of a body at any
e instant of time.
t
i the gradient of the graph is the
c instantaneous acceleration of the body.
s
the area under the graph is the
displacement of the body.
4. flipperworks.com
v
B C
A
Area = A1
O E H t
Area = A2
D
F G
v (+ve when pointing to the right)
O
5. flipperworks.com
v
B C
A
Area = A1
O E H t
Area = A2
D
F G
O to A
v increases from zero at constant
rate
⇒ body is moving from rest with
uniform acceleration
6. flipperworks.com
v
B C
A
Area = A1
O E H t
Area = A2
D
F G
A to B
v increasing but gradient decreasing
⇒ body continues to move faster but
with decreasing acceleration.
7. flipperworks.com
v
B C
A
Area = A1
O E H t
Area = A2
D
F G
B to C
v remains constant
⇒ zero acceleration
8. flipperworks.com
v
K
B C
i A
n Area = A1
e E H
O t
m D Area = A2
c F G
s
C to D
v decreases at a constant rate but still
positive
⇒ acceleration is constant but negative
i.e. constant deceleration.
9. flipperworks.com
v
B C
A
Area = A1
O E H t
Area = A2
D
F G
D to E
v = 0 ⇒ body is stationary
10. flipperworks.com
v
Q: At time F, is
B C displacement of car
A negative?
Area = A1
O E H t
Area = A2
D
F G
E to F
v negative but magnitude is increasing at
constant rate ⇒ body is moving in opposite
direction and speeds up ⇒ uniform negative
acceleration.
11. flipperworks.com
v
Q: At time F, is
B C displacement of car
A negative?
Area = A1
O E H t
Area = A2
D
F G
v (+ve when pointing to the right)
O A B C D
HG F E
12. flipperworks.com
v
K
B C
i A
n Area = A1
e E H
O t
a D Area = A2
t F G
i
c F to G
s v remains constant
13. flipperworks.com
v
B C
A
Area = A1
O E H t
Area = A2
D
F G
G to H
v is negative but acceleration is
positive ⇒ constant deceleration.
Body slows down and comes to rest
at H
14. flipperworks.com
v
B C
A
Area = A1
O E H t
Area = A2
D
F G
Total distance moved = A1 + A2
Net displacement = A1 - A2
15. flipperworks.com
Examples of velocity-time graphs
(a) v (b) v
2
3
1
t t
line 1: uniform velocity increasing acceleration
line 2: uniform acceleration
line 3: uniform deceleration
16. flipperworks.com
Q: Can it be ball thrown
v upwards, hitting ceiling
(c)
and bouncing back?
0 t
Ball, released from rest at a certain height,
hitting the floor and bouncing back
17. flipperworks.com
(c) +
v
v2
g
0 t v2
-v1 v1
free fall ⇒ acceleration = gradient = -g
18. flipperworks.com
Example 2:
v/ s-1
m Velocity after 10 s
= 0.80 x 10
= 8.0 m s-1
8.0
total distance travelled
= area under graph
= ½(20 +30) 8.0
t/
s = 200 m
0 10 30
19. flipperworks.com
Example 3:
The graph shows the variation with time of the
velocity of a trolley, initially projected up an
inclined runway.
Velocity/m s-1
0.8
0.6
0.4
0.2
θ
0 Time/
s
-0.2
-0.4
-0.6
-0.8
20. flipperworks.com
(a) maximum distance
= area under v-t graph between t = 0 & t = 2.5 s
= ½ × 0.80 × 2.5 = 1.0 m
Velocity/m s-1
0.8
0.6
0.4 Trolley reaches
0.2 max. distance
0 Time/ velocity = 0
when
s
-0.2
-0.4
-0.6
-0.8
21. flipperworks.com
(b) a = gradient of v-t graph
0.00 - 0.80
= = - 0.32 m s-2
2.5 - 0.0
∴ deceleration = 0.32 m s-2
Velocity/m s-1
0.8
0.6
0.4
0.2
0 Time/
s
-0.2
-0.4
-0.6
-0.8
22. flipperworks.com
(c) displacement = total area under graph
= 1.0 + (-1.0)
=0m
Velocity/m s-1
0.8
0.6
0.4
0.2 +1.0
0 Time/
s
-0.2
-0.4 -1.0
-0.6
-0.8
23. flipperworks.com
(d) Trolley travels 1.0 m up the runway with
uniform deceleration, stops momentarily at
t = 2.5 s and then accelerates uniformly
down the runway.
Velocity/m s-1
0.8
0.6
0.4
0.2
0 Time/
s
-0.2
-0.4
-0.6
-0.8
24. flipperworks.com
Displacement
Speed
Velocity
Acceleration
Average speed
Average velocity
WORDS &
TERMS
KINEMATICS
EQUATIONS
GRAPHS
25. flipperworks.com
Equations representing uniformly
accelerated motion in a straight line
Suppose that a body is moving with constant
acceleration a and that in a time interval t, its
velocity increases from u to v and its
displacement increases from 0 to s .
v
u
0 t
Since a = d v / d t ⇒ a = v - u
t
Hence v = u + at -------------- (1)
26. flipperworks.com
Since velocity increases steadily,
u+v
average velocity, < v > =
2
Recall: displacement, s = average velocity × time
Thus, s = ½ (u + v) t ------------- (2)
Substituting (1) into (2),
s = ut + ½ at2 -------------- (3)
27. flipperworks.com
v -u
From (1), t =
a
Substituting this into (2),
u+v v -u
s = ×
2 a
Therefore v 2 = u 2 + 2 a s -------- (4)
28. flipperworks.com
Kinematics equations for uniformly
accelerated motion in a straight line :
v = u +at
s = ½ (u + v) t recall & derive
s = u t + ½ a t2
v2 = u2 + 2 a s
Since u, v , a and s are vector quantities,
their directions must be taken into
account when solving problems.
29. flipperworks.com
Sign Conventions
Eg. A ball is released from a certain height.
Starting
+ position
s is -ve
a is -ve
v is -ve