Targeting Double Dividends in Indo-Gangetic Basin: Improving Water Productivity and Alleviating Poverty
•
1 j'aime•496 vues

Presented at the 2nd Phase Planning and Review Workshop of the Indo-Ganges Basin Focal Project, 24-25 February, 2009, Haryana, India

Recommandé
Recommandé
Contenu connexe
En vedette
En vedette (16)
Similaire à Targeting Double Dividends in Indo-Gangetic Basin: Improving Water Productivity and Alleviating Poverty
Similaire à Targeting Double Dividends in Indo-Gangetic Basin: Improving Water Productivity and Alleviating Poverty (12)
Plus de Water, food and livelihoods in River Basins: Basin Focal Projects
Plus de Water, food and livelihoods in River Basins: Basin Focal Projects (20)
Dernier
Dernier (20)
Targeting Double Dividends in Indo-Gangetic Basin: Improving Water Productivity and Alleviating Poverty
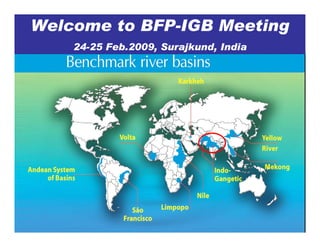
- 1. Welcome to BFP-IGB Meeting 24-25 Feb.2009, Surajkund, India
- 2. Targeting Double Dividends in Indo-Gangetic Basin: Improving Water Productivity and Alleviating Poverty Sub-basin boundary AVHRR-LULC
- 3. Content • Purpose of the Workshop • Logic and Structure of BFPs • Brief tour of the Indus-Gangetic realities • Brief review of WP content -WP1- Water Poverty -WP2- Water Resources -WP3- Water Productivity -WP4-Institutions -WP5- Interventions….Change -WP6- Knowledge Sharing and Impact • Structure of the Meeting
- 4. Purpose of the Workshop •Update and Sharing -What’s been done in 2008 and before •Reflection & Discussion -Are we moving on the right track with the right speed? -What works, What doesn’t -How the project can create the desired impact? •Plan for the Future -What we will do in 2009 and beyond? Outputs need to delivered and the impact created……
- 5. Logic and Structure Background Demography Rural poverty Economic overview Agriculture What is the overall situation? Water productivity Water availability Crop water productivity, kg/m3 Climate water account Water value-adding $/m3 Water allocation water hazards Net value/costs What is the water balance? How well is the water used? Policies and Institutions Farming Water Water rights water policies Land rights Governance Power Infrastructure Supply chains Who ‘handles’ the water? Who enables farmer to improve productivity? Poverty analysis Rural poverty details Water-food related factors What links water, food and poverty? Interventions WEAP Trend analysis Land use change analysis What are foreseeable risks and opportunities for change?
- 6. Targeting Double Dividends in Indo-Gangetic Basin: Improving Water Productivity and Alleviating Poverty “Indo-Gangetic Basin” “Hunger Index of IGB IGB Profile Countries” • Basin area 225 million-ha Countries Rate Scaling Performance Indian States Hunger • Population (2001) 747 million China 7.1 5.0-9.9 MODERATE Score • Percentage rural population (2001) India 75 Nepal 20.6 Bihar 27 Pakistan 68 Pakistan 21.7 Haryana 20 20-29.9 ALARMING Nepal 86 India 23.7 Punjab 14 Bangladesh 80 Bangladesh 25.2 Rajasthan 21 • Percentage of population below Poverty line (2000) 30.5 EXTREMELY Uttar Pradesh 22 Ethiopia 31 > 30 • Net cropped area 114 million-ha ALARMING West Bengal 21 • Water use in agriculture 91.4% Source:Welt Hunger Hilfe, IFPRI, Concern Worldwide (October 2008) Madhya Pradesh 31 "What IGB - BFP will do" ACTION FIELDS OUTPUTS Poverty Analysis • Mapping sub- national poverty • Dynamics of spatial and temporal variation of poverty “Putting Action Fields together” • Gender inequality and water use Water Availability • Water accounting in the sub-basins of the four access analysis countries • Detailed water balances for representative sub-basins Water Productivity • Spatial variation of agriculture water productivity analysis • Access spatial linkages with agriculture input, socio- economic and environmental factors and poverty • Sub basin assessment of water productivity assessment Water Institutions • Comparative assessment of existing institutions and analysis policies • Pro-poor Agriculture Water Management (AWM) strategies “Challenges in IGB” • Energy- irrigation nexus and fishery cultivation in the FOCUS Low water productivity abreast with high poverty and eastern basin environmental degradation • Transboundary issues and legislating context Intervention analysis • Overview of interventions in productivity improvements CHALLENGES and poverty alleviation •High heterogeneity • Impact assessment of potential intervention •Transboundary issues Knowledge base • Developing web portal for accumulation and sharing of •High dependency on groundwater platform existing and generated knowledge •Dependency on glacier/ice melt & climate change impacts • Developing decision support system • Targeted dissemination and learning from common •Demographic pressure experiences •High rural population & dependency on natural resources CONSTRAINTS •Lack of effective institutions “Preliminary Results” •Poor information base •Inadequate targeted interventions KHARIF RABI •Availability and accessibility of information TARGETS •Water-land-gender-poverty relationships •Assessing water supply and demand •Mapping water productivity •Setting the institutional frame for an efficient and equitable water use •Identifying potential interventions •Generating Knowledge platform OUTCOMES Making informed decisions for improving water productivity, alleviating poverty, and reducing human deprivation Trends in water productivity in rice, Bangladesh Districts (1968-2004)
- 7. Socio-economic and water status of IG Basin countries Parameters Bangla. India Nepal Pakistan Acc. to improved water resources,% 74 86 90 91 Acc.to improved sanitation, % 39 33 35 59 Per cap. Electricity consumption, kWh 145 594 91 493 Popu. Below national poverty 49.8 28.6 30.9 32.6 line Agriculture, % of GDP 20.1 18.3 38.2 21.6 Per capita GDP (USD) 406 640 252 632 IRWR (m3/cap./yr) 688 1149 7539 325
- 8. Freshwater under Threat Parameter Indus GBM Resource Stress 0.49 0.39 (scarcity, variation) Development Pressure 0.51 0.17 (exploitation, DW inaccessibility) Ecological Insecurity 0.80 0.57 ( water pollution, ecosystem deterioration) Management Challenges 0.57 0.65 (WU inefficiency, Sani. inaccess., Conflict manage) Vulnerability Index 0.59 0.45 GDP/m3 of water use 3.34* 3.47* *Global average:$8.6/m3; Avg five top food producers(Bra,Chi,Fra,Mex,US):$ 23.8/m3 Source: Babel and Wahid(2008)( Freshwater under Threat: South Asia)
- 9. Biomass Dynamics in Indus and Ganges Basin level scale using AVHRR Mega Dataset Scaled NDVI January, 1984 (Rabi crop) May, 1984 (driest period) September, 1984 (Kharif crop- wettest period) May, 2000 (driest period) September, 2000 (kharif crop- January, 2000 (Rabi crop) wettest period)
- 10. Flooding in the Ganges Basin 250 Eastern Asia SouthEast Asia South Asia West Asia Damages Bangladesh India Nepal Pakistan 200 Deaths 52,033 55,656 5,637 8,877 Number of flood events 150 Population 304.63 763.99 2.98 37.69 affected (million) 100 Homeless 1321000 4219724 84925 4234415 0 50 Injured 102390 1561 1072 1981 0 Estimated Cost 60-69 70-79 80-89 90-99 00-08 12038.4 29417.2 0.977 2865.2 Period (US$ M)
- 11. WP1: Poverty and Water Poverty Analysis Upali, Stefanos, Gias…..Madar Poverty analysis package reviews and analyzes the existing poverty and water- poverty-gender information in order to bridge the gap/s between aggregate and specific analyses of poverty; illustrate the links between inter-sectoral uses of water and links between water and other determinants of poverty.
- 12. Trends of Poverty Spatial variation of rural poverty in India, Pakistan, Bangladesh and Nepal in 2000
- 13. Water, Land and Poverty Nexus 100 HCR 1999- 2000 HCR and % Area (%) 80 60 Net irrigated area-% of net sown area Rural head count ratio 40 Groundwater across lad holding classes 20 irrigat ed area - % of t otal 0 Rural head count ratio across land holding classes H aryana Kerala Bihar Gujarat Punjab Karnataka Maharashtr a Madh ya Prade sh Aru nacha l Prad esh H ima chal Prade sh An dhra Prade sh Rajastha n Tamil Na du Uttar Prade sh Orissa Sikkim Assam West Bengal 60 45 HCR (%) 30 15 Rural head count ratio and net 0 irrigated and groundwater irrigated medium Medium Marginal Small Landless Large large Very Small- area Land holding size India Pakistan Bangladesh Nepal
- 14. WP2: Water Availability Luna, Upali, Asad, Ambili ……. Water availability ( How much and where?) Climate ( and its Change) Water account Water allocation Water hazards What is the water balance?
- 15. Whole Basin Indus and Gangetic Basin Sub-Basins • PODIUM-Sim for the whole IG Basin •WEAP Modelling for individual Ganges and Indus basins and scenario building •SWAT/ SWAP Models for Sub-Basins Major challenge: inaccessible river flow data, transboundary nature
- 16. TRWR and per capita water resources in the Indus and Gangetic IGB basins TRWR Per capita water resources (m3/person) (km3) 1990 2000 2025 2050 Indus- India 97 2487 2109 1590 1732 Indus- Pakistan 190 1713 1332 761 545 Ganga - India 663 1831 1490 969 773 Water resources potential and availability of the Indian portion of IGB Water Resources Indus Ganges Total IGB (India) Average annual surface water potential (km3) 73.3 523.0 596.3 Estimated Utilizable flow excluding ground water (km3) 46.0 250.0 296.0 Total replenishable ground water resources (km3) 26.5 171.0 197.5 Per Capita available water (m3) 2382 1951 2166.5 Static fresh ground water resource (km3) of IG Basin River Alluvium/ Unconsolidated Hard Total Basin Rocks Rocks Indus 1,334.9 3.3 1,338.2 Ganga 7,769.1 65 7,834.1
- 17. Gorai-River Catchment Study the effect of upstream water resource development and as well as the influence of land use change on the hydrology and water balance of the Gorai River Catchment 500 1965-75 1990-99 400 Flow (MCM) 300 200 Average monthly inflow to the Gorai 100 Catchment measured at Gorai 0 Jan Feb Mar Apr May Jun Jul Aug Sep Oct Nov Dec railway-bridge at two time periods Month
- 18. WP3: Water Productivity Analysis Cai, Bharat, Upali, Gias, Susana, Asad Water Productivity • Basin performance on agril. water utlisation - Crop (livestock, fish ) water productivity kg/m3 - Water value-adding $/m3 - Net value/costs Factors affecting water productivity Scope for WP Improvement How well is the water used?
- 19. Crop Dominance Map Introd. Data A “crop dominance map” of namely year LULC 2008 shows major crops rice and wheat Prod. area, and other mixed croplands. Watering Water sources are also given for IGB map. Results Plan
- 20. Water Productivity Maps Rice productivity (kg/m3) Introd. Data LULC Mean AVG SDV Min Max Prod. 0.618 0.618 0.306 0.09 2.5 Water Results Plan
- 21. Other Studies completed, ongoing……. • Spatio-temporal analysis of district level rice productivity in Bangladesh • Water productivity in Rechna-Doab in Pakistan • Fish water productivity and poverty in Bangladesh • District-level foodgrain water productivity for India
- 22. WP4: Institutional Analysis ( Tushaar, Aditi, Dhruba, Sanjiv…RPS) Policies and Institutions Water Farming Land rights Infrastructure Water rights Water policies Governance Energy policies Supply chains Who ‘handles’ the water? What enables farmer to improve productivity?
- 23. Understanding the impact of selected economic and legal variables Impact of rising diesel prices on agricultural water use 3-5 8-10 m ha Extent and cost of different sources of irrigation in India
- 24. Additional Studies…… • Water Control and Land-Lease Markets in India and Nepal • Policy and Legal Analysis for IG basin Countries
- 25. WP5: Analysis of Interventions (Bharat, Rajinder,Cai,Asad, Gias..) Set of physical, institutional and policy level interventions having potential of significantly improving productivity and livelihoods •Water allocation analysis •Land use change analysis •Best water management practices analysis
- 26. Some potential interventions……….. • Resource conservation (including laser land leveling) technologies in western IG basin •Lining of water courses in IBIS (Pakistan) •Multiple water use systems in Eastern Gangetic basin •Improved fisheries management in Bangladesh •Making optimum use of areas afflicted with salinity and waterlogging •Potential of improved water management practices in Eastern Gangetic basin
- 27. WP6: Knowledge Management and Impact Pathways (Matin, Bharat and all) Component Function Data Management Data acquisition, Collation of spatial data, prepare metadata Access to existing Knowledge harvesting, Sharing knowledge Knowledge Investigation, analysis, synthesis Development Application Informed Decision making Knowledge Publication, communication, Knowledge portal Dissemination development
- 28. Project Work Packages - Relationship WP-6: Knowledge WP-5: Intervention management Analysis WP-1: Understand the WP-3: Understand WP-2: Understand WP-4: Institutional nature and location water productivity across water availability Analysis of water poverty the basin
- 29. IMPACT PATHWAY – NETWORK MAP – Nepal WB, UN PC Nepal UNDP 3 CPWF 2 ☺ MOWR 2 WECS PSC 2 IWMI GWB MOA 2 ☺ NGO’s/ Consult 2☺ ants DOI/CB 1☺ MOLD S/DIHM RFAI FO/WUA/ /NARC WG 1☺ 2☺ 2☺ 1☺ District WSDA Farmer UNIV’s level s/ WG ☺ GO/INGO 2☺ 1☺ ’s 2 Green – Funding agency, Blue – Research partner, ☺-Receptive Numbers show Red- Scale out of products on the ground, -Neutral degree of importance Black – Scale up of products at the policy level -No so receptive for change
- 30. Structure of the Meeting • After this Session, session on Water Poverty followed by lunch • In all there shall be six sessions devoted to each of the work packages •In each sessions there shall be few in-house presentations and some very interesting presentations by the potential partners. •Style- highly relaxed and informal •Today evening- we shall have a relaxation hour followed by dinner •Tomorrow morning the sessions shall begin at 0900 and hope to be completed by 1630 hours.
- 31. Tushaar SHAH Taming the Anarchy: Groundwater Governance in South Asia Appointment as IWMI Fellow Congrats! !!
- 32. Madar Samad Regional Director: South ASIA
- 33. UPALI AMARASINGHE Promotion ,Publication and Providential Windfall $$$$$$
- 34. ADITI MUKHERJEE GDN Award, Canberra For Best Research Paper And Mainstreaming with IWMI !!!!!!!
- 35. Peter McCornick and Alok Sikka From IWMI with love to Duke University, NC Moving from BFP-IGB Basin Coordinator to NRAAI
- 36. THANK YOU VERY MUCH !!!