1. Performance funding of Swiss universities - success or
failure?
An ex post analysis
Andrea Schenker-Wicki
Mark Huerlimann
University of Zurich
Institute for Strategy and Business Economics
Switzerland
17 (Published in Higher Education Management and Policy, 2006, Volume 18 (1), p. 53-69,
ISSN 1682-3451)
2. 18 Executive Summary
In the past decade, based on a change in paradigms in university policy, performance funding on
a cantonal and central state level has been introduced in Switzerland: the universities have been
granted higher autonomy, combined with global budgets and contract management by the
responsible authorities (cantonal authorities). At the same time, the allocation of the central state
subsidies, which is only of a secondary nature, has no longer been based on input but on the
achievement of targets (new University Funding Law from the year 1999). As the introduction of
these new performance-oriented elements – higher autonomy combined with global budgets and
contract management and target-oriented allocation of central state subsidies led to intensive,
sometimes controversial debates in the different parliaments and media. This work examines
whether - and to what extent - these new incentives have led to behavioral changes at the
universities. To test this, the development of efficiency - as an input/output comparison in the
university production process - and that of effectiveness - as the degree to which targets
formulated in the University Funding Law are achieved - has been analyzed. With respect to
input factors the number of students and the expenditures for the academic personnel, with
respect to the output factors the number of diplomas and dissertations are used.
Based on the hypothesis that due to increased autonomy in strategic and operational
management, efficiency enhancement ought to be possible (better internal organization), the
development of efficiency at the individual universities was examined by means of a Data
Envelopment Analysis (DEA). The question as to whether increased autonomy for Swiss
universities has paid off and the anticipated improvements in efficiency really have been
achieved could not be conclusively answered on the basis of the available results. It is true that
the number of efficient universities has risen slightly, but this positive development is not
significant.
Apart from efficiency, there was an interest form our side to question whether the objectives with
respect to target-oriented funding really have been achieved (effectiveness test) and whether the
universities have developed in the direction desired by the legislators. To do so, the indicators
which are applied to allocate the central state subsidies have been analyzed for the period 2000-
2003. Analogous to efficiency, the test of effectiveness also results in a varying picture. On the
basis of these results, it has to be concluded that the subsidiary target-oriented funding system on
a central state level, has not had a very important influence on university behavior up to now and
seems to be only suitable for steering purposes to a limited extent. These results can be linked
directly to those of Burke & Minassians, who were also able to determine only a moderate effect
of the incentives of performance-oriented funding systems 1 .
2
3. INDEX OF TABLES 4
INDEX OF FIGURES 4
1. PERFORMANCE FUNDING OF SWISS UNIVERSITIES - SUCCESS OR FAILURE: AN EX POST
ANALYSIS 5
1.1. UNIVERSITY POLICY IN SWITZERLAND: FRAMEWORK CONDITIONS 5
1.2. A CHANGE OF PARADIGMS IN UNIVERSITY POLICY 5
2 HAVE THE UNIVERSITIES BECOME MORE EFFICIENT? 6
2.1 METHOD AND DATA (FOR THE TECHNICAL DETAILS SEE ANNEX) 6
2.2 RESULTS 7
3. HAVE THE UNIVERSITIES BECOME MORE EFFECTIVE? 8
3.1. TARGETS AND PERFORMANCE INDICATORS 8
3.2. REDUCING THE STUDY TIMES 9
3.3. INCREASING THE NUMBER OF FOREIGN STUDENTS 10
3.4. INTENSIFYING THE RESEARCH ACTIVITIES 11
3.5. INCREASING THE ACQUISITION OF PRIVATE FUNDS 12
3.6. OVERALL DEVELOPMENT OF EFFECTIVENESS 13
4. SYNOPSIS: EFFICIENCY AND EFFECTIVENESS 14
5. ENDNOTES 18
0
3
4. Index of tables
Table 1: Efficiency data for the years 2000-2003 8
Table 2: Success in teaching: percentage of norm-time students for the years 2000 – 2003 9
Table 3: Success in teaching: foreign students in Switzerland in the years 2000 - 2003 11
Table 4: Success in research for the years 2000-2003 11
Table 5: Success in the acquisition of private funds 2000-2003 12
Table 6: Overall development of effectiveness 14
1 Index of figures
Figure 1: Synopsis of efficiency and effectiveness 15
4
5. 2 1. Performance funding of Swiss universities - success or failure: an ex post analysis
1.1.
7 University policy in Switzerland: Framework conditions
University policy in Switzerland, as in all federally organized states, is a complex matter because
numerous parties, often with diverging interests, take part. In Switzerland, the cantons are the
legislative bodies for the universities and therefore largely responsible for financing them 2 . This,
however, does not apply for the two federal technical universities in Zurich and Lausanne (ETHZ
and EPFL): These two universities with the ETHZ being the most famous university in
Switzerland are completely financed and kept under surveillance by the Swiss Confederation.
With respect to the cantonal universities the Confederation has merely a secondary allocation
function. This is also reflected in the legislation: the cantonal universities are subject to cantonal
legislation whilst, at the level of the Confederation, there is only a framework law which mainly
regulates the co-operation in the university sector and the central state subsidies which are
allocated from the Confederation to the university cantons (University Funding Law) 3 .
Due to the different responsibilities and different funding mechanisms with respect to the
cantonal and federal universities, the ETHZ and EPFL are not in the sample analyzed in this
article.
1.2.
8 A change of paradigms in university policy
In recent years, university policy in Switzerland has undergone a change in paradigms: state
governance and control has been replaced by supervision. The universities have been granted a
larger degree of autonomy 4 , associated with global budgets and contract management
(performance funding), and central state subsidies were consistently attuned to targets
(performance-oriented in the new University Funding Law from 2000). Largely responsible for
this change were new trends in Public Management based on institutional economics and
theories of social choice 5 . In view of the heated and emotionally driven debates which preceded
the paradigm change and the corresponding legislation, this article concentrates particularly on
whether the larger degree of autonomy and the new funding mechanisms did actually lead to a
better performance in the university sector. This would imply that efficiency 6 – doing things
right – and effectiveness 7 – doing the right things – have increased. From economic literature it
is widely known that an increase in autonomy not only produces a better quality but also leads to
a higher efficiency due to the fact that motivation is positively affected.
In the first part of this article, the development of efficiency in the last few years will be
analyzed with respect to the enlarged degree of autonomy which hypothetically should lead to
5
6. efficiency gains. In a second part, there will be a discussion of effectiveness. The task is thus to
examine whether the targets associated with the new University Funding Law have been
achieved or not (effectiveness test). In the third part a synopsis is given, enabling an assessment
of the overall performance defined as efficiency and effectiveness. In order to calculate the
efficiency, a Data Envelopment Analysis model was used, enabling the identification of the so-
called "organizational slack" 8 , while the effectiveness was measured by the change in the most
important indicators derived from the targets given by the University Funding Law.
3 2 Have the universities become more efficient?
2.1
9 Method and data (for the technical details see annex)
A major advantage, repeatedly discussed during the reforms in the Public Management sector is
improved efficiency associated with a higher level of autonomy and with an increased financial
flexibility. The improved efficiency is defined as a higher output with respect to a certain input
level and should primarily be due to the notion that a specific organization, armed with the
necessary financial and organizational freedom, is better motivated and able to regulate its
internal matters than a distant ministry. As the universities have enjoyed this new freedom since
the nineties, it should be possible to make efficiency gains visible over the course of time. Due to
the fact that public expenditures have increased about 23.4% in the university sector in the last
eight years, we can assume a comparable ability of the different universities to increase
efficiency.
To analyze the assumed efficiency gains a method belonging to the Data Envelopment Analysis
(DEA) 9 methods is used. The DEA methods calculate the efficiency - defined as a relation of
different input and output factors - based on an optimization process. 10&11 If teaching and
research are defined as the main activities of a university, the so-called university production
function must comprehend input and/or output factors from both, teaching and research. With
respect to this, the number of diplomas and the number of dissertations were selected as output
factors. The diplomas are considered to be the most important factor describing the teaching
while the dissertations count for the research activities. As input factors the number of students
and the expenditure for the scientific personnel (costs in CHF) were chosen, whereas the number
of students represents primarily the teaching activities, whilst the expenditure for the scientific
personnel counts for teaching and research. There is of course a whole row of further factors
which could be used on the input as well as the output side. But in the DEA method, with respect
to combinatory considerations, the number of input and output factors must be restricted in
relation to the number of test units. 12
6
7. Because the DEA methods allocate optimal weights to all input and output factors, the maximal
weights are placed on those factors in which a university does better in comparison with other
universities. The prime advantage of the DEA method is that the weights of the input and output
factors do not have to be determined ex ante and therefore subjective weightings are excluded.
Due to the optimization of weightings the DEA methods are very benevolent which means that
inefficiencies calculated by this kind of methods cannot be denied: inefficient universities de
facto have efficiency problems!
Test units: All the ten cantonal universities in Switzerland were examined. Unfortunately, a sub-
division into academic disciplines was not possible because the corresponding data is not
available. This will only be possible in 2006 at the earliest. Therefore there might be
compensation effects between different disciplines.
2.2
10 Results
According to Table 1, the universities of Fribourg, Neuenburg and Lausanne had efficiency
problems in 2002 and 2003, whilst all the other universities can be described as efficient. Since
this efficiency can be considered as a so-called "soft efficiency", it has to be assumed that those
universities which are shown in Table 1 as inefficient really do demonstrate inefficiencies in
comparison with other, comparable universities, and those inefficiencies cannot be glossed over.
Particularly noteworthy in Table 1 is the behavior of the University of Lausanne which has been
gone through a major restructuring process for several years (closing some departments and
transferring them to the EPFL). This process appears to be paying off because the University of
Lausanne has been able to enhance its efficiency in the last years. With respect to the universities
of Fribourg and Neuenburg a possible explanation for the efficiency problems could be their size
and the number of programs they offer: Both universities are rather small and are so-called full
universities offering studies in humanities as well as in technical and/or life sciences. But both of
them have difficulties to cope with the fast growing expenditures demanded by those disciplines
to be state-of-the-art. Due to that they attract not so many students in the corresponding
disciplines. This results in a weak efficiency based on relatively high expenditure for the
scientific personnel coupled with a low number of students on the input side and a few diplomas
and dissertations on the output side. Besides that, the University of Fribourg offers medical
studies only for the first two years, which additionally lowers its efficiency due to the fact that
these students do not pass a final exam in Fribourg. In contrast to the Universities of Lausanne,
Fribourg and Neuenburg, the University della Svizzera Italiana has shown a unique inefficiency
number in the year 2000 due to the growth of this young university, accredited in 2000. In the
following years there was no further inefficiency to be observed.
7
8. Table 1: Efficiency data for the years 2000-2003
Efficiency
Year
University
2000 2001 2002 2003
Basel 1 1 1 1
Berne 0.927 1 1 1
Fribourg 1 1 0.966 0.814
Geneva 1 1 1 1
Lausanne 0.830 0.924 0.917 0.947
Lucerne 1 1 1 1
Neuenburg 0.946 0.902 0.882 0.925
St. Gallen 1 1 1 1
Zurich 1 1 1 1
USI* 0.749 1 1 1
* Università della Svizzera Italiana
The question as to whether autonomy for the Swiss universities has paid off cannot be answered
based on the efficiency calculated in this paper. Taken as a whole, the behavior of the
universities is too heterogeneous and the results are not significant. If the year 2003 is compared
with the year 2000, it can be seen that in 2000, four universities were inefficient, whilst in 2003
only three universities were battling against inefficiencies. This leads to the assumption that
efficiency gains are possible. But, even though autonomy has increased everywhere 30% of the
universities still show inefficiencies.
4 3. Have the universities become more effective?
In testing the effectiveness, the focus is primarily on examining the change of the so-called
performance indicators derived from the targets given by the University Funding Law. The task
is to determine whether the objectives associated with the target-oriented funding are achieved or
not. Since the objectives of the University Funding Law are, however, not explicitly available the
effectiveness can be tested only in an indirect way. We therefore assume a quasi effectiveness
test in which it is analyzed whether the individual universities have developed in the direction
desired by the legislators.
3.1.
11 Targets and performance indicators
In order to determine the behavior of the universities, the relative changes in the individual
universities over the last four years – for each year and for the whole period - were identified. To
do so, the most important indicators are derived from the main targets of the University Funding
Law such as:
1st target: reducing the study times (see 3.2)
indicator: number of students in the norm study time
8
9. 2nd target: increasing the number of foreign students (see 3.3)
indicator: number of foreign students
3rd target: intensifying research activities (see 3.4)
indicator: research months per professor granted by state research
promotion institutions
4th target: increasing the acquisition of private funds (see 3.5)
indicator: private funds acquired in CHF
All the calculations were made on the basis of the data-set used by the Federal Statistical Office
and the State Secretariat for Education and Research to allocate the central state subsidies for the
individual universities 13 .
3.2.
12 Reducing the study times
The University Funding Law foresees that expenditure for teaching is to be compensated by
student-related amounts, i.e. that contributions are calculated according to the number of
students. However, as the duration of studies in Switzerland (completion at on average 27.3
years of age) 14 has been criticized as being too long, only those universities should be financially
rewarded that succeed in educating students in a so-called norm study time. The norm study
times are 16 semesters for medicine and 12 semesters for all other academic disciplines.
Table 2: Success in teaching: percentage of norm-time students for the years 2000 – 2003
number of norm-time students / total number of students
Year Change in %
University
2000 2001 2002 2003 2000 – 2003
Basel 85.6 85.9 86.3 87.6 2.3
Berne 84.3 85 86.3 88.5 5
Fribourg 86 86.8 87.1 86.9 1
Geneva 91.4 92.3 92.8 93 1.8
Lausanne 94.4 94.7 95 94.5 0.1
Lucerne - - - - -
Neuenburg 86.2 86.5 85.7 85.9 -0.3
St. Gallen 94.6 95.1 94.7 94.6 0
Zuerich 81.9 82.6 80.4 80.4 -1.8
USI* - - - - -
* Università della Svizzera Italiana
Table 2 shows the percentage of students that were studying within the so called norm study time
compared to the total number of students. Looking at the figures, it becomes clear that for the
period from 2000 until 2003 most of the universities achieved an increase in students studying
within the norm study times, although the increase is rather small. Only the universities of
9
10. Neuenburg and Zuerich show a decrease in the percentage of norm-time students and an increase
in long-term students. Since the Universities of Lucerne and the Università della Svizzera
Italiana were newly founded, they are excluded at this point. In comparison with the overall
number of students in the individual years 88% of all students were within the norm study times
in 2000, in 2003, there were 88.8%. This slight increase in students studying within the norm
study times or decrease of long-term students means that the incentive system in the University
Funding Law is not very effective. That is even more astonishing due to the fact that the inter-
cantonal financial compensation system 15 - money the university cantons receive from the non
university cantons - is similarly structured: universities only receive money for those students
who study within the norm study times. It can be therefore assumed that either the universities
are still hesitating in imposing regulations with regard to norm study plans and times (higher
study fees for long-term students) or that the regulations have not yet been able to show any
effect due to the short period of time considered in this study.
3.3.
13 Increasing the number of foreign students
The costs for foreign students must be carried primarily by the universities because the
universities do not charge cost-covering study fees and the inter-cantonal financial compensation
plays no role at all for the foreign students. Due to various parliamentary interventions in the
passing of the University Funding Law, the consequence is that now, the Confederation is
participating in the financing of foreign students and even more favors an increase in its number.
If the development of foreign students in Switzerland is analyzed in the period 2000-2003, the
number of foreign students has increased by 20% (4,028 students) 16 . In the year 2003 21.4% of
all students were foreign students. The most successful universities were those of Zurich and St.
Gallen, whereas the universities of Berne and Lucerne have relatively few foreign students. The
highest percentage of foreign students are found in the university della Svizzera Italiana and the
universities of Geneva and St. Gallen. On the whole this aim – to increase the attraction for
foreign students - can be regarded as achieved in the sense of the University Funding Law (see
table 3).
10
11. Table 3: Success in teaching: foreign students in Switzerland in the years 2000 - 2003
number of foreign students / total number of students
Year Change in %
University
2000 2001 2002 2003 2000 – 2003
Basel 18.8 % 19 % 20.4 % 20.1 % 7.4 %
Berne 7.7 % 8.1 % 8.3 % 8.2 % 6.5 %
Fribourg 16.8 % 17.4 % 18 % 17.8 % 5.9 %
Geneva 34.9 % 36.3 % 37.6 % 38.3 % 9.5 %
Lausanne 20.7 % 20.4 % 20.8 % 21 % 1.1 %
Lucerne 18.4 % 13.1 % 9.8 % 8.9 % - 51.4 %
Neuenburg 22.9 % 22.9 % 22.6 % 22.9 % 0%
St. Gallen 26.1 % 27 % 29.1 % 31.5 % 20.5 %
Zurich 11.6 % 11.8 % 12.6 % 12.9 % 11 %
USI* 41.6 % 42.7 % 43.1 % 45.7 % 9.8 %
* Università della Svizzera Italiana
3.4.
14 Intensifying the research activities
As basis for the calculation of the research performance serves the research activity granted
from the official state research promoting institutions (Swiss National Science Foundation, EU
research programs or from the Innovation Promotion Agency [CTI]) and calculated in terms of
research months per professor (see table 4). To visualize the research efforts of a university, the
activity figure is a better indicator than the financial streams resulting from research funding
because those can differ considerably depending on the focus of a university17 . Due to that
reason we focused in this paper on the activity and not on the financial streams.
Table 4: Success in research for the years 2000-2003
number of months (SNF, EU, CTI) / professor
Year Change in %
University
2000 2001 2002 2003 2000 – 2003
Basel 17.0 15.0 15.2 18.0 5.9 %
Berne 19.8 19.3 18.7 18.0 - 9.1 %
Fribourg 8.3 8.0 7.7 8.2 - 1.2 %
Geneva 18.1 17.8 18.1 19.0 5.0 %
Lausanne 13.3 13.1 12.6 13.2 - 0.8 %
Lucerne 3.2 1.8 0.8 2.9 - 9.4 %
Neuenburg 12.1 11.8 13.8 13.5 11.6 %
St. Gallen 3.1 3.5 4.2 5.8 87.1 % 18
Zurich 15.7 16.7 16.2 16.2 3.2 %
USI* 3.5 3.5 4.5 6.8 94.2 % 19
* Università della Svizzera Italiana
In table 4 the activities of the individual universities are shown and it can be seen that at the
universities of Berne, Fribourg, Lausanne and Lucerne 20 there is a decrease in research activity
and an increase at the universities of Basel, Geneva, Neuenburg, St. Gallen, Zurich and USI. The
11
12. highest increase is at the University della Svizzera Italiana, albeit at a very low and below-
average level. The leaders in terms of research activity in the year 2003 are the Universities of
Geneva, Basel, Bern and Zurich. They can be described as the most active research universities
in Switzerland with regard to the sample chosen. However, the most famous and internationally
best-ranked university of Switzerland is the federal technical university in Zurich (ETHZ) which
has not been analyzed (see chapter 1.1).
Through the period 2000-2003, the average research activity of the cantonal universities has
risen slightly from 11.4 months in 2000 to 12.2 months per professor in 2003. The critical
question with regard to the effect of the incentive system conceived within the University
Funding Law can therefore be regarded as positive.
3.5.
15 Increasing the acquisition of private funds
As the finances of the public sector are likely to become tighter in the future, one of the aims of
the Confederation was that the acquisition of private funds should be especially rewarded. If the
figures in table 5 are compared, it becomes clear that over the period 2000-2003 all universities
with the exception of the University of St. Gallen have followed this aim: practically all of them
have succeeded in raising their share of private funds. In defense of the honor of the University
of St. Gallen, it must be added that St. Gallen has the highest proportion of private funds (about
33% of its budget) of all the Swiss universities. This is not really astonishing due to the fact that
the University of St. Gallen could be basically considered as a business school with important
activities in the executive education.
In Switzerland, the average financing with private funds amounts to 9.2% in the year 2003.
Particularly successful in increasing the acquisition of private funds were the young universities
of Lucerne and USI as well as the universities of Geneva, Zurich and Basel.
Table 5: Success in the acquisition of private funds 2000-2003
private funds acquisition in thousand CHF
Year Change in %
University
2000 2001 2002 2003 2000 – 2003
Basel 25384 28559 30482 33276 31.1 %
Berne 33549 32486 34256 37412 11.5 %
Fribourg 10938 10619 11307 11768 7.6 %
Geneva 57065 73105 82988 73203 28.3 %
Lausanne 40997 43911 42950 43197 5.4 %
Lucerne 373 604 1033 1280 243.2 %
Neuenburg 12251 16661 12743 13000 6.1 %
St. Gallen 20404 19660 18392 18780 - 8.0 %
Zurich 55464 64570 70474 72441 30.6 %
USI* 604 0 695 1015 68%
* Università della Svizzera Italiana
12
13. In total, private funds have risen throughout Switzerland by 18.8% (CHF 48,343,000) in the time
period 2000-2003. In this sense, the incentive system has been successful and the aim of the
legislators has been achieved.
3.6.
16 Overall development of effectiveness
If the development of the universities in recent years as shown in table 6 is considered, most of
the universities have developed positively in the sense of the original objectives of the
legislators:
- all universities, except Lucerne, achieved an increase in the number of foreign students,
- more than half of the universities developed positively in research activities and
- all universities, except St. Gallen, have been able to record successes in the acquisition of
private funds.
The only goal which was not achieved to a satisfactory extent was the reduction of long-term
students. Almost all universities, except Berne, show no major increase in the norm-time
students: If it is considered, that this indicator goes into the calculation of state subsidies with a
weight of 60%, the effectiveness of the target-oriented incentive system must be provided with a
question mark.
In order to better visualize the overall development of effectiveness, the individual universities
are given points for the achievement of the different targets mentioned in the University Funding
Law such as:
for a small change of -2% <=x<= +2% 0 points
for a change of -10% <x< -2% or +2% <x< +10% -0.5 or +0.5 points
for an important change of -10%>=x or x>=+10% -1 or +1 point
13
14. Table 6: Overall development of effectiveness
Overall development: number of points
Fields
University Long term International Research Private Funds Total Points
study students Acquisition
Basel 0.5 0.5 0.5 1 2.5
Berne 0.5 0.5 - 0.5 1 1.5
Fribourg 0 0.5 0 0.5 1
Geneva 0 0.5 0.5 1 2
Lausanne 0 0 0 0.5 0.5
Lucerne - -1 - 0.5 1 -0.5
Neuenburg 0 0 1 0.5 1.5
St. Gallen 0 1 1 - 0.5 1.5
USI* - 0.5 1 1 2.5
Zurich 0 1 0.5 1 2.5
* Università della Svizzera Italiana
The maximum points the universities of Basel, Berne, Fribourg, Geneva, Lausanne, Neuenburg,
St. Gall and Zurich can get is four. The University of Lucerne and the University della Svizzera
Italiana (USI) can only get 3 points due to the fact that there are very young universities and are
not yet confronted with the problem of long-term students. The most effective universities
according to the University Funding Law were the USI and the universities of Zurich and Basel,
followed by the university of Geneva. The lowest degree of success in terms of fulfilling the
aims of the University Funding Law was recorded by the University of Lucerne, which is the
youngest university among all Swiss universities and still has to cope with the difficulties of a
newcomer (set up new structures, chairs etc.).
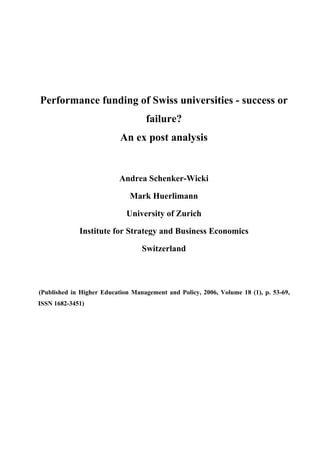
5 4. Synopsis: efficiency and effectiveness
In order to visualize the efficiency calculated in Chapter 2 and the effectiveness from Chapter 3,
the figure 1 shows a synopsis of both.
14
15. Figure 1: Synopsis of efficiency and effectiveness
Effectiveness
from Table 7
3
2.5 Basel, Zuerich, USI
2 Geneva
1.5 Neuenburg Berne/ St. Gallen
1 Fribourg
0.5 Lausanne
0
-0.5
Lucerne
-1
-1.5
-2
0.814 0.925 0.947 1.000 Efficiencies from
Table 1, year 2003
Following a period of time averaging seven years after introduction of the cantonal university
laws, which gave universities more autonomy on the whole, one can note that the transfer of
certain decision-making power and the introduction of contract management and global budgets
have not, per se, led to significantly higher efficiency at the universities. Based on the data which
has been examined, the education authorities in Switzerland can evidently not be held
responsible for inefficiencies which were perceived (or believed to have been perceived) in the
past. One explanation for the absence of efficiency gains could be the failure to implement the
necessary change management process at the universities. In order to achieve efficiency gains,
not only autonomy and global budgets are necessary but also internal organizational reforms,
which affect both processes and structures and, last but not least, demand a change in the
university culture. These changes must, however, come from the universities themselves and
cannot be imposed from outside.
15
16. Whether the target-oriented (performance) funding by the Confederation - the new incentive
system with ideas taken from Public Management - really can prove to be effective, cannot be
conclusively judged today because of the relatively brief period of time since the new University
Funding Law was put into effect (four years). Of particular note is that payment according to
norm study times has not brought a significant reduction of long term studies, although both the
Confederation and the non-university cantons use the same types of incentive system. One
reason for the failure of this incentive could be that the universities have been hesitant to
introduce the necessary regulations - for example significantly higher study fees for long-term
students to support this target. Whether the noted, slight increase in research activity really is
attributable to the incentive system in the University Funding Law is not evident, further
analyses would be necessary.
Due to the tightness of public finance, the universities are forced, up to the level of individual
professorship chairs, to procure additional money above and beyond the ordinary resources. A
possibility in this regard is the procurement of private money. In all universities this possibility
has been actively used, as shown in this article. But, due to the tightness of public finance it has
to be assumed that the higher private funding ratio cannot be attributed only and exclusively to
the incentives given by the target-oriented funding in the University Funding Law, but is also
due to external political pressure.
Although the introduction of target-oriented financing has not led to major changes in the
university sector, this kind of financing is, despite everything, preferable to input-oriented
funding because it is based on targets or objectives to be achieved and not on ownership level
guarantees.
The authors
Prof. Dr. Andrea Schenker-Wicki
University of Zurich
Institute for Strategy and Business Economics
Switzerland
E-mail: andrea.schenker@isu.unizh.ch
Mark Huerlimann
University of Zurich
Institute for Strategy and Business Economics
Switzerland
16
18. 5. 6 Endnotes
1
Burke, J.C., Minassians, H. (2002).
2
The cantons, as responsible authorities, finance an average of about 52% of the budget [Source: Federal Statistical
Office (Hrsg. /1)].
3
The Confederation partly compensates the university cantons for their operating expenditure (basic contributions).
These contributions are allocated target-oriented (indicator based). They reach an average of about 15% of the
annual operating costs of the universities.
4
The following universities received new laws or ordinances:
Basel on 8.11.1995, Berne on 5.9.1996, Fribourg on 19.11.1997, Geneva on 10.12.1998, Lausanne on 20.02.1997,
Lucerne on 17.01.2000, Neuenburg on 15.05.1996, St. Gallen on 03.11.1997, Zurich on
4.12.1998, Svizzera italiana on 3.10.1995
5
See Schenker-Wicki (2004) p. 107
6
Efficiency is defined as an input-output relation and can serve as a measure for the output to be achieved with a
given input.
7
Effectiveness is defined as a measurement for the targets reached
8
See Backes-Gellner, Zanders (1989) p. 275
9
See Charnes, Cooper, Rhodes (1978):output achieved with a given input
10
See Farrell (1957)
11
See Cooper, Seiford, Tone (1999)
12
In this work, a total of four factors were chosen for input and output. This number must be seen in relation to the
decision-making units reviewed. As we only have a total of ten universities in our sample, the application of input
and output factors is limited. As soon as too many factors are chosen, one enters into the risk that through the
exponentially rising number of factor combinations, every decision-making unit becomes efficient and it is
therefore no longer possible to make a clear distinction of efficient and non-efficient universities. (Cooper,
Seiford, Tone (1999) p. 252)
13
See University Funding Law and the Ordinance regarding the University Funding Law
14
Federal Statistical Office (Hrsg./2)
15
As part of an inter-cantonal financial compensation, the non-university cantons pay a fixed sum per student from
their canton to the relevant university cantons.
16
Federal Statistical Office (http://www.bfs.admin.ch/bfs/portal/de/index.html)
17
A university which offers not only art and social sciences but also natural sciences and medicine can show a
higher sum with a lower activity because the research equipment in natural sciences and medicine is considerably
more expensive than that used in the social and art sciences.
18
The number is so high due to the fact that the University of St. Gallen nearly doubled the number of research
months in the near 2003 compared to the year 2000 albeit at a very low level (underperformance).
19
The number is so high due to the fact that the University della Svizzera Italiana nearly doubled the number of
research months in the year 2003 compared to the year 2000. The reason for this increase, albeit at a very low level,
is the rapid growth of this very young university accredited in the year 2000.
20
Of special note is that the University of Lucerne is a very young university, and that makes itself noticeable in
terms of research activity because the teaching staffs are busy with the development of study courses and
professorship chairs, and for this reason, the research activity is pushed into the background.
18
19. 6. Appendix: technical description
The model used in this work belongs to the Data Envelopment Analysis (DEA) methods which
allow to determine the so-called technical efficiency of a certain decision-making unit. Since it is
very difficult to fix a theoretical standard for efficiency ex ante, Farrell estimated an efficiency
line (see Farrell 1957) from the inputs and outputs of a set of decision-making units. If the
assumption applies that the efficiency line is convex, that the slope is always negative and that
the input-output combinations are equivalent on this efficiency line, the efficiency line can be
regarded as a pessimistic estimate for the technical efficiency of the decision-making unit in
question.
The DEA methods are primarily optimization processes. The weighting factors ur and vi of the
various input and output factors yri and xij respectively of a defined decision-making unit (DMU)
are maximized under the pre-condition that with an appropriate weighting, all the other decision-
making units show an efficiency of less than 1. The whole calculation is based on an estimated,
partly linear production function which covers the entire efficient frontiers and is fixed by the
best-practicing units (see Backes-Gellner, Zanders 1989). They build a kind of benchmarking
envelope. Using this process, the weighting is determined for each decision-making unit which,
in the end effect, leads to the highest degree of efficiency and therefore presents the relevant
decision-making unit at its best.
In order to calculate the efficiency, there are the following models of the DEA family, among
others: the CCR model which is based on constant return to scales and the BCC model (see
Banker, Charnes, Cooper (1984)) which foresees a variable return to scales (increasing, constant,
decreasing). With the CCR model, no size effects are taken into consideration; the output always
changes in proportion to the input. Thus, it is assumed that a certain increase of the input
automatically leads to a corresponding increase of the output.
In analogy to Fandel (see Fandel (2003) p. 40), we have decided in favor of an input-oriented
BCC model (see Table 1) which enables the modeling of various realities and statements with
regard to size effects. The major disadvantage of this model is, however, the relatively weak
efficiency calculated. The reason is that the BCC model is a very benevolent model which not
only varies the weightings of the input and output factors but also varies returns to scales
(increasing, decreasing, constant) in favor of a decision-making unit – university – being tested.
Returns to scales are defined as an attribute of a production function with the following
categories to be distinguished:
19
20. Increasing Returns to Scale
When inputs are increased by x and output increases by more than x, the returns to scales are
increasing.
Decreasing Returns to Scales
When inputs are increased by x, but the output increases by less than x, the returns to scales are
decreasing.
Constant Returns to Scales
When inputs are increased by x, and output increases by exactly x, the returns to scales are
constant.
7. Bibliography
Banker, R. D., Charnes, A., Cooper, W. W. (1984): Some models for estimating technical and
scale inefficiencies in data envelopment analysis. In Management Science 30(9)/: 1078
– 1092.
Backes-Gellner, U., Zanders, E. (1989): Lehre und Forschung als Verbundproduktion – Data-
Envelopment-Analysis und organisationsökonomische Interpretationen der Realität in
wirtschaftswissenschaftlichen Fachbereichen. In Zeitschrift für Betriebswirtschaft, 59/:
271 – 290.
Charnes, A., Cooper, W. W., Rhodes, E. L. (1978): Measuring the Efficiency of Decision Making
Units. In European Journal of Operational Research 2(6)/: 429 – 444.
Cooper, W. W., Seiford, L. M., Tone, K. (1999): Data Envelopment Analysis: A Comprehensive
Text with Models, Applications, References and DEA-Solver Software. Boston: Kluwer
Academic Publishers
Fandel, G. (2003): Zur Leistung nordrhein.westfälischer Universitäten: Gegenüberstellung einer
Verteilungslösung und der Effizienzmasse einer Data Envelopment Analysis. In
Backes-Gellner, U., Schmidtke, C. (Hrsg.): Hochschulökonomie – Analysen interner
Steuerungsprobleme und gesamtwirtschaftlicher Effekte, Schriften des Vereins für
Socialpolitik, Neue Folge, Band 296, Berlin 33 –50.
Farrell, M. J. (1957): The Measurement of Productive Efficiency. In The Journal of the Royal
Statistical Society, Series A 120 (3)/: 253 – 290.
Schenker-Wicki, A. (2004): Das System der Hochschulfinanzierung in der Schweiz – ein
weiterführender Ansatz für Deutschland. In: Färber, G., Renn, S. (Hrsg.): Zehn Jahre
20
21. Hochschulreformen seit dem Eckwertepapier - Anstösse, Massnahmen, Erfolg, Dunkcer
& Humblot: Berlin: 107 – 122.
Verordnung zum Universitätsförderungsgesetz (UFV), SR 414.201, Stand: 05.12.2000.
Universitätsförderungsgesetz: Bundesgesetz vom 8.10.1999 über die Förderung der
Universitäten und über die Zusammenarbeit im Hochschulbereich (UFG), SR 414.20, Stand
03.10.2003.
URL - adresses
Bundesamt für Statistik (Hrsg./1): Finanzierung des Aufwandes UH, 2003, in: Internet
http://www.bfs.admin.ch/bfs/portal/de/index/themen/systemes_d_indicateurs/indicate
urs_des_hautes/hochschulindikatoren.tables.10204.html
Access at January 12, 2005
Bundesamt für Statistik (Hrsg./2): Alter beim Erwerb des Lizenziats/ Diplom UH,
Hochschulindikatoren Universität 2003, in: Internet
http://www.bfs.admin.ch/bfs/portal/de/index/themen/systemes_d__indicateurs/indicat
eurs_des_hautes/hochschulindikatoren.indicator.10407.html
Access at January 17, 2005
Staatssekretariat für Bildung und Forschung (Hrsg.): Aufteilung der Grundbeiträge nach UFG,
2000 - 2003: Adresse unter http://www.sbf.admin.ch/index.html
21
22. Note: This publication has been made available by CSEND with the agrement of the author.
The Centre for Socio-Eco-Nomic Development (CSEND) aims at
promoting equitable, sustainable and integrated development through dialogue and
institutional learning.
http://www.csend.org/programmes-a-services
http://www.csend.org/about-csend
http://www.csend.org/project-samples
http://www.csend.org/csend-group
http://www.csend.org/knowledge-area
http://www.csend.org/csend-portraits
http://www.csend.org/community-of-artists
Diplomacy Dialogue is a branch of the Centre for Socio-Eco-Nomic Development
(CSEND), a non-profit R&D organization based in Geneva, Switzerland since 1993.
http://www.diplomacydialogue.org/mission
http://www.diplomacydialogue.org/about-us
http://www.diplomacydialogue.org/projects
http://www.diplomacydialogue.org/publications
http://www.diplomacydialogue.org/conferences
http://www.diplomacydialogue.org/dialogue-forum
http://www.diplomacydialogue.org/partners
http://www.diplomacydialogue.org/links
http://www.diplomacydialogue.org/contact
http://www.diplomacydialogue.org/sitemap