PEST Analysis
•
5 j'aime•1,557 vues

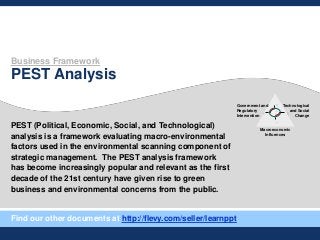
This Slideshare presentation is a partial preview of the full business document. To view and download the full document, please go here: http://flevy.com/browse/business-document/pest-analysis-234 PEST (Political, Economic, Social, and Technological) analysis is a framework evaluating macro-environmental factors used in the environmental scanning component of strategic management. The PEST analysis framework has become increasingly popular and relevant as the first decade of the 21st century have given rise to green business and environmental concerns from the public.
Signaler
Partager
Signaler
Partager

Recommandé
Recommandé
More Information:
https://flevy.com/browse/flevypro/restructuring-redeployment-assessment-management-5439
More Information:
https://flevy.com/browse/flevypro/restructuring-redeployment-assessment-management-5439
Restructuring becomes essential at some stage in the lifecycle of any organization. In order to emerge triumphant through this tumultuous challenge, it is necessary that the focus remains on the challenges impeding the organization, Strategy Development to tackle the challenges, and prioritizing Strategic Initiatives to deliver radical results that lead the organization to Operational Excellence.
Redeployment is the most significant phase in the Restructuring process. Within Redeployment, the Assessment phase is critical as the revitalization of the whole organization is dependent on correct Assessments and right placement of employees based on those Assessments.
Proper Redeployment Assessment Management is of utmost importance in Restructuring, and it should follow a structured approach, which means managing 5 core areas:
Manage Assessment Team
Manage Anxiety Level of Candidates
Manage Amount of “Deviant Behavior” in the Assessments
Manage Level of Duplicity, Wild Guessing, and Other Forms of Distortion
Manage Amount of Feedback and Its Timing after the Event
Managing 5 core areas ensures smooth implementation of the Redeployment Assessment process, which is a major milestone of the Restructuring project.
The Redeployment Assessment process has to be detailed, accurate, and prompt. Due Diligence in documenting the process, verifying particulars, and balance between Rapidity and Accurateness is essential because:
Organizational requirement to concentrate on post-restructuring environment is intense.
Employees’ urge to swiftly find out about their future is deep-seated.
Objections by employee stakeholders, as a consequence of large-scale retrenchment is high.
Probability of legal recourse by employees is also distinct.
Future Employee Engagement is dependent on fair Assessment and correct placements.[Whitepaper] 8 Key Steps of Data Integration: Restructuring Redeployment Asse...
[Whitepaper] 8 Key Steps of Data Integration: Restructuring Redeployment Asse...Flevy.com Best Practices
More Information:
https://flevy.com/browse/flevypro/best-practices-in-strategic-planning-2738
For many organizations, this is the time of the year is when Leadership will conduct the annual Strategic Planning process and plan the near-, mid- and long-term strategies.
This article breaks the full Strategic Planning and Execution processes into 3 sections:
Strategic Planning
Strategy Development
Strategy Execution
For each section, we will highlight important concepts core to the topic, as well as direct you to important resources for further understanding.
1. Strategic Planning
Per Wikipedia, we can define Strategic Planning as:
Strategic Planning is an organization’s process of defining its strategy, or direction, and making decisions on allocating its resources to pursue this strategy. It may also extend to control mechanisms for guiding the implementation of the strategy. Strategic Planning became prominent in corporations during the 1960s and remains an important aspect of strategic management. It is executed by strategic planners or strategists, who involve many parties and research sources in their analysis of the organization and its relationship to the environment in which it competes.
Strategic Planning is a crucial process, but often poorly executed, leading to poor translation from Strategy to Execution.
In most organizations, executives complain that their Strategic Planning is overly bureaucratic, insufficiently insightful, and doesn’t accommodate today’s rapidly changing, digital markets. To combat these issues, there are a few best practices we should follow:
Explore Strategy across 3 time horizons.
Encourage productive and stimulating Strategic Dialogue.
Engage a broad, decentralized group of stakeholders.
Let’s dive a little deeper into each of these best practices.
Explore
The 3 time horizons we want to explore can be defined as short term (1-year timeframe), medium term (3–5 years timeframe), and long term (5+ years). Each horizon is uniquely considered and has different objectives.[Whitepaper] The Definitive Guide to Strategic Planning: Here’s What You Need...
[Whitepaper] The Definitive Guide to Strategic Planning: Here’s What You Need...Flevy.com Best Practices
More Information:
https://flevy.com/browse/flevypro/strategy-classics-porters-five-forces-4051
More Information:
https://flevy.com/browse/flevypro/strategy-classics-porters-five-forces-4051
[Whitepaper] The Definitive Introduction to Strategy Development and Strategy...
[Whitepaper] The Definitive Introduction to Strategy Development and Strategy...Flevy.com Best Practices
More Information:
https://flevy.com/browse/flevypro/theory-of-constraints-1883
The Theory of Constraints (TOC) is a methodology for identifying the most important limiting factor — i.e. constraint — and systematically improving it. It was developed by Dr. Eliyahu Goldratt, introduced in 1984 book, The Goal.
TOC differs from traditional management views, in that traditional methods seek to make improvements throughout the organization. They divide the organization into smaller, more manageable pieces. The objective, thus, is to maximize the performance of each part, resulting in global improvement.
On the other hand, TOC takes a more focused approach. Instead of improving everywhere, the TOC approach seeks only to improve the few variables (or constraints) that have the largest impact on the organization’s performance. By trying to improve everything everywhere, the risk is that nothing will be improved that really counts. TOC follows the adage “a chain is no stronger than its weakest link.” An interesting phenomenon about chains is that strengthening any link except the weakest one does not improve the strength of the whole chain. Strengthening the weakest link produces an immediate increase in the strength of the whole chain, but only up to the level of the next weakest link.
There are 3 types of constraints that exist in an organization:
Capacity Constraint. This constraint occurs when a resource which cannot provide timely capacity as demanded by the system.
Market Constraint. This is when the amount of customers orders is not sufficient to sustain the required growth of the system.
Time Constraint. This occurs when the response time of the system to the requirement of the market is too long to the extent that it jeopardizes the system’s ability to meet its current commitment to its customers as well as the ability of winning new business.
[Whitepaper] The “Theory of Constraints:” What’s Limiting Your Organization?
[Whitepaper] The “Theory of Constraints:” What’s Limiting Your Organization?Flevy.com Best Practices
More Information:
https://flevy.com/browse/flevypro/leadership-competency-model-3661
Leadership has become a usual term often misunderstood by many people even those holding the status of a leader. There is no doubt that everyone can be a leader, but not everyone can be a genius leader. Leadership is far limited to prestige, a high status, or to financial abundance; it is neither about authority nor power. Leadership starts when you go beyond the self to serve and empower others.
This article is not for a purpose to redefine leadership with its different aspects, but it is simply about a great example of leadership that mirrors outstanding performance and remarkable human qualities. Dr. Rachid Yazami is an eminent scientist and best known for his research on lithium ion batteries. This technology is used by billions of people worldwide for their cell phones, cameras, tablets, laptops, power tools, and many other devices. Dr. Yazami started his career from scratch to build an empire based on the battery technology. My main interest is not to make a compilation of his achievements and honors, but to tap into his personality traits and characteristics; to discuss the main qualities that enabled him to succeed as a scientist, a researcher, and a leader of his field. My purpose is to understand also the sources of his inspirations and the secret behind his motivations and limitless resilience. His unique path is a textbook of insightful lessons that I aim to summarize and share with you based on a set of interviews with him.[Whitepaper] A Great Leadership Experience: Dr. Rachid Yazami, Inventor of th...
[Whitepaper] A Great Leadership Experience: Dr. Rachid Yazami, Inventor of th...Flevy.com Best Practices
More Information:
https://flevy.com/browse/flevypro/thomas-kilmann-conflict-mode-instrument-tki-3722
A major reason for employees leaving their workplaces is conflict with their bosses. To succeed in today’s fiercely competitive market, organizations need to invest in developing their leadership, such that they further develop their teams by training them on the desired competencies and create a sense of engagement in them.
A big challenge for leaders is getting their employees to believe in the organizational vision. No two personalities have the same viewpoints and aspirations, thus conflict is bound to occur between team members while they interact.
The Thomas-Kilmann Conflict Mode Instrument (TKI), developed by Dr. Ralph H. Kilmann and Dr. Kenneth W. Thomas, is an easy-to-use, online assessment tool to Conflict Management. Human Resources (HR) and Organizational Design (OD) consultants utilize the TKI tool as a mechanism to initiate discussions on differing topics and facilitate in mediation by learning how conflict-handling modes affect personal, group, and organizational dynamics.
Each of us has a predominant conflict style that we use in a particular situation. The Thomas-Kilmann Conflict Mode Instrument provides a basis to measure a person’s behavior in conflict situations, where individuals appear to be unable to get along. The individuals’ behavior in conflict situations encompasses 2 broad dimensions:
Assertiveness
Cooperativeness
These behavior dimensions define 5 predominant conflict handling styles (or modes) that we use while responding to conflict situations:
Competing
Accommodating
Avoiding
Collaborating
Compromising
Got a question about this presentation? Email us at support@flevy.com.
[Whitepaper] Finding It Hard to Manage Conflict at the Workplace? Use the Tho...
[Whitepaper] Finding It Hard to Manage Conflict at the Workplace? Use the Tho...Flevy.com Best Practices
More Information:
https://flevy.com/browse/flevypro/key-account-management-kam-large-global-accounts-3765
Large accounts make up a significant portion of business for most B2B companies. Therefore, losing an important customer can have detrimental effects on the organization. The significance of key accounts is urging top B2B companies to revisit their key account management approaches. Additionally, the increasing level of sophistication of the purchase process being adopted — such as, centralized procurement, competitive bidding and auctions, and laborious negotiations — by large buyers is a crucial element for B2B companies to consider to win large accounts.
Studies have shown that large buyers suggest price, product features, and reliability as the most important factors in their purchasing decisions, even more so than sales and service experience. However, detailed analysis of data into the actual purchasing decisions by buyers reveal that suppliers’ service and support capabilities mean a lot to large purchasers — in fact, almost as equal in importance as price. Large buyers often involve senior team members in procurement, which necessitates the need for inclusion of people possessing high-quality management and sales skills while serving key accounts.
With more intensifying sophistication of the procurement process at large businesses in future, the buyers will keep trying to cut costs and gain significant advantage while negotiating with procurement. The suppliers, in turn, can create a win-win situation by providing first-rate key account support and service.
Leading suppliers utilize the 4 drivers of growth to develop best-in-class key account management practices and increase their large contract win ratios. These drivers are actually the 4 imperatives that forerunners undertake to fuel their growth:
Quantified Value Proposition (QVP)
Value-based Selling
Coordinated Account Management
Negotiation Preparation
Got a question about this presentation? Email us at support@flevy.com.
[Whitepaper] Key Account Management: Handling Large Global Accounts the Right...
[Whitepaper] Key Account Management: Handling Large Global Accounts the Right...Flevy.com Best Practices
More Information:
https://flevy.com/browse/flevypro/business-model-innovation-bmi-scalable-business-models-5182
Scalability is described as possible meaningful changes in magnitude or capacity. In business terms, it’s the capability of a system to enhance productivity upon resource augmentation. Scalability provides an organization the capabilities to develop compelling value propositions — that are hard to imitate by the rivals — and achieve profitable growth even in the wake of external threats, cut-throat competition, stringent laws, or financial downturns.
Today’s challenging business ecosystems and economic outlook demand from the enterprises to develop novel and Scalable Business Models that are able to leverage positive returns on investments. To accomplish this, leaders need to identify and eradicate any capacity issues, enhance collaboration with existing partners, build new partnerships, or develop platforms to work with their opponents.
Executives should invest in scaling options only when they are sure to boost returns. They have to be quick to exit a business when returns on investment to scale backfire.
5 Patterns of Business Model Scalability
Benchmarking a number of successful organizations reveals that their Business Models were flexible enough to sustain internal and external pressures. Business Model Scalability hinges on aligning the strategic partners and Value Propositions to serve the customers.
To drive Business Model Innovation (BMI), leading organizations consistently display 5 critical patterns of Business Model Scalability:
Operate with multiple distribution channels
Eliminate typical capacity limitations
Outsource capital investments to partners
Allow customers and partners assume multiple roles in the business
Create platform models
Got a question about this presentation? Email us at support@flevy.com.
[Whitepaper] Business Model Innovation: Creation of Scalable Business Models ...
[Whitepaper] Business Model Innovation: Creation of Scalable Business Models ...Flevy.com Best Practices
More Information:
https://flevy.com/browse/flevypro/shareholder-value-traps-5239
Changing industry ecosystems and competition today demand from the organizations to undergo strategic shifts. The purpose of a company is undergoing Business Transformation from serving the interest of shareholders to serving all stakeholders that influence the organization.
Shareholders are often considered the only stakeholders that invest in a business. Senior management needs to be cognizant of the importance of shareholders as well other stakeholders who create value for the organization. They should work on building a collaborative Organizational Culture and paying heed to the welfare of all those groups that play a role in organizational growth.
This warrants a thorough evaluation of all stakeholders, their long-term interests, and Value Creation — or Value Destruction — potential for the organization. But first, this calls for finding answers to the following key questions:
Who creates the most value for the organization?
Who among the stakeholders typically secure the best deals from the organization?
Who is the victim of having the worst deals from the organization?
Who among the stakeholders is potentially untrustworthy?
Are there any intermediaries or stakeholders fulfilling their personal agendas?
Answering these questions is critical for the executives, otherwise they may risk falling into Shareholder Value Traps. Recognizing and understanding stakeholder value traps while the managing stakeholders’ various interests helps executives achieve shared and individual long-term goals. These 5 common traps prevent stakeholders’ interests to get integrated with the interests of the organization and destroy the value of a company if overlooked:
Ignoring cash-flow driving stakeholders while distributing cash
Miscalculating reaction from stakeholders
Supporting under-performing units
Conceding to willful vulture capitalists
Misjudging intermediaries role in transactions
Got a question about this presentation? Email us at support@flevy.com.
[Whitepaper] Shareholder Value Traps: How to Evade Them and Focus on Value Cr...
[Whitepaper] Shareholder Value Traps: How to Evade Them and Focus on Value Cr...Flevy.com Best Practices
Contenu connexe
Plus de Flevy.com Best Practices
More Information:
https://flevy.com/browse/flevypro/restructuring-redeployment-assessment-management-5439
More Information:
https://flevy.com/browse/flevypro/restructuring-redeployment-assessment-management-5439
Restructuring becomes essential at some stage in the lifecycle of any organization. In order to emerge triumphant through this tumultuous challenge, it is necessary that the focus remains on the challenges impeding the organization, Strategy Development to tackle the challenges, and prioritizing Strategic Initiatives to deliver radical results that lead the organization to Operational Excellence.
Redeployment is the most significant phase in the Restructuring process. Within Redeployment, the Assessment phase is critical as the revitalization of the whole organization is dependent on correct Assessments and right placement of employees based on those Assessments.
Proper Redeployment Assessment Management is of utmost importance in Restructuring, and it should follow a structured approach, which means managing 5 core areas:
Manage Assessment Team
Manage Anxiety Level of Candidates
Manage Amount of “Deviant Behavior” in the Assessments
Manage Level of Duplicity, Wild Guessing, and Other Forms of Distortion
Manage Amount of Feedback and Its Timing after the Event
Managing 5 core areas ensures smooth implementation of the Redeployment Assessment process, which is a major milestone of the Restructuring project.
The Redeployment Assessment process has to be detailed, accurate, and prompt. Due Diligence in documenting the process, verifying particulars, and balance between Rapidity and Accurateness is essential because:
Organizational requirement to concentrate on post-restructuring environment is intense.
Employees’ urge to swiftly find out about their future is deep-seated.
Objections by employee stakeholders, as a consequence of large-scale retrenchment is high.
Probability of legal recourse by employees is also distinct.
Future Employee Engagement is dependent on fair Assessment and correct placements.[Whitepaper] 8 Key Steps of Data Integration: Restructuring Redeployment Asse...
[Whitepaper] 8 Key Steps of Data Integration: Restructuring Redeployment Asse...Flevy.com Best Practices
More Information:
https://flevy.com/browse/flevypro/best-practices-in-strategic-planning-2738
For many organizations, this is the time of the year is when Leadership will conduct the annual Strategic Planning process and plan the near-, mid- and long-term strategies.
This article breaks the full Strategic Planning and Execution processes into 3 sections:
Strategic Planning
Strategy Development
Strategy Execution
For each section, we will highlight important concepts core to the topic, as well as direct you to important resources for further understanding.
1. Strategic Planning
Per Wikipedia, we can define Strategic Planning as:
Strategic Planning is an organization’s process of defining its strategy, or direction, and making decisions on allocating its resources to pursue this strategy. It may also extend to control mechanisms for guiding the implementation of the strategy. Strategic Planning became prominent in corporations during the 1960s and remains an important aspect of strategic management. It is executed by strategic planners or strategists, who involve many parties and research sources in their analysis of the organization and its relationship to the environment in which it competes.
Strategic Planning is a crucial process, but often poorly executed, leading to poor translation from Strategy to Execution.
In most organizations, executives complain that their Strategic Planning is overly bureaucratic, insufficiently insightful, and doesn’t accommodate today’s rapidly changing, digital markets. To combat these issues, there are a few best practices we should follow:
Explore Strategy across 3 time horizons.
Encourage productive and stimulating Strategic Dialogue.
Engage a broad, decentralized group of stakeholders.
Let’s dive a little deeper into each of these best practices.
Explore
The 3 time horizons we want to explore can be defined as short term (1-year timeframe), medium term (3–5 years timeframe), and long term (5+ years). Each horizon is uniquely considered and has different objectives.[Whitepaper] The Definitive Guide to Strategic Planning: Here’s What You Need...
[Whitepaper] The Definitive Guide to Strategic Planning: Here’s What You Need...Flevy.com Best Practices
More Information:
https://flevy.com/browse/flevypro/strategy-classics-porters-five-forces-4051
More Information:
https://flevy.com/browse/flevypro/strategy-classics-porters-five-forces-4051
[Whitepaper] The Definitive Introduction to Strategy Development and Strategy...
[Whitepaper] The Definitive Introduction to Strategy Development and Strategy...Flevy.com Best Practices
More Information:
https://flevy.com/browse/flevypro/theory-of-constraints-1883
The Theory of Constraints (TOC) is a methodology for identifying the most important limiting factor — i.e. constraint — and systematically improving it. It was developed by Dr. Eliyahu Goldratt, introduced in 1984 book, The Goal.
TOC differs from traditional management views, in that traditional methods seek to make improvements throughout the organization. They divide the organization into smaller, more manageable pieces. The objective, thus, is to maximize the performance of each part, resulting in global improvement.
On the other hand, TOC takes a more focused approach. Instead of improving everywhere, the TOC approach seeks only to improve the few variables (or constraints) that have the largest impact on the organization’s performance. By trying to improve everything everywhere, the risk is that nothing will be improved that really counts. TOC follows the adage “a chain is no stronger than its weakest link.” An interesting phenomenon about chains is that strengthening any link except the weakest one does not improve the strength of the whole chain. Strengthening the weakest link produces an immediate increase in the strength of the whole chain, but only up to the level of the next weakest link.
There are 3 types of constraints that exist in an organization:
Capacity Constraint. This constraint occurs when a resource which cannot provide timely capacity as demanded by the system.
Market Constraint. This is when the amount of customers orders is not sufficient to sustain the required growth of the system.
Time Constraint. This occurs when the response time of the system to the requirement of the market is too long to the extent that it jeopardizes the system’s ability to meet its current commitment to its customers as well as the ability of winning new business.
[Whitepaper] The “Theory of Constraints:” What’s Limiting Your Organization?
[Whitepaper] The “Theory of Constraints:” What’s Limiting Your Organization?Flevy.com Best Practices
More Information:
https://flevy.com/browse/flevypro/leadership-competency-model-3661
Leadership has become a usual term often misunderstood by many people even those holding the status of a leader. There is no doubt that everyone can be a leader, but not everyone can be a genius leader. Leadership is far limited to prestige, a high status, or to financial abundance; it is neither about authority nor power. Leadership starts when you go beyond the self to serve and empower others.
This article is not for a purpose to redefine leadership with its different aspects, but it is simply about a great example of leadership that mirrors outstanding performance and remarkable human qualities. Dr. Rachid Yazami is an eminent scientist and best known for his research on lithium ion batteries. This technology is used by billions of people worldwide for their cell phones, cameras, tablets, laptops, power tools, and many other devices. Dr. Yazami started his career from scratch to build an empire based on the battery technology. My main interest is not to make a compilation of his achievements and honors, but to tap into his personality traits and characteristics; to discuss the main qualities that enabled him to succeed as a scientist, a researcher, and a leader of his field. My purpose is to understand also the sources of his inspirations and the secret behind his motivations and limitless resilience. His unique path is a textbook of insightful lessons that I aim to summarize and share with you based on a set of interviews with him.[Whitepaper] A Great Leadership Experience: Dr. Rachid Yazami, Inventor of th...
[Whitepaper] A Great Leadership Experience: Dr. Rachid Yazami, Inventor of th...Flevy.com Best Practices
More Information:
https://flevy.com/browse/flevypro/thomas-kilmann-conflict-mode-instrument-tki-3722
A major reason for employees leaving their workplaces is conflict with their bosses. To succeed in today’s fiercely competitive market, organizations need to invest in developing their leadership, such that they further develop their teams by training them on the desired competencies and create a sense of engagement in them.
A big challenge for leaders is getting their employees to believe in the organizational vision. No two personalities have the same viewpoints and aspirations, thus conflict is bound to occur between team members while they interact.
The Thomas-Kilmann Conflict Mode Instrument (TKI), developed by Dr. Ralph H. Kilmann and Dr. Kenneth W. Thomas, is an easy-to-use, online assessment tool to Conflict Management. Human Resources (HR) and Organizational Design (OD) consultants utilize the TKI tool as a mechanism to initiate discussions on differing topics and facilitate in mediation by learning how conflict-handling modes affect personal, group, and organizational dynamics.
Each of us has a predominant conflict style that we use in a particular situation. The Thomas-Kilmann Conflict Mode Instrument provides a basis to measure a person’s behavior in conflict situations, where individuals appear to be unable to get along. The individuals’ behavior in conflict situations encompasses 2 broad dimensions:
Assertiveness
Cooperativeness
These behavior dimensions define 5 predominant conflict handling styles (or modes) that we use while responding to conflict situations:
Competing
Accommodating
Avoiding
Collaborating
Compromising
Got a question about this presentation? Email us at support@flevy.com.
[Whitepaper] Finding It Hard to Manage Conflict at the Workplace? Use the Tho...
[Whitepaper] Finding It Hard to Manage Conflict at the Workplace? Use the Tho...Flevy.com Best Practices
More Information:
https://flevy.com/browse/flevypro/key-account-management-kam-large-global-accounts-3765
Large accounts make up a significant portion of business for most B2B companies. Therefore, losing an important customer can have detrimental effects on the organization. The significance of key accounts is urging top B2B companies to revisit their key account management approaches. Additionally, the increasing level of sophistication of the purchase process being adopted — such as, centralized procurement, competitive bidding and auctions, and laborious negotiations — by large buyers is a crucial element for B2B companies to consider to win large accounts.
Studies have shown that large buyers suggest price, product features, and reliability as the most important factors in their purchasing decisions, even more so than sales and service experience. However, detailed analysis of data into the actual purchasing decisions by buyers reveal that suppliers’ service and support capabilities mean a lot to large purchasers — in fact, almost as equal in importance as price. Large buyers often involve senior team members in procurement, which necessitates the need for inclusion of people possessing high-quality management and sales skills while serving key accounts.
With more intensifying sophistication of the procurement process at large businesses in future, the buyers will keep trying to cut costs and gain significant advantage while negotiating with procurement. The suppliers, in turn, can create a win-win situation by providing first-rate key account support and service.
Leading suppliers utilize the 4 drivers of growth to develop best-in-class key account management practices and increase their large contract win ratios. These drivers are actually the 4 imperatives that forerunners undertake to fuel their growth:
Quantified Value Proposition (QVP)
Value-based Selling
Coordinated Account Management
Negotiation Preparation
Got a question about this presentation? Email us at support@flevy.com.
[Whitepaper] Key Account Management: Handling Large Global Accounts the Right...
[Whitepaper] Key Account Management: Handling Large Global Accounts the Right...Flevy.com Best Practices
More Information:
https://flevy.com/browse/flevypro/business-model-innovation-bmi-scalable-business-models-5182
Scalability is described as possible meaningful changes in magnitude or capacity. In business terms, it’s the capability of a system to enhance productivity upon resource augmentation. Scalability provides an organization the capabilities to develop compelling value propositions — that are hard to imitate by the rivals — and achieve profitable growth even in the wake of external threats, cut-throat competition, stringent laws, or financial downturns.
Today’s challenging business ecosystems and economic outlook demand from the enterprises to develop novel and Scalable Business Models that are able to leverage positive returns on investments. To accomplish this, leaders need to identify and eradicate any capacity issues, enhance collaboration with existing partners, build new partnerships, or develop platforms to work with their opponents.
Executives should invest in scaling options only when they are sure to boost returns. They have to be quick to exit a business when returns on investment to scale backfire.
5 Patterns of Business Model Scalability
Benchmarking a number of successful organizations reveals that their Business Models were flexible enough to sustain internal and external pressures. Business Model Scalability hinges on aligning the strategic partners and Value Propositions to serve the customers.
To drive Business Model Innovation (BMI), leading organizations consistently display 5 critical patterns of Business Model Scalability:
Operate with multiple distribution channels
Eliminate typical capacity limitations
Outsource capital investments to partners
Allow customers and partners assume multiple roles in the business
Create platform models
Got a question about this presentation? Email us at support@flevy.com.
[Whitepaper] Business Model Innovation: Creation of Scalable Business Models ...
[Whitepaper] Business Model Innovation: Creation of Scalable Business Models ...Flevy.com Best Practices
More Information:
https://flevy.com/browse/flevypro/shareholder-value-traps-5239
Changing industry ecosystems and competition today demand from the organizations to undergo strategic shifts. The purpose of a company is undergoing Business Transformation from serving the interest of shareholders to serving all stakeholders that influence the organization.
Shareholders are often considered the only stakeholders that invest in a business. Senior management needs to be cognizant of the importance of shareholders as well other stakeholders who create value for the organization. They should work on building a collaborative Organizational Culture and paying heed to the welfare of all those groups that play a role in organizational growth.
This warrants a thorough evaluation of all stakeholders, their long-term interests, and Value Creation — or Value Destruction — potential for the organization. But first, this calls for finding answers to the following key questions:
Who creates the most value for the organization?
Who among the stakeholders typically secure the best deals from the organization?
Who is the victim of having the worst deals from the organization?
Who among the stakeholders is potentially untrustworthy?
Are there any intermediaries or stakeholders fulfilling their personal agendas?
Answering these questions is critical for the executives, otherwise they may risk falling into Shareholder Value Traps. Recognizing and understanding stakeholder value traps while the managing stakeholders’ various interests helps executives achieve shared and individual long-term goals. These 5 common traps prevent stakeholders’ interests to get integrated with the interests of the organization and destroy the value of a company if overlooked:
Ignoring cash-flow driving stakeholders while distributing cash
Miscalculating reaction from stakeholders
Supporting under-performing units
Conceding to willful vulture capitalists
Misjudging intermediaries role in transactions
Got a question about this presentation? Email us at support@flevy.com.
[Whitepaper] Shareholder Value Traps: How to Evade Them and Focus on Value Cr...
[Whitepaper] Shareholder Value Traps: How to Evade Them and Focus on Value Cr...Flevy.com Best Practices
Plus de Flevy.com Best Practices (20)
[Whitepaper] 5 Dimensions of Employee Engagement Scorecard
[Whitepaper] 5 Dimensions of Employee Engagement Scorecard
[Whitepaper] Digital Transformation: Workforce Digitization
[Whitepaper] Digital Transformation: Workforce Digitization
[Whitepaper] Strategic Human Resources: Evolution of Competition
[Whitepaper] Strategic Human Resources: Evolution of Competition
[Whitepaper] 8 Key Steps of Data Integration: Restructuring Redeployment Asse...
[Whitepaper] 8 Key Steps of Data Integration: Restructuring Redeployment Asse...
[Whitepaper] Strategy Classics: Value Disciplines Model
[Whitepaper] Strategy Classics: Value Disciplines Model
[Whitepaper] The Definitive Guide to Strategic Planning: Here’s What You Need...
[Whitepaper] The Definitive Guide to Strategic Planning: Here’s What You Need...
[Whitepaper] The Definitive Introduction to Strategy Development and Strategy...
[Whitepaper] The Definitive Introduction to Strategy Development and Strategy...
[Whitepaper] The “Theory of Constraints:” What’s Limiting Your Organization?
[Whitepaper] The “Theory of Constraints:” What’s Limiting Your Organization?
[Whitepaper] Transportation Cost Reduction in Supply Chain Management
[Whitepaper] Transportation Cost Reduction in Supply Chain Management
[Whitepaper] A Great Leadership Experience: Dr. Rachid Yazami, Inventor of th...
[Whitepaper] A Great Leadership Experience: Dr. Rachid Yazami, Inventor of th...
[Whitepaper] Finding It Hard to Manage Conflict at the Workplace? Use the Tho...
[Whitepaper] Finding It Hard to Manage Conflict at the Workplace? Use the Tho...
[Whitepaper] Key Account Management: Handling Large Global Accounts the Right...
[Whitepaper] Key Account Management: Handling Large Global Accounts the Right...
[Whitepaper] Nudge Theory: An Effective Way to Transform Negative Behaviors
[Whitepaper] Nudge Theory: An Effective Way to Transform Negative Behaviors
[Whitepaper] Business Model Innovation: Creation of Scalable Business Models ...
[Whitepaper] Business Model Innovation: Creation of Scalable Business Models ...
[Whitepaper] Shareholder Value Traps: How to Evade Them and Focus on Value Cr...
[Whitepaper] Shareholder Value Traps: How to Evade Them and Focus on Value Cr...
Dernier
Dernier (20)
Buy Verified TransferWise Accounts From Seosmmearth
Buy Verified TransferWise Accounts From Seosmmearth
Falcon Invoice Discounting: Tailored Financial Wings
Falcon Invoice Discounting: Tailored Financial Wings
Mifepristone Available in Muscat +918761049707^^ €€ Buy Abortion Pills in Oman
Mifepristone Available in Muscat +918761049707^^ €€ Buy Abortion Pills in Oman
Power point presentation on enterprise performance management
Power point presentation on enterprise performance management
Quick Doctor In Kuwait +2773`7758`557 Kuwait Doha Qatar Dubai Abu Dhabi Sharj...
Quick Doctor In Kuwait +2773`7758`557 Kuwait Doha Qatar Dubai Abu Dhabi Sharj...
TVB_The Vietnam Believer Newsletter_May 6th, 2024_ENVol. 006.pdf
TVB_The Vietnam Believer Newsletter_May 6th, 2024_ENVol. 006.pdf
Falcon's Invoice Discounting: Your Path to Prosperity
Falcon's Invoice Discounting: Your Path to Prosperity
Falcon Invoice Discounting: Aviate Your Cash Flow Challenges
Falcon Invoice Discounting: Aviate Your Cash Flow Challenges
Uneak White's Personal Brand Exploration Presentation
Uneak White's Personal Brand Exploration Presentation
Paradip CALL GIRL❤7091819311❤CALL GIRLS IN ESCORT SERVICE WE ARE PROVIDING
Paradip CALL GIRL❤7091819311❤CALL GIRLS IN ESCORT SERVICE WE ARE PROVIDING
Over the Top (OTT) Market Size & Growth Outlook 2024-2030
Over the Top (OTT) Market Size & Growth Outlook 2024-2030
Jual Obat Aborsi ( Asli No.1 ) 085657271886 Obat Penggugur Kandungan Cytotec
Jual Obat Aborsi ( Asli No.1 ) 085657271886 Obat Penggugur Kandungan Cytotec
How to Get Started in Social Media for Art League City
How to Get Started in Social Media for Art League City
PEST Analysis
- 1. Business Framework PEST Analysis PEST (Political, Economic, Social, and Technological) analysis is a framework evaluating macro-environmental factors used in the environmental scanning component of strategic management. The PEST analysis framework has become increasingly popular and relevant as the first decade of the 21st century have given rise to green business and environmental concerns from the public. Government and Regulatory Intervention Technological and Social Change Macroeconomic Influences Bargaining Power of Customers Direct Rivalry Among Competitors Threat of Potential Entrants Bargaining Power of Suppliers Threat of Substitutes Find our other documents at http://flevy.com/seller/learnppt
- 2. 3 PEST analysis—introduction Why We Use It • Complement other industry analysis frameworks. • Explain ongoing changes in the industry. Strengths & Limitations Benefits: • Provides a framework for conducting a scan of the macro-environment in the initial stages of strategic planning and analysis engagements • Contributes to the identification of value drivers and critical success factors in an industry • Provides valuable input to game theory analyses or other strategy development efforts • Can be conducted at varying levels of detail • Supports scenario-based strategic planning efforts Limitations: • Qualitative and subjective nature of the results can lead to vague, incomplete or inaccurate plans • Requires considerable data collection and trend verification efforts that can be time-consuming Further Details
- 3. 5 The approach to complete Environmental Trend Analysis* has 3 key components * Environmental Trend Analysis is an iterative process. Data collection leads to research, which raises additional questions and leads to additional research. This process continues until the analyst is confident the major macro-environmental trends have been identified. Data Collection Industry Trend Analysis Trend Quantification 1 2 3 • Conduct both primary and secondary research • Understand and evaluate the industry structure • Analyze the competitive environment • Analyze data from clients and competitors (e.g. sales, growth) • Determine trends in data Approach to Environmental Trend Analysis
- 4. 7 During Data Collection, the potential economic influences in the market must be identified Potential Economic Influences The trends specific to markets under analysis should be identified, including: Size and growth rate of the market Cyclicality Seasonality Segmentation Product differentiation Price sensitivity Data Collection (2 of 2) Data Collection Industry Trend Analysis Trend Quantification 1 2 3 Customer needs Availability of substitutes Potential entrants Barriers to entry and exit Supplier relationships Industry profitability
- 5. 9 If possible, the identified trends should be quantified – Plot the ―raw‖ data over time to identify seasonal or cyclical trends – Use visual inspections and regression analyses to observe relationships – Calculate annual growth rate and plot over time – There are two options for calculating historical growth rate 1. Traditional approach 2. Theoretically correct approach • The theoretically correct approach overcomes the inherent ―positive skew‖ that results from the traditional approach* Given client considerations, the traditional approach is recommended Trends should be quantified where possible for easier comparison and ongoing tracking * The traditional approach indicates that the percentage change from 5 to 10 is greater than the percentage change from 10 to 5, although the absolute change is the same 5 units. The theoretically correct approach indicates the percentage change is 100 % in both cases. % C h a n g e V a lu e V a lu e V a lu e t t t t 1 1 % lnC h a n g e V a lu e V a lu e t t t 1 1 Data Collection Industry Trend Analysis Trend Quantification 1 2 3Trend Quantification (1 of 2)
- 6. 11 PEST analysis – top tips Potential Insights • Reveals key trends and issues in the industry, e.g.: – Emerging/declining constraints. – New rules of the game. Hints and Pitfalls • Do: – Focus on the most significant aspect if you do not intend to deliver a thorough industry analysis. • Don’t: – Lose sight of factors that truly influence your clients’ business Data Sources • Analysts’ reports • Industry reports • Database searches • Industry experts Related Analytics • Porter’s five forces • Value chain analysis
- 7. 1 Flevy (www.flevy.com) is the marketplace for premium documents. These documents can range from Business Frameworks to Financial Models to PowerPoint Templates. Flevy was founded under the principle that companies waste a lot of time and money recreating the same foundational business documents. Our vision is for Flevy to become a comprehensive knowledge base of business documents. All organizations, from startups to large enterprises, can use Flevy— whether it's to jumpstart projects, to find reference or comparison materials, or just to learn. Contact Us Please contact us with any questions you may have about our company. • General Inquiries support@flevy.com • Media/PR press@flevy.com • Billing billing@flevy.com