

Recommandé
Recommandé
Contenu connexe
Tendances
Tendances (17)
En vedette
En vedette (8)
Similaire à 2012 10-12 video eis.ha.v2
Similaire à 2012 10-12 video eis.ha.v2 (20)
Dernier
Dernier (20)
2012 10-12 video eis.ha.v2
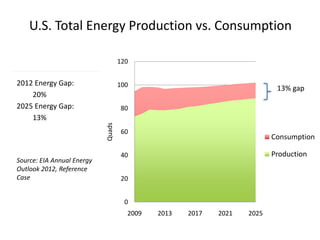
- 1. U.S. Total Energy Production vs. Consumption 120 2012 Energy Gap: 100 13% gap 20% 2025 Energy Gap: 80 13% Quads 60 Consumption 40 Production Source: EIA Annual Energy Outlook 2012, Reference Case 20 0 2009 2013 2017 2021 2025
- 2. U.S. Liquid Fuel Production vs. Consumption 25 2006 Fuel Gap: 20 60% 2025 Fuel Gap: 15 37% gap 37% Bb/d 10 Source: EIA Annual Energy Outlook 2012, Reference Consumption Case 5 Production 0 1970 1975 1980 1985 1990 1995 2000 2005 2010 2015 2020 2025
- 3. U.S. Crude Oil Imports by Country/Region 10 9 8 7 Other Quadrillion Btu 6 Persian Gulf (OPEC) West Africa (OPEC) 5 North Africa (OPEC) 4 Latin America (OPEC) North Sea 3 Mexico 2 Canada 1 0 2009 2011 2013 2015 2017 2019 2021 2023 2025 Source: EIA Annual Energy Outlook 2012, Reference Case
- 4. 2025 Energy Demand by Fuel Type 100 10.04 quads is just 9.86% of total energy demand in 2025 80 Quadrillion Btu 60 Petroleum 40 Natural Gas Coal 20 Uranium Renewables 0 Biofuels Source: EIA Annual Energy Outlook 2012, Reference Case
- 5. 2025 Scenario: Imported Crude Oil Displaced Total Crude Oil (quads) Displaced Distillate fuel oil Freight LNG (32% penetration) 2.18 Gasoline Light duty CNG (22% penetration) 3.91 Gasoline EVs (10% penetration) 1.75 Various crude Canadian tight oil & gas (est. surplus) 4.86 products Total crude oil displaced 12.69 Total crude oil imported 10.04 Total percentage of crude oil imports displaced 126%
Notes de l'éditeur
- Cause of Reduction in Gap1 bb/d increase in domestic crude production by 20201 mb/d increase in biofuel production by 2020Limited transportation growth in next decadeIncrease in domestic natural gas production
- Take away: Crude oil imports will further rely on Canadian imports