The Rundown Recap
•
2 j'aime•346 vues

The document provides analytics on social media engagement for an event, including over 1400 tweets mentioning the event, 125 unique visits to a web app about it, and over 1000 check-ins on Foursquare at the location. Metrics are given on Twitter usage during presentations, how organizations were discussed, and the most shared photos and tweets from the event. The recap analyzes social media participation and conversations around the event on various platforms.

Recommandé
Contenu connexe
En vedette
En vedette (20)
Dernier
Dernier (20)
The Rundown Recap
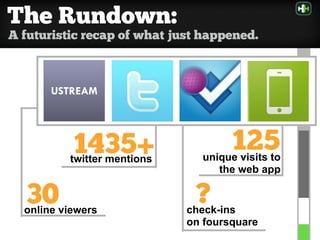
- 1. The Rundown: A futuristic recap of what just happened. USTREAM 1435+ twitter mentions 125 unique visits to the web app 30 online viewers ? check-ins on foursquare
- 2. Webapp by numbers Have we killed your battery yet? 73% of attendees visited the app 4:46 avg time spent
- 3. Tweet by numbers How did your thumbs do? 1435+ total tweets twitpics 10
- 4. TwitPic: The most viewed Twitpic of the evening. 5,914 followers @JoselinMane total views 136
- 5. Twitter: Average number of Twitter followers = 126 Most retweeted tweet of the night followers 6,123 estimated additional impressions 1200+
- 6. Twitter: Total volume during the event (#smcboston). 500 417 333 250 167 83 5:30 6:00 7:00 7:30
- 7. Twitter: A snapshot of our conversation
- 8. Twitter: Total volume during the presentations. Todd Mike Zach Ilya John Paul 300 250 200 150 100 50 6:30 6:35 6:40 6:45 6:50 6:55 7:00 7:05 7:10 7:15 7:20 7:25 7:30
- 9. Twitter: Total volume for related organizations. 5:30 6:00 6:30 7:00 FutureM Hill Holliday MITX SMC Boston
- 10. Twitter: tweets related to this event. Percentage of FutureM #geoM #futureM #smcBoston 0.48 pixels = 1 tweet. Most conversations about individual events did not reference FutureM.
- 11. Foursquare recap: Let’s check in, shall we? :-( unique people as of 12:30=158 total check-ins=1190 check ins check-ins first-time ??%
- 12. Foursquare: Did we get the swarm badge? nope
- 13. Foursquare: Other badges awarded tonight ? ? http://www. 4squarebadges.com ? ?
- 14. Foursquare: Who’s gonna win? special here! ?