Contenu connexe
Similaire à 20320140504006
Similaire à 20320140504006 (20)
Plus de IAEME Publication
Plus de IAEME Publication (20)
20320140504006
- 1. International Journal of Civil Engineering and Technology (IJCIET), ISSN 0976 – 6308 (Print),
ISSN 0976 – 6316(Online), Volume 5, Issue 4, April (2014), pp. 57-70 © IAEME
57
STATISTICAL ANALYSIS OF GROUNDWATER QUALITY PARAMETERS
IN SELECTED SITES AT NINAVAH GOVERNORATE/ IRAQ
Abdulmuhsin S. Shihab1
, Waleed M.Sh. Al-Abidrabah2
, Ahmad Kh. Ibrahim3
1
Environment & Pollution, Control Researches Centre/ Mosul Univ., Iraq
2, 3
Department. of Environmental Engineering, Tikrit University, Iraq
ABSTRACT
Groundwater is considered one of the important water resources in the world . Due to rain
shortage and the decrease of Tigris river discharges in the last years, wells excavation and
groundwater use for different purposes had been increased without any planning. Therefore, it is
necessary to conduct the studies about groundwater quality in Ninavah governorate and define its
suitability uses. Additionally, it is very useful to define the direction of groundwater quality
improvement in the area and to identify the levels of some trace elements in it. Twenty seven deep
wells recently excavated were selected in the study area located south east Mosul city with an area of
about 1500km2
. These wells were located in rural and urban areas of various activities: agricultural,
industrial and residential. Water sample were collected each two months starting at December 2008
till June 2009. Physical tests were conducted including total dissolved solid, electrical conductivity
and turbidity, as well chemical tests, which include pH, dissolved oxygen, total hardness, positive
ions: calcium, magnesium, sodium, potassium, and negative ions: sulfates, nitrates, phosphate,
chlorides, in addition to some of trace elements: lead, cadmium, zinc and copper using standard
methods for water examination. Water quality data were statistically analyzed and the results of
Pearson correlation coefficient showed many significant relationships between water quality
parameters. Factor analysis extracted five factors which represented 69% of the variation in
groundwater quality among the wells of the study area. Cluster analysis classified the wells into four
clusters at 50% similarity.
Keywords: Groundwater, Water Quality, Ninavah Governorate, Factor Analysis.
INTERNATIONAL JOURNAL OF CIVIL ENGINEERING
AND TECHNOLOGY (IJCIET)
ISSN 0976 – 6308 (Print)
ISSN 0976 – 6316(Online)
Volume 5, Issue 4, April (2014), pp. 57-70
© IAEME: www.iaeme.com/ijciet.asp
Journal Impact Factor (2014): 7.9290 (Calculated by GISI)
www.jifactor.com
IJCIET
©IAEME
- 2. International Journal of Civil Engineering and Technology (IJCIET), ISSN 0976 – 6308 (Print),
ISSN 0976 – 6316(Online), Volume 5, Issue 4, April (2014), pp. 57-70 © IAEME
58
INTRODUCTION
Groundwater resources in Iraq gets its importance as most of the sources of surface water
come from outside Iraqi border. Therefore, studies must be done on the quality and distribution of
this resource to determine its suitability for use and to protect it from pollution. The classification of
wells according to its water quality to establish its suitable use can provide useful information to
employers. Groundwater wells have different water quality, as many parameters contribute in
determining its water quality type (Appelo and Postma, 1993). The quality of groundwater is not
determined by the nature of the site only, since it may affected by human activities with pollutants
which reach it and the variation in the hydrological cycle (Helena et al., 2000). The ground water
quality data need complicated analysis to interpreted it.
Generally, the analysis of water quality results were conducted on each parameter alone to
avoid the interactions, complication and for its simplicity (Lloyd, 1978). On the other hand, the use
of multivariate analysis of water quality parameters all together may produce a comprehensive image
on the groundwater quality of the studied area with all the interrelationships or correlations (Jackson,
1991; Meglen, 1992).
Multivariate methods has high efficiency in the analysis as it compact the raw data and give
useful information for detecting the geochemical sources affecting on groundwater quality. Also this
method may help in detecting the natural relationships among the quality parameters (Wenning and
Erickson, 1994). Multivariate analysis of environmental issues was used successfully in the
interpretation of the relationships among the variables which can be used in the management of the
environmental systems (Andrade et al., 1992; Aruga et al., 1995; Vega et al., 1998; Tao, 1998;
Gangopadhyay et al., 2001; Liu et al., 2003).
Many studies were conducted in Mosul city on water quality using multivariate analysis.
Shihab (1993) conducted multivariate analysis on Mosul dam lake water quality data to set a
sampling program for the lake. Al-Rawi and Shihab (2005) used multivariate analysis as a tool for
the management of Tigris river water quality within Mosul city. Shihab and Hashim (2006) used
cluster analysis to classify 66 wells in Ninavah governorate/ Iraq according to their water quality.
Shihab (2007) conducted factor analysis on Tigris river water quality parameters to find the
relationships among them and their variations. Additionally, Shihab and Abdul-Baqi (2011) analyzed
the groundwater quality parameters of Makhmor area/ Northern Iraq using factor and cluster
analysis, also they draw a classification map for groundwater quality of the area depending on the
results of cluster analysis.
MATERIALS AND METHODS
Study site
The study area rests in Ninavah Governorate, Northern Iraq with an area of 1500 squared
kilometers. It included the South Western part of Mosul city within the residential area to the North
direction and the area lied between Tigris river from the east and Mosul-Baghdad road from the
west, till Al-Qayara intersection in the South, which included many valleys, hills and agricultural
area. The study area also included the zone lied to the west of Tigris river till Al-Hamdaniya
township; the upper Zab in the south and Mosul-Erbil road to the north as shown in Figs (1and 2).
The studied wells were selected to cover the study area within different land use and have not been
studied before. The number of studied wells reach 27 deep wells with a range of (27-95) meter depth.
Also some of them were newly drilled (table 1).
- 3. International Journal of Civil Engineering and Technology (IJCIET), ISSN 0976 – 6308 (Print),
ISSN 0976 – 6316(Online), Volume 5, Issue 4, April (2014), pp. 57-70 © IAEME
59
Table (1): Sites and depths of the studied wells
No. Site Depth (m) No. Site Depth (m)
1 Upper Bjwania 30 15 Al-Arej/ Abid 66
2 Al-Shak 30 16 Al-Wahid Ahad M. 75
3 Lower Bjwania 35 17 Al-Akhawain M. 45
4 Snanek 32 18 Al-Mulawatha 80
5 Ain Naser 36 19 Al-Mahmod M. 46
6 Tal Teeba 58 20 Abo-Auob M. 63
7 Al-Athba Mosque 50 21 Safi M. 84
8 Al-Athba Younis 40 22 Talha M. 65
9 Al-Athba Abid 51 23 Al-Muo'min M. 45
10 Al-Jbori Station 86 24 Al-Tawajna 75
11 Al-Sajer Station 80 25 Al-Msherfa 27
12 Al-Salam/ Kamel 95 26 Al-Adla 66
13 Al-Salam/ Jasim 80 27 Ibrahim Al-Khalel 50
14 Al-Arej/ Dawood 39
- 4. International Journal of Civil Engineering and Technology (IJCIET), ISSN 0976 – 6308 (Print),
ISSN 0976 – 6316(Online), Volume 5, Issue 4, April (2014), pp. 57-70 © IAEME
60
Figure 1: Map of the studied wells area (Mosul area bounded with was enlarged in the figure 2)
N
Tigris River
Al-Qasab Valley
Mosul-BaghdadRoad
Kilometer
Dohuk
Syria
Tigris River
Study area
Ninavah Erbil
Governorate
Al-Hamdania
Al-Tawajna
Al-Jbori Station
Al-Sajer Station
Al-Salam/ Kamel
Al-Salam/ Jasim
Al-Athba Younis
Al-Athba Abid
Al-Athba M.
Snanek
Ain Naser
Hamam Al-Aleel
Al-Salamyia
Al-Msherfa
Al-Adla
Al-Arej/ Dawood
Al-Arej/ Abid
Al-Shura
Al-Shak
Tal Teeba
Upper Bjwania
Lower Bjwania
Legend
Governorate center
Villages
Rivers
Roads
Well
0 3 6 9 12 15
Al-Qayara
Mosul city
Upper Zab river
Al-Molawatha
Ibrahim Al-Khalel
- 5. International Journal of Civil Engineering and Technology (IJCIET), ISSN 0976 – 6308 (Print),
ISSN 0976 – 6316(Online), Volume 5, Issue 4, April (2014), pp. 57-70 © IAEME
61
Figure 2: The part of Mosul city included in the study area with the sites of the wells
Geology of the Study Area
The structural layers of the study area consists from Al-Fatha formation for the wells Nos.
1-15 which include red and green Marl rocks with layers of thick gypsum and calcareous rocks as
sedimentological cycles of lakes and delta. The geological layers of the wells Nos. 16-23 from the
sequence of the upper part of Al-Fatha formation. On the other hand, the rocks of the wells No. 26
and 27 belongs to Injana formation with sequence of sandy rocks and clayey rocks layers. The wells
B13 and B14 lied on terraces of the upper Zab river which consisted of thick layers of gravel
sequenced by layers of coarse sand and clay (Al-Naqib and Aghwan, 1993).
Samples Collection
The samples were collected for the period Dec 2008 till Jul 2009 each two months. The pump
were put on for 10 minutes then the sample was collected in plastic bottles of 2.25 liters. The
samples were then transported to the laboratory and stored at 4 o
C and then tested.
Methods of Analysis
The physical tests, which include total dissolved solids and electrical conductivity, and the
chemical tests, which include pH, total hardness, calcium, magnesium, sodium, potassium sulfate,
nitrate, and chloride, were conducted according to the standard methods (APHA, AWWA and WEF,
1986). Selected heavy metals including lead, cadmium, zinc and silver were tested by atomic
absorption device type VARIAN.
The results were statically analyzed using simple Pearson correlation to find the relationships
between the parameters. Factor analysis was then used to explain the outline of groundwater quality
variation according to the measured parameters. Statistical analysis was also used to classify the
N
Kilometers
Legend
Residential avenue
Boarders
Wells
Al-Mumin
Mosque
Abu Ayoub
Mosque
Safi Al-Rahman
Mosque Talha
Mosque
Al-Akhawain
Mosque
Al-Mahmoud
Mosque
Al-Wahid Al-
Ahad Mosque
Mosul Al-Jadeda
Avenue
Al-Shuhadaa
Avenue
Tal Al-Ruman
Avenue
0 1 2 3 4 5
- 6. International Journal of Civil Engineering and Technology (IJCIET), ISSN 0976 – 6308 (Print),
ISSN 0976 – 6316(Online), Volume 5, Issue 4, April (2014), pp. 57-70 © IAEME
62
studied wells according to their water quality using complete linkage cluster analysis depending on
similarity index. The statistical results were considered significant and p<0.05.
RESULTS AND DISCUSSION
Table (2) shows the bivariate relationships between ground water quality parameters in the
study area. pH shows significant inverse correlation with each of total dissolved solids, total
hardness, calcium ions, lead and copper. On the other hand, total dissolved solids shows direct
significant correlation with the measured trace elements except copper. Additionally, nitrates
correlation with measured trace elements did not reach the significance level. While sulfate showed
significant positive relationship with cadmium and Zinc. Also, alkalinity correlated significantly with
trace elements except copper directly. Lead showed positive significant relationship with cadmium,
while the later showed inverse significant correlation with copper. Furthermore, electrical
conductivity showed significant direct correlation with lead and cadmium.
Factor analysis extracted five factors from the measured water quality parameters to represent
water quality variation in the study area (table 3). The analysis was conducted using the rotation
technique depending on eigen values of 1 or more (Davis, 1973). The extracted five factors
represented 69% of the variation in ground water quality withhin the studied area. The correlation of
the parameters with the factors is considered significant when it exceeded the radius of the balance
circle which is equal to 0.559 calculated from the square root of the division of number of factors by
the number of parameters (Al-Rawi and Shihab, 2005). The first factor represents the land use of the
studied area with a percentage of 16.84% from the total variance. This factor shows significant
correlation with sodium, chloride and nitrate ions (table 3).
Table (2): Correlation matrix for water quality parameters of the studied wells
Par pH EC TDS TUR TH PO4 DO NO3 SO4 ALK Cl Na K Ca Mg Pb Cd Zn Cu
pH 1 -0.02 -0.22* -0.06 -0.31** 0.14 -0.06 0.21* -0.14 -0.13 0.2* 0.23* -0.15 -0.39** -0.1 -0.2* -0.14 -0.06 -0.26**
EC 1 0.94** 0.38** 0.59** 0 0.24** 0.14 0.51** 0.17 0.85** 0.82** 0.38** 0.29** 0.55** 0.4** 0.48** 0.16 -0.12
TDS 1 0.4** 0.68** -0.06 0.26** 0.1 0.58** 0.21* 0.72** 0.73** 0.36** 0.41** 0.57** 0.42** 0.54** 0.2* -0.02
TUR 1 0.22* 0.14 0.19* -0.02 0.27** 0.38** 0.23* 0.39** 0.06 0.11 0.21* 0.24** 0.33** 0.43** -0.19*
TH 1 0.23* 0.38** -0.17 0.71** 0.29** 0.25** 0.27** 0.34** 0.74** 0.74** 0.27** 0.53** 0.1 -0.04
PO4 1 0.09 -0.15 0.3** 0.21* -0.11 -0.06 -0.03 0.12 0.22* -0.02 -0.04 0.18* -0.28**
DO 1 0.05 0.51** 0.16 0.14 0.25** 0.16 0.36** 0.25** 0.07 0.41** 0.19* 0.06
NO3 1 -0.1 -0.27** 0.15 0.24** -0.41** -0.27** -0.08 -0.04 -0.11 -0.15 -0.09
SO4 1 0.05 0.22* 0.39** 0.2* 0.61** 0.49** 0.14 0.44** 0.33** -0.02
ALK 1 -0.01 0.02 0.18 0.24** 0.21* 0.25** 0.27** 0.4** -0.1
Cl 1 0.79** 0.43** 0.02 0.32** 0.25** 0.21* -0.01 0.02
Na 1 0.2* -0.01 0.34** 0.38** 0.41** 0.15 -0.23*
K 1 0.31** 0.27** 0.15 0.29** -0.05 0
Ca 1 0.23* 0.23* 0.35** 0.17 0.05
Mg 1 0.24** 0.49** -0.01 -0.12
Pb 1 0.47** 0.06 -0.27**
Cd 1 0.29** -0.38**
Zn 1 0.01
Cu 1
* Significant at p<0.05
** Significant at p<0.001
- 7. International Journal of Civil Engineering and Technology (IJCIET), ISSN 0976 – 6308 (Print),
ISSN 0976 – 6316(Online), Volume 5, Issue 4, April (2014), pp. 57-70 © IAEME
63
Table (3): The rotated weights of ground water quality parameters according to factor analysis
Factor 2 denoted 15.21% of the total variance in ground water quality within the study area.
Alkalinity, turbidity and zinc was loaded on it significantly (Fig. 3). The figure also shows direct
strong correlation between zinc ion and alkalinity as found in the correlation matrix (table 1). The
figure exhibits weak correlation between zinc, lead and cadmium from one side versus nitrate and
chloride from the other side according to the angle between the parameters vectors which is weak
when it is about 90 degrees, strong when it is small and inverse when reach 180 degrees and
around it.
Factors
Parameters
54321
0.1160.1070.1860.2080.871Na
-0.050.1960.151-0.0610.844Cl
-0.04-0.504-0.044-0.1350.600NO3
0.0160.1650.0680.737-0.272Alkalinity
0.11-0.0540.1770.7260.200Turbidity
0.091-0.2250.4070.661-0.076Zn
-0.1670.328-0.1510.5500.404Pb
0.0170.4780.2240.5270.395Cd
0.1510.2620.8320.1440.190SO4
-0.0250.0410.6880.1270.195DO
-0.2150.4310.6250.191-0.178Ca
-0.0890.7940.157-0.1020.075K
0.2350.5470.2990.1510.293Mg
0.7530.0310.2850.135-0.283PO4
0.641-0.35-0.158-0.2380.294pH
-0.615-0.3190.326-0.318-0.249Cu
1.5532.1312.2172.4342.695Eigen value
9.70513.32113.85615.21216.845%Variance
68.93859.23345. 91332.05716.845%Cumulati
ve
- 8. International Journal of Civil Engineering and Technology (IJCIET), ISSN 0976 – 6308 (Print),
ISSN 0976 – 6316(Online), Volume 5, Issue 4, April (2014), pp. 57-70 © IAEME
64
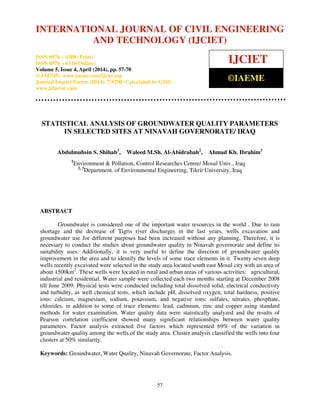
Fig. 3: The weights of factor 1 parameters versus factor 2 parameters
Factor 4 represents the geology of the studied area with 13.85% of the total variance in
ground water quality (table 3). Sulfates, dissolved oxygen and calcium was loaded significantly on it.
Weak correlation was observed between calcium and each of sodium and chloride, while the exhibit
strong direct correlation between them. Sulfate also shows weak correlation with nitrate.
Fig. 4: The weights of factor 1 parameters versus factor 3 parameters
Factor 4 represented 13.32% of the total variance in ground water quality of the studied area
(table 3). It characterized potassium ion variation significantly. When it is drawn versus factor 1 (Fig.
5), the relationships obtained: weak correlation between potassium versus sodium and chloride;
-1
-0.75
-0.5
-0.25
0
0.25
0.5
0.75
1
-1 -0.75 -0.5 -0.25 0 0.25 0.5 0.75 1
Factor 1
Factor 2
Zn
Turb
Pb
PO4 DOSO4
Cd
K
Cl
Cu
Mg
NO3
Ca
pH
ALKA
Na
-1
-0.75
-0.5
-0.25
0
0.25
0.5
0.75
1
-1 -0.75 -0.5 -0.25 0 0.25 0.5 0.75 1
Factor 1
Factor 3
Mg
Na
Zn
K
SO4
NO3
Cd
DO
Ca
Pb
Turb
Cu
pH
Cl
AlkA
PO4
- 9. International Journal of Civil Engineering and Technology (IJCIET), ISSN 0976 – 6308 (Print),
ISSN 0976 – 6316(Online), Volume 5, Issue 4, April (2014), pp. 57-70 © IAEME
65
strong and inverse between copper versus lead and cadmium and weak correlation between nitrate
versus cadmium, lead and magnesium.
Factor 5 represented the lowest percentage of variation in ground water quality with 9.7%,
which is 60% of Factor 1 variance (table 3). Phosphate and pH was loaded significantly on it, which
correlated strongly with each other (Fig. 6). The figure also denotes inverse strong correlation
between pH and copper, as pH decrease, the ability of the solution to dissolve increase (Zubair et al.,
2008).
In contrast, the parameters which did not loaded on any factor were lead, cadmium,
magnesium and copper, since the feeding sources of the ground water did not exhibit noticeable
variation in these parameters.
Fig. 5: The weights of factor 1 parameters versus factor 4 parameters
Fig. 6: The weights of factor 1 parameters versus factor 5 parameters
-1
-0.75
-0.5
-0.25
0
0.25
0.5
0.75
1
-1 -0.75 -0.5 -0.25 0 0.25 0.5 0.75 1
[Factor 1
Factor 4
Cl
Mg
Cd
AlKA
PO4
SO4
Na
Ca
K
Pb
NO3
pH
Turb
Cu
Zn
DO
-1
-0.75
-0.5
-0.25
0
0.25
0.5
0.75
1
-1 -0.75 -0.5 -0.25 0 0.25 0.5 0.75 1
Factor 1
Factor 5
AlkA
Ca
PO4
Cd
Cl
SO4
Mg
pH
Turb
Pb
DO NO3
Cu
Na
K
Zn
- 10. International Journal of Civil Engineering and Technology (IJCIET), ISSN 0976 – 6308 (Print),
ISSN 0976 – 6316(Online), Volume 5, Issue 4, April (2014), pp. 57-70 © IAEME
66
Classification of the Wells
The complete linkage cluster analysis extracts five cluster depending on similarity index of
50% between ground water quality among the wells (Fig. 7). The first cluster included lower
Bjwania and Tal Teba wells which represents 7.4% of the studied wells. The water quality of this
cluster had the highest electrical conductivity, salt, dissolved oxygen, total hardness, magnesium,
sodium, sulfate, nitrate and lead concentrations among the studied wells. The second cluster included
upper Bjwania and Al-Shak wells which represents 7.4% of the studied wells. These two wells
exhibited the water quality of highest calcium, phosphate, cadmium, zinc and turbidity. Additionally,
lower pH was recorded in this cluster in comparison with the other clusters (tables 4, 5 and 6).
Fig. 7: Complete linkage Hierarchical cluster analysis dendrogram of water quality parameters of the
studied wells (No. of wells as in table 1)
Cluster 4 contained Al-Adla and Ibrahim Al-Khaleel wells with 7.4% of the studied wells.
These wells lies on the left side of Tigris river and had the highest alkalinity among the studied
wells. Cluster 3 included the remaining 21 wells with 77.78%. The water quality of the wells of this
cluster showed the lowest concentrations of sodium, while the concentrations of the other parameters
were near the mean values.
- 11. International Journal of Civil Engineering and Technology (IJCIET), ISSN 0976 – 6308 (Print),
ISSN 0976 – 6316(Online), Volume 5, Issue 4, April (2014), pp. 57-70 © IAEME
67
Table (4): The characteristics of the ground water quality of the groups of wells extracted from
cluster analysis
Parameters Cluster
No.
No. of
wells Mean SD Min. Max.
Electrical 1 2 9684 1862 8367 11001
Conductivity 3 2 6174 1676 4989 7359
µmos/cm 4 21 4205 473 3122 5189
5 2 1710 755 1175 2244
1 2 6528.8 1085.8 5761 7296.5
TDS (mg/l) 3 2 4529 605 4101 4957
4 21 3167.3 353.1 2175.5 3931.5
5 2 933.3 430.3 629 1237.5
1 2 2.4 1.6 1.3 3.5
Turbidity 3 2 3.6 0.2 3.5 3.8
Ntu 4 21 1.2 0.7 0.3 2.7
5 2 0.8 0.7 0.4 1.3
Table (5): Trace elements concentration in the ground water quality of the groups of wells extracted
from cluster analysis
Parameters Cluster
No.
No. of
wells Mean SD Min. Max.
1 2 7.50 1.41 6.5 8.5
Lead 2 2 7.13 0.18 7.0 7.25
3 21 4.63 1.54 2.0 8.0
4 2 2.63 0.18 2.5 2.75
1 2 4.33 0.42 4.03 4.63
Cadmium 2 2 4.55 0.85 3.95 5.15
3 21 2.58 0.86 1.15 4.28
4 2 1.09 0.44 0.78 1.4
1 2 6.88 1.59 5.75 8.0
Zinc 2 2 39.13 14.32 29 49.25
3 21 8.60 4.15 2.5 19.25
4 2 5.75 2.83 3.75 7.75
1 2 26.63 3.36 24.25 29.0
Copper 2 2 22.38 2.65 20.5 24.25
3 21 30.89 3.56 24.25 36.5
4 2 25.88 3.71 23.25 28.5
This cluster can be divided into three sub-clusters at 6.5% similarity (Fig. 7). Sub-cluster 3
which included Al-Adla well showed higher mean concentration for sodium, chloride, electrical
conductivity and TDS than sub-cluster 1 and 2. On the other hand, sub-cluster 2 showed higher
alkalinity and lower sodium and chloride concentration than sub-cluster 1.
- 12. International Journal of Civil Engineering and Technology (IJCIET), ISSN 0976 – 6308 (Print),
ISSN 0976 – 6316(Online), Volume 5, Issue 4, April (2014), pp. 57-70 © IAEME
68
Table (6): The chemical characteristics of the ground water quality of the groups of wells extracted
from cluster analysis
Parameters Cluster No. No. of wells Mean SD Min. Max.
1 2 7.58 0.09 7.51 7.64
pH 2 2 7.5 0 7.5 7.5
3
21 7.53 0.15 7.32 7.86
4
2 8.14 0.13 8.05 8.23
1 2 2.93 0.53 2.55 3.3
Dissolved 2 2 2.84 0.41 2.55 3.13
Oxygen 3 21 2.59 0.36 2.1 3.43
4
2 2.05 0.14 1.95 2.15
1 2 2752.5 148.49 2647.5 2857.5
Total 2 2 2375 60.1 2332.5 2417.5
Hardness 3 21 2173.18 255.18 1350 2465
4
2 520 141.42 420 620
1 2 490.22 15.21 479.46 500.97
Calcium 2 2 513.52 10.63 506 521.04
3
21 484.79 64.07 356.56 617.14
4
2 110.27 73.79 58.09 162.44
1 2 329.87 31.74 307.42 352.31
Magnesium 2 2 244.48 21.77 229.08 259.87
3
21 209.7 42.14 97.42 275.51
4
2 84.57 40.53 55.91 113.23
1 2 1530 374.77 1265 1795
Sodium 2 2 781.88 366.81 522.5 1041.25
3
21 349.38 214.14 140 967.5
4
2 388.13 389.79 112.5 663.75
1 2 9.77 1.15 8.95 10.58
Potassium 2 2 8.25 2.26 6.65 9.85
3
21 8.63 4.15 2.8 20.3
4
2 2.63 1.27 1.73 3.53
1 2 175.13 23.51 158.5 191.75
Alkalinity 2 2 390.25 1.77 389 391.5
3
21 219.95 31.5 172.5 272.5
4
2 102.75 13.08 93.5 112
1 2 855.9 365.38 597.53 1114.26
Chlorides 2 2 212.97 229.67 50.57 375.37
3
21 142.65 107.84 47.52 437.15
4
2 124.74 99.12 54.65 194.83
1 2 12.69 0.08 12.63 12.75
Nitrate 2 2 1.9 0.97 1.21 2.58
3
21 4.1 4.1 0.02 11.79
4
2 10.83 0.96 10.15 11.51
1 2 1690.09 10.68 1682.54 1697.64
Sulfate 2 2 1534.16 96.92 1465.63 1602.69
3
21 1196.6 149.6 884.14 1449.17
4
2 361.52 21.44 346.36 376.68
1 2 0.04 0.01 0.03 0.04
Phosphate 2 2 0.09 0.03 0.07 0.11
3
21 0.05 0.02 0.03 0.12
4
2 0.04 0.03 0.02 0.06
All parameters in mg/l except pH (unitless)
- 13. International Journal of Civil Engineering and Technology (IJCIET), ISSN 0976 – 6308 (Print),
ISSN 0976 – 6316(Online), Volume 5, Issue 4, April (2014), pp. 57-70 © IAEME
69
CONCLUSIONS
1. Correlation analysis showed direct significant relationships between salts and the ions: sulfate,
chloride, sodium, potassium, calcium, magnesium, lead and cadmium. Weak non-significant
relationship recorded between nitrate and each of cadmium, lead and zinc. Alkalinity correlated
significantly with cadmium, lead and zinc,.
2. Factor analysis found that 69% of the variation in ground water quality among the studied wells
corresponded to the measured parameters. Sodium, chloride and nitrate was the earliest, while
phosphate and pH in the last.
3. The wells were classified into four water quality groups using cluster analysis.
REFERENCES
1. Al-Naqib, S. Q. and Aghwan, TH. A., (1993). Sedimentological Study of the Clastic Unit of
the Lower Fars Formation. Iraqi Geology. Journal, Vol. 26. NO. 3, pp. 126-188.
2. Al-Rawi S.M. and Shihab, M.S. Application of factor analysis as a tool for water quality
management of Tigris river within Mosul city. Raf. J. Sci. 2005; 16(1): 56-64.
3. Andrade J.M., Padra D, Muniategui S. (1992). Multivariate analysis of environmental data
for two hydrologic basins. Analytical Letter 25, 379-399.
4. APHA, AWWA, and WEF., "Standard Methods for the Examination of Water and
Wastewater",19th Edition, 1998.
5. Appelo C.A.J. and Postma D. (1998). Geochemistry, groundwater and pollution. Balkema,
Rotterdam.
6. Aruga R., Castaldi D., Negro G., Ostacoli G. (1995). Pollution of a river basin and its
evolution with time studied by multivariate statistical analysis. Analytical Chimica Acta 310,
15-25.
7. Ashley R.P. and Lloyd J.W. (1978). An example of the use of factor analysis and cluster
analysis in groundwater chemistry interpretation. J. of Hydrology 39, 441-444.
8. Davis, J.G. 1973. Statistics and data analysis in geology. John Wiley and Sons, Inc. New
York, 1973, pp. 473-524.
9. Gangopadhyay S., Gupta A.S., Nachabe M.H. (2001). Evaluation of groundwater monitoring
network by principal component analysis. Ground Water 39(2), 181-191.
10. Helena B, Pardo, B., Vega M., Barrado ., Fernandez J.M., Fernandez L. (2000). Temporal
evolution of groundwater composition in an alluvial aquifer (Pisuerga River, Spain) by
principal component analysis. Water Ressearch 32, 19-30.
11. Jackson J.E. (1991). A User's Guide of Principal Component. Wiley, New York.
12. Liu W.X., Li X.D., Shen Z.G., Wang D.C., Wai O.W.H. Li Y.S. (2003). Multivariate
statistical study of heavy metal enrichment in sediments of the Pearl River Estuary.
Environmental Pollution 121, 377-388.
13. Meglen R.R. (1992). Examining large databases: a chemometric approach using principal
component analysis. Marine Chemistry 39, 217-237.
14. Shihab A.S. (2007). Factor analysis for water quality and quantity of Tigris river at selected
sites south Mosul city. Tikrit J. Eng. Sci, Vol. 14, No. 4, pp. 35-53.
15. Shihab A.S. and Hashim A. (2006). Cluster analysis classification of groundwater quality in
wells within and around Mosul city, Iraq. J Envir Hydrology, Vol 14, paper 24.
16. Shihab, A.S. Application of multivariate methods in the interpretation of water quality
monitoring data of Mosul Dam Reservoir. Confidential, SRCD, Mosul University, 1993
17. Tao S. (1998). Factor score mapping of soil trace element contents for the Shenzhen area.
Water, Air, and Soil Pollution 102, 415-425.
- 14. International Journal of Civil Engineering and Technology (IJCIET), ISSN 0976 – 6308 (Print),
ISSN 0976 – 6316(Online), Volume 5, Issue 4, April (2014), pp. 57-70 © IAEME
70
18. Vega M., Pardo, R., Barrado E., Deban L. (1998). Assessment of seasonal and polluting
effects on the quality of river water by exploratory data analysis. Water Research 32,
3581-3592.
19. Wenning R.J. and Erickson G.A. (1994). Interpretation and analysis of complex
environmental data using chemometric methods. Trends in Analytical Chemistry 13,
446-457.
20. Zubair, A., M.A. Farooq, M.Sc., and Abbasi, H. N. M. Sc. (2008). “Toxic Trace Element
Pollution in Storm Water of Karachi: A Graphical Approach”. Pacific Journal of Science and
Technology. Vol. 9., No. 1, pp. 238-253.
21. Ahmad Hasan Nury and Syed Mustakim Ali Shah, “Breakthrough Column Studies for
Removal of Iron (II) From Groundwater using Wooden Charcoal and Sand”, International
Journal of Civil Engineering & Technology (IJCIET), Volume 4, Issue 4, 2013,
pp. 289 - 303, ISSN Print: 0976 – 6308, ISSN Online: 0976 – 6316.
22. Nadia Khelif, Imed Ben Slimène and M.Moncef Chalbaoui, “Intrinsic Vulnerability Analysis
to Nitrate Contamination: Implications from Recharge in Fate and Transport in Shallow
Groundwater (Case of Moulares-Redayef Mining Basin)”, International Journal of Civil
Engineering & Technology (IJCIET), Volume 3, Issue 2, 2012, pp. 465 - 476, ISSN Print:
0976 – 6308, ISSN Online: 0976 – 6316.
23. Neeraj D. Sharma and Dr. J. N. Patel, “Experimental Study of Groundwater Quality
Improvement by Recharging with Rainwater”, International Journal of Civil Engineering &
Technology (IJCIET), Volume 2, Issue 1, 2011, pp. 10 - 16, ISSN Print: 0976 – 6308,
ISSN Online: 0976 – 6316.
24. R. S. Sapkal and Dr. S. S. Valunjkar, “Development and Sensitivity Analysis of Water
Quality Index for Evaluation of Surface Water for Drinking Purpose”, International Journal
of Civil Engineering & Technology (IJCIET), Volume 4, Issue 4, 2013, pp. 119 - 134, ISSN
Print: 0976 – 6308, ISSN Online: 0976 – 6316.