SlideShare une entreprise Scribd logo
1  sur  11
Driver Sheet
ABC Cement Company Limited
Revenue Drivers(KES Mn) 2008 2009 2010 2011 2012E 2013E 2014E 2015E 2016E
Sales& Other, by operating segment
Cement 2,600.0 2,636.0 3,226.0 6,193.9 6,200.1 6,206.3 6,268.4 8,019.3 9,869.7
Others 500.0 750.0 800.0 1,238.8 1,433.5 1,434.9 1,449.3 1,854.1 2,281.9
Total 3,100.0 3,386.0 4,026.0 7,432.7 7,633.6 7,641.2 7,717.6 9,873.4 12,151.6
Cement
Kenya
Installed Capacity MMT
Opening balance 360.0 360.0 360.0 960.0 960.0 960.0 960.0 960.0 1,460.0
Additions/ (Closures) 0.0 0.0 600.0 0.0 0.0 0.0 0.0 500.0 0.0
Ending balance 360.0 360.0 960.0 960.0 960.0 960.0 960.0 1,460.0 1,460.0
Number ofoperational months
Existing capacity 12.0 12.0 12.0 12.0 12.0 12.0 12.0 12.0 12.0
New capacity 0.0 0.0 3.0 0.0 0.0 0.0 0.0 6.0 0.0
Utilization rate 55.3% 68.0% 88.2% 88.2% 88.2% 88.2% 88.2% 88.2% 88.2%
Production MMT 199.0 244.8 450.0 847.1 847.1 847.1 847.1 1,067.6 1,288.2
Revenues 2,600.0 2,636.0 3,226.0 6,193.9 6,200.1 6,206.3 6,268.4 8,019.3 9,869.7
Average realized price KES per ton 13,065.3 10,769.3 7,168.9 7,312.3 7,319.6 7,326.9 7,400.2 7,511.2 7,661.4
Growth rate -17.6% -33.4% 2.0% 0% 0% 1% 2% 2%
Driver Sheet (cont’d)
ABC Cement Company Limited
Revenue Drivers(KES Mn) 2008 2009 2010 2011 2012E 2013E 2014E 2015E 2016E
Other sales 500.0 750.0 800.0 1,238.8 1,433.5 1,434.9 1,449.3 1,854.1 2,281.9
As a % ofCement sales 19.2% 28.5% 24.8% 20.0% 23% 23% 23% 23% 23%
Cost ofsales (1,560.0) (1,793.0) (2,213.0) (3,716.4) (3,816.8) (3,820.6) (3,820.2) (4,837.9) (5,857.1)
As a % ofsales 50.3% 53.0% 55.0% 50.0% 50.0% 50.0% 49.5% 49.0% 48.2%
Other operating income 15.7 8.0 116.4 74.3 88.4 84.1 77.2 88.9 97.2
As a % ofsales 0.5% 0.2% 2.9% 1.0% 1.2% 1.1% 1.0% 0.9% 0.8%
Distribution costs (268.3) (278.2) (263.5) (483.1) (496.2) (473.8) (463.1) (572.7) (704.8)
As a % ofsales 8.7% 8.2% 6.5% 6.5% 6.5% 6.2% 6.0% 5.8% 5.8%
Administrative costs (431.7) (553.9) (583.3) (706.1) (702.3) (687.7) (694.6) (918.2) (1,130.1)
As a % ofsales 13.9% 16.4% 14.5% 9.5% 9.2% 9.0% 9.0% 9.3% 9.3%
Operating Expense (2,260.0) (2,625.1) (3,059.8) (4,905.6) (5,015.3) (4,982.1) (4,977.9) (6,328.8) (7,692.0)
Finance costs (263.7) (495.2) (828.3) (880.2) (1,212.7) (1,355.2) (1,526.2) (1,972.2) (2,256.8)
Average rate ofinterest 9.9% 9.5% 9.5% 9.5% 9.5% 9.5% 9.5% 9.5% 9.5%
Debt schedule
Opening balance 1,704.0 2,670.7 5,212.7 8,718.8 11,218.8 12,764.8 14,264.8 16,064.8 20,760.1
Additions 1,565.4 3,574.0 5,705.4 4,454.0 3,500.0 1,500.0 1,800.0 7,500.0 5,800.0
Repayment (598.7) (1,032.0) (2,199.3) (1,954.0) (1,954.0) 0.0 0.0 (2,804.7) (2,804.7)
Ending balance 2,670.7 5,212.7 8,718.8 11,218.8 12,764.8 14,264.8 16,064.8 20,760.1 23,755.4
Tax rate 34.1% 43.8% 37.5% 39.4% 38.5% 38.0% 38.0% 37.0% 36.0%
Driver Sheet (cont’d)
Balance Sheet Drivers(KES Mn) 2008 2009 2010 2011 2012E 2013E 2014E 2015E 2016E
Current assets:
Inventories 787.1 1,084.3 1,129.9 1,500.0 1,512.1 1,486.4 1,444.4 1,789.4 2,080.4
As a % ofCOGS 50.5% 60.5% 51.1% 40.4% 39.6% 38.9% 37.8% 37.0% 35.5%
Inventory days 184.7 220.7 186.4 147.3 145.0 142.0 138.0 135.0 130.0
Trade and other receivables 951.9 1,378.6 1,787.1 1,800.0 1,772.8 1,737.6 1,712.7 2,164.0 2,589.7
As a % ofsales 30.7% 40.7% 44.4% 24.2% 23.2% 22.7% 22.2% 21.9% 21.3%
Days receivable 112.4 148.6 162.0 88.4 85.0 83.0 81.0 80.0 78.0
Current liabilities:
Trade & other payables 785.7 1,123.8 1,231.4 1,300.0 1,303.6 1,277.0 1,256.0 1,564.0 1,856.3
As a % ofCOGS 50.4% 62.7% 55.6% 35.0% 34.2% 33.4% 32.9% 32.3% 31.7%
Days payable 184.3 228.8 203.1 127.7 125.0 122.0 120.0 118.0 116.0
Non-current assets:
Property, plant & equipment -Total
Opening balance 4,201.9 5,473.8 8,843.2 12,659.8 15,659.8 18,713.2 21,769.7 24,856.8 30,780.8
Additions 1,230.9 2,462.1 3,870.9 3,000.0 3,053.4 3,056.5 3,087.1 5,924.0 4,860.6
Transfers 0.0 0.0 0.0 0.0 0.0 0.0 0.0 0.0 0.0
Disposals (3.4) (4.3) (1.0) 0.0 0.0 0.0 0.0 0.0 0.0
Translation gains/(loss) 44.4 (64.7) (53.4) 0.0 0.0 0.0 0.0 0.0 0.0
Revaluation surplus/(deficit) 0.0 976.4 0.0 0.0 0.0 0.0 0.0 0.0 0.0
Balance at the end ofthe year 5,473.8 8,843.2 12,659.8 15,659.8 18,713.2 21,769.7 24,856.8 30,780.8 35,641.5
Depreciation
Opening balance 898.4 1,101.7 155.1 470.5 825.5 1,255.2 1,741.0 2,300.5 2,940.3
Charge for the year 201.9 221.7 315.2 355.0 429.7 485.8 559.5 639.8 763.9
Depreciation rate ( as a % ofaverage gross balance) 4.2% 3.1% 2.9% 2.5% 2.5% 2.4% 2.4% 2.3% 2.3%
Translation gain/(loss) 4.8 (0.0) 0.4 0.0 0.0 0.0 0.0 0.0 0.0
Transfers 0.0 0.0 0.0 0.0 0.0 0.0 0.0 0.0 0.0
Write back on revaluation 0.0 (1,163.9) 0.0 0.0 0.0 0.0 0.0 0.0 0.0
Driver Sheet (cont’d)
Days receivable 112.4 148.6 162.0 88.4 85.0 83.0 81.0 80.0 78.0
Current liabilities:
Trade & other payables 785.7 1,123.8 1,231.4 1,300.0 1,303.6 1,277.0 1,256.0 1,564.0 1,856.3
As a % ofCOGS 50.4% 62.7% 55.6% 35.0% 34.2% 33.4% 32.9% 32.3% 31.7%
Days payable 184.3 228.8 203.1 127.7 125.0 122.0 120.0 118.0 116.0
Non-current assets:
Property, plant & equipment -Total
Opening balance 4,201.9 5,473.8 8,843.2 12,659.8 15,659.8 18,713.2 21,769.7 24,856.8 30,780.8
Additions 1,230.9 2,462.1 3,870.9 3,000.0 3,053.4 3,056.5 3,087.1 5,924.0 4,860.6
Transfers 0.0 0.0 0.0 0.0 0.0 0.0 0.0 0.0 0.0
Disposals (3.4) (4.3) (1.0) 0.0 0.0 0.0 0.0 0.0 0.0
Translation gains/(loss) 44.4 (64.7) (53.4) 0.0 0.0 0.0 0.0 0.0 0.0
Revaluation surplus/(deficit) 0.0 976.4 0.0 0.0 0.0 0.0 0.0 0.0 0.0
Balance at the end ofthe year 5,473.8 8,843.2 12,659.8 15,659.8 18,713.2 21,769.7 24,856.8 30,780.8 35,641.5
Depreciation
Opening balance 898.4 1,101.7 155.1 470.5 825.5 1,255.2 1,741.0 2,300.5 2,940.3
Charge for the year 201.9 221.7 315.2 355.0 429.7 485.8 559.5 639.8 763.9
Depreciation rate ( as a % ofaverage gross balance) 4.2% 3.1% 2.9% 2.5% 2.5% 2.4% 2.4% 2.3% 2.3%
Translation gain/(loss) 4.8 (0.0) 0.4 0.0 0.0 0.0 0.0 0.0 0.0
Transfers 0.0 0.0 0.0 0.0 0.0 0.0 0.0 0.0 0.0
Write back on revaluation 0.0 (1,163.9) 0.0 0.0 0.0 0.0 0.0 0.0 0.0
At the end ofthe year 1,101.7 155.1 470.5 825.5 1,255.2 1,741.0 2,300.5 2,940.3 3,704.2
PPE, net 4,372.1 8,688.2 12,189.3 14,834.3 17,458.0 20,028.7 22,556.3 27,840.5 31,937.2
Balance Sheet Drivers(KES Mn) 2008 2009 2010 2011 2012E 2013E 2014E 2015E 2016E
Current assets:
Inventories 787.1 1,084.3 1,129.9 1,500.0 1,512.1 1,486.4 1,444.4 1,789.4 2,080.4
As a % ofCOGS 50.5% 60.5% 51.1% 40.4% 39.6% 38.9% 37.8% 37.0% 35.5%
Inventory days 184.7 220.7 186.4 147.3 145.0 142.0 138.0 135.0 130.0
Trade and other receivables 951.9 1,378.6 1,787.1 1,800.0 1,772.8 1,737.6 1,712.7 2,164.0 2,589.7
As a % ofsales 30.7% 40.7% 44.4% 24.2% 23.2% 22.7% 22.2% 21.9% 21.3%
Days receivable 112.4 148.6 162.0 88.4 85.0 83.0 81.0 80.0 78.0
Current liabilities:
Trade & other payables 785.7 1,123.8 1,231.4 1,300.0 1,303.6 1,277.0 1,256.0 1,564.0 1,856.3
As a % ofCOGS 50.4% 62.7% 55.6% 35.0% 34.2% 33.4% 32.9% 32.3% 31.7%
Days payable 184.3 228.8 203.1 127.7 125.0 122.0 120.0 118.0 116.0
Non-current assets:
Property, plant & equipment -Total
Opening balance 4,201.9 5,473.8 8,843.2 12,659.8 15,659.8 18,713.2 21,769.7 24,856.8 30,780.8
Additions 1,230.9 2,462.1 3,870.9 3,000.0 3,053.4 3,056.5 3,087.1 5,924.0 4,860.6
Transfers 0.0 0.0 0.0 0.0 0.0 0.0 0.0 0.0 0.0
Disposals (3.4) (4.3) (1.0) 0.0 0.0 0.0 0.0 0.0 0.0
Translation gains/(loss) 44.4 (64.7) (53.4) 0.0 0.0 0.0 0.0 0.0 0.0
Revaluation surplus/(deficit) 0.0 976.4 0.0 0.0 0.0 0.0 0.0 0.0 0.0
Balance at the end ofthe year 5,473.8 8,843.2 12,659.8 15,659.8 18,713.2 21,769.7 24,856.8 30,780.8 35,641.5
Depreciation
Opening balance 898.4 1,101.7 155.1 470.5 825.5 1,255.2 1,741.0 2,300.5 2,940.3
Charge for the year 201.9 221.7 315.2 355.0 429.7 485.8 559.5 639.8 763.9
Depreciation rate ( as a % ofaverage gross balance) 4.2% 3.1% 2.9% 2.5% 2.5% 2.4% 2.4% 2.3% 2.3%
Translation gain/(loss) 4.8 (0.0) 0.4 0.0 0.0 0.0 0.0 0.0 0.0
Transfers 0.0 0.0 0.0 0.0 0.0 0.0 0.0 0.0 0.0
Write back on revaluation 0.0 (1,163.9) 0.0 0.0 0.0 0.0 0.0 0.0 0.0
Income Statement
ABC Cement Company Limited
Income Statement (KES Mn) 2008 2009 2010 2011 2012E 2013E 2014E 2015E 2016E
Turnover 3,100.0 3,386.0 4,026.0 7,432.7 7,633.6 7,641.2 7,717.6 9,873.4 12,151.6
Cost ofsales (1,560.0) (1,793.0) (2,213.0) (3,716.4) (3,816.8) (3,820.6) (3,820.2) (4,837.9) (5,857.1)
Gross profit 1,540.0 1,593.0 1,813.0 3,716.4 3,816.8 3,820.6 3,897.4 5,035.4 6,294.5
Expenses:
Other operating income 15.7 8.0 116.4 74.3 88.4 84.1 77.2 88.9 97.2
Distribution costs (268.3) (278.2) (263.5) (483.1) (496.2) (473.8) (463.1) (572.7) (704.8)
Administrative expenses (431.7) (553.9) (583.3) (706.1) (702.3) (687.7) (694.6) (918.2) (1,130.1)
Operating profit 855.7 768.9 1,082.6 2,601.4 2,706.7 2,743.2 2,816.9 3,633.4 4,556.8
Finance costs (263.7) (76.5) (226.3) (880.2) (1,212.7) (1,355.2) (1,526.2) (1,972.2) (2,256.8)
Profit before taxation 592.0 692.4 856.2 1,721.3 1,494.1 1,388.0 1,290.8 1,661.2 2,300.1
Taxation charge (202.0) (302.9) (321.0) (678.0) (575.2) (527.5) (490.5) (614.6) (828.0)
Profit for the year 390.0 389.4 535.3 1,043.3 918.9 860.6 800.3 1,046.6 1,472.1
Annualized earnings per share -basic & diluted (KES) 3.94 3.93 5.40 10.53 9.28 8.69 8.08 10.57 14.86
Weighted average number ofshares outstanding (mn) 99.1 99.1 99.1 99.1 99.1 99.1 99.1 99.1 99.1
Operating Profit % 27.6% 22.7% 26.9% 35.0% 35.5% 35.9% 36.5% 36.8% 37.5%
EBITDA 1,057.6 990.5 1,397.7 2,956.4 3,136.4 3,229.0 3,376.5 4,273.2 5,320.7
Balance Sheet – Assets
ABC Cement Company Limited
Balance Sheet (KES Mn) 2008 2009 2010 2011 2012E 2013E 2014E 2015E 2016E
ASSETS
Non current assets:
Property, plant and equipment 4,372.1 8,688.2 12,189.3 14,834.3 17,458.0 20,028.7 22,556.3 27,840.5 31,937.2
Operating lease prepayments 33.6 32.1 30.5 30.5 30.5 30.5 30.5 30.5 30.5
Intangible assets 10.9 7.1 54.2 54.2 54.2 54.2 54.2 54.2 54.2
Goodwill 50.9 50.9 50.9 50.9 50.9 50.9 50.9 50.9 50.9
Total non current assets 4,467.5 8,778.3 12,324.8 14,969.8 17,593.6 20,164.3 22,691.9 27,976.0 32,072.8
Current assets:
Inventories 787.1 1,084.3 1,129.9 1,500.0 1,512.1 1,486.4 1,444.4 1,789.4 2,080.4
Trade and other receivables 951.9 1,378.6 1,787.1 1,800.0 1,772.8 1,737.6 1,712.7 2,164.0 2,589.7
Due from Employee Share Ownership Plan (ESOP) 83.6 66.8 49.0 49.0 49.0 49.0 49.0 49.0 49.0
Due from related parties 16.2 20.6 61.9 61.9 61.9 61.9 61.9 61.9 61.9
Tax recoverable 0.0 0.0 13.3 13.3 13.3 13.3 13.3 13.3 13.3
Short term Deposits 0.0 0.0 843.0 843.0 843.0 843.0 843.0 843.0 843.0
Cash and bank balances 46.1 812.5 355.9 923.2 782.8 607.2 725.8 695.2 641.4
Total current assets 1,885.0 3,362.7 4,240.1 5,190.4 5,035.0 4,798.4 4,850.1 5,615.8 6,278.7
Total assets 6,352.5 12,141.1 16,564.9 20,160.3 22,628.6 24,962.7 27,541.9 33,591.9 38,351.5
Balance Sheet – Liabilities
ABC Cement Company Limited
Balance Sheet (KES Mn) 2008 2009 2010 2011 2012E 2013E 2014E 2015E 2016E
ASSETS
Non current assets:
Property, plant and equipment 4,372.1 8,688.2 12,189.3 14,834.3 17,458.0 20,028.7 22,556.3 27,840.5 31,937.2
Operating lease prepayments 33.6 32.1 30.5 30.5 30.5 30.5 30.5 30.5 30.5
Intangible assets 10.9 7.1 54.2 54.2 54.2 54.2 54.2 54.2 54.2
Goodwill 50.9 50.9 50.9 50.9 50.9 50.9 50.9 50.9 50.9
Total non current assets 4,467.5 8,778.3 12,324.8 14,969.8 17,593.6 20,164.3 22,691.9 27,976.0 32,072.8
Current assets:
Inventories 787.1 1,084.3 1,129.9 1,500.0 1,512.1 1,486.4 1,444.4 1,789.4 2,080.4
Trade and other receivables 951.9 1,378.6 1,787.1 1,800.0 1,772.8 1,737.6 1,712.7 2,164.0 2,589.7
Due from Employee Share Ownership Plan (ESOP) 83.6 66.8 49.0 49.0 49.0 49.0 49.0 49.0 49.0
Due from related parties 16.2 20.6 61.9 61.9 61.9 61.9 61.9 61.9 61.9
Tax recoverable 0.0 0.0 13.3 13.3 13.3 13.3 13.3 13.3 13.3
Short term Deposits 0.0 0.0 843.0 843.0 843.0 843.0 843.0 843.0 843.0
Cash and bank balances 46.1 812.5 355.9 923.2 782.8 607.2 725.8 695.2 641.4
Total current assets 1,885.0 3,362.7 4,240.1 5,190.4 5,035.0 4,798.4 4,850.1 5,615.8 6,278.7
Total assets 6,352.5 12,141.1 16,564.9 20,160.3 22,628.6 24,962.7 27,541.9 33,591.9 38,351.5
EQUITY & LIABILITIES
Equity:
Share capital 495.3 495.3 495.3 495.3 495.3 495.3 495.3 495.3 495.3
Share premium 302.0 302.0 302.0 302.0 302.0 302.0 302.0 302.0 302.0
Revaluation surplus 35.3 1,531.8 1,465.4 1,465.4 1,465.4 1,465.4 1,465.4 1,465.4 1,465.4
Translation reserve (68.1) (86.8) (99.6) (99.6) (99.6) (99.6) (99.6) (99.6) (99.6)
Retained earnings 1,363.0 1,886.7 2,499.1 3,542.4 4,461.2 5,321.8 6,122.1 7,168.7 8,640.7
Equity attributable to equityholders ofthe parent 2,127.5 4,128.9 4,662.2 5,705.5 6,624.3 7,484.9 8,285.2 9,331.7 10,803.8
Non-controlling interest 0.0 0.0 (18.6) (18.6) (18.6) (18.6) (18.6) (18.6) (18.6)
Total capital & reserves 2,127.5 4,128.9 4,643.6 5,686.9 6,605.7 7,466.3 8,266.6 9,313.2 10,785.2
Non-current liabilities:
Borrowings 1,638.7 3,013.5 6,764.8 9,264.8 12,764.8 14,264.8 13,260.1 17,955.4 20,950.7
Deferred income tax 728.5 1,644.1 1,950.1 1,950.1 1,950.1 1,950.1 1,950.1 1,950.1 1,950.1
Finance leases 14.7 0.8 0.0 0.0 0.0 0.0 0.0 0.0 0.0
Total non-current liabilities 2,382.0 4,658.4 8,714.8 11,214.8 14,714.8 16,214.8 15,210.1 19,905.4 22,900.7
Current liabilities:
Borrowings 1,032.0 2,199.3 1,954.0 1,954.0 0.0 0.0 2,804.7 2,804.7 2,804.7
Finance leases 13.8 7.4 1.0 1.0 1.0 1.0 1.0 1.0 1.0
Trade & other payables 785.7 1,123.8 1,231.4 1,300.0 1,303.6 1,277.0 1,256.0 1,564.0 1,856.3
Due to related parties 3.2 6.5 16.5 0.0 0.0 0.0 0.0 0.0 0.0
Unclaimed dividends 3.5 3.6 3.5 3.5 3.5 3.5 3.5 3.5 3.5
Current tax payable 4.7 13.2 0.0 0.0 0.0 0.0 0.0 0.0 0.0
Total current liabilities 1,842.9 3,353.8 3,206.5 3,258.5 1,308.1 1,281.5 4,065.2 4,373.3 4,665.5
Total equity & liabilities 6,352.5 12,141.1 16,564.9 20,160.3 22,628.6 24,962.7 27,541.9 33,591.9 38,351.5
Cash Flow Statement
ABC Cement Company Limited
Cash Flow (KES Mn) 2008 2009 2010 2011 2012E 2013E 2014E 2015E 2016E
OPERATING ACTIVITIES
Proft before taxation 705.5 948.7 1,113.0 1,721.3 1,494.1 1,388.0 1,290.8 1,661.2 2,300.1
Adjustments:
Depreciation 201.9 221.7 315.2 355.0 429.7 485.8 559.5 639.8 763.9
Amortisation ofoperating lease prepayments 0.3 0.3 1.1 0.0 0.0 0.0 0.0 0.0 0.0
Amortisation ofintangible assets 2.4 3.8 3.9 0.0 0.0 0.0 0.0 0.0 0.0
Interest expense charged to statement ofcomprehensive income 154.1 117.8 226.3 880.2 1,212.7 1,355.2 1,526.2 1,972.2 2,256.8
Finance income recognised in statement ofcomprehensive income (0.2) (9.8) 0.0 0.0 0.0 0.0 0.0 0.0 0.0
Net unrealised foreign exchange gains (23.4) (53.5) 53.5 0.0 0.0 0.0 0.0 0.0 0.0
Loss/ (Gain) on disposal ofproperty, plant and equipment (0.8) (0.9) 0.1 0.0 0.0 0.0 0.0 0.0 0.0
Adjusted proft before working capital 1,039.7 1,228.1 1,713.1 2,956.4 3,136.4 3,229.0 3,376.5 4,273.2 5,320.7
(Increase) Decrease in inventories (229.9) (297.2) (45.6) (370.1) (12.1) 25.7 42.0 (345.0) (291.0)
(Increase) Decrease in trade and other receivables (542.4) (426.7) (408.5) (12.9) 27.2 35.2 24.9 (451.3) (425.7)
Movement due from related party balances (15.4) (1.1) (31.3) (16.5) 0.0 0.0 0.0 0.0 0.0
Increase (Decrease) in trade and other payables 345.0 338.1 107.6 68.6 3.6 (26.5) (21.1) 308.1 292.3
Decrease in due from ESOP 0.0 16.9 17.8 0.0 0.0 0.0 0.0 0.0 0.0
Cash generated from operating activities 597.1 858.1 1,353.1 2,625.5 3,155.0 3,263.5 3,422.3 3,785.0 4,896.3
Interest paid (262.8) (287.2) (502.7) (880.2) (1,212.7) (1,355.2) (1,526.2) (1,972.2) (2,256.8)
Interest received 0.2 9.8 0.0 0.0 0.0 0.0 0.0 0.0 0.0
Corporation tax paid (1.7) (21.8) (46.9) (678.0) (575.2) (527.5) (490.5) (614.6) (828.0)
Net cash genertaed from operating activities 332.8 558.9 803.6 1,067.3 1,367.1 1,380.8 1,405.7 1,198.1 1,811.5
Cash Flow Statement (cont’d)
ABC Cement Company Limited
Cash Flow (KES Mn) 2008 2009 2010 2011 2012E 2013E 2014E 2015E 2016E
OPERATING ACTIVITIES
Proft before taxation 705.5 948.7 1,113.0 1,721.3 1,494.1 1,388.0 1,290.8 1,661.2 2,300.1
Adjustments:
Depreciation 201.9 221.7 315.2 355.0 429.7 485.8 559.5 639.8 763.9
Amortisation ofoperating lease prepayments 0.3 0.3 1.1 0.0 0.0 0.0 0.0 0.0 0.0
Amortisation ofintangible assets 2.4 3.8 3.9 0.0 0.0 0.0 0.0 0.0 0.0
Interest expense charged to statement ofcomprehensive income 154.1 117.8 226.3 880.2 1,212.7 1,355.2 1,526.2 1,972.2 2,256.8
Finance income recognised in statement ofcomprehensive income (0.2) (9.8) 0.0 0.0 0.0 0.0 0.0 0.0 0.0
Net unrealised foreign exchange gains (23.4) (53.5) 53.5 0.0 0.0 0.0 0.0 0.0 0.0
Loss/ (Gain) on disposal ofproperty, plant and equipment (0.8) (0.9) 0.1 0.0 0.0 0.0 0.0 0.0 0.0
Adjusted proft before working capital 1,039.7 1,228.1 1,713.1 2,956.4 3,136.4 3,229.0 3,376.5 4,273.2 5,320.7
(Increase) Decrease in inventories (229.9) (297.2) (45.6) (370.1) (12.1) 25.7 42.0 (345.0) (291.0)
(Increase) Decrease in trade and other receivables (542.4) (426.7) (408.5) (12.9) 27.2 35.2 24.9 (451.3) (425.7)
Movement due from related party balances (15.4) (1.1) (31.3) (16.5) 0.0 0.0 0.0 0.0 0.0
Increase (Decrease) in trade and other payables 345.0 338.1 107.6 68.6 3.6 (26.5) (21.1) 308.1 292.3
Decrease in due from ESOP 0.0 16.9 17.8 0.0 0.0 0.0 0.0 0.0 0.0
Cash generated from operating activities 597.1 858.1 1,353.1 2,625.5 3,155.0 3,263.5 3,422.3 3,785.0 4,896.3
Interest paid (262.8) (287.2) (502.7) (880.2) (1,212.7) (1,355.2) (1,526.2) (1,972.2) (2,256.8)
Interest received 0.2 9.8 0.0 0.0 0.0 0.0 0.0 0.0 0.0
Corporation tax paid (1.7) (21.8) (46.9) (678.0) (575.2) (527.5) (490.5) (614.6) (828.0)
Net cash genertaed from operating activities 332.8 558.9 803.6 1,067.3 1,367.1 1,380.8 1,405.7 1,198.1 1,811.5
INVESTING ACTIVITIES
Additions to property, plant and equipment (1,111.5) (2,216.9) (3,618.6) (3,000.0) (3,053.4) (3,056.5) (3,087.1) (5,924.0) (4,860.6)
Additions to operating lease prepayments (21.1) 0.0 0.0 0.0 0.0 0.0 0.0 0.0 0.0
Additions to intangible assets (6.8) 0.0 (51.0) 0.0 0.0 0.0 0.0 0.0 0.0
Proceeds ofdisposal ofproperty, plant and equipment 0.8 0.9 0.8 0.0 0.0 0.0 0.0 0.0 0.0
Net cash used in investing activities (1,138.6) (2,216.0) (3,668.8) (3,000.0) (3,053.4) (3,056.5) (3,087.1) (5,924.0) (4,860.6)
FINANCING ACTIVITIES
Finance lease payments (19.0) (22.4) (7.6) 0.0 0.0 0.0 0.0 0.0 0.0
Purchase ofshares from non-controlling interest (100.2) 0.0 0.0 0.0 0.0 0.0 0.0 0.0 0.0
Borrowings received 1,081.7 2,493.0 4,377.8 4,454.0 3,500.0 1,500.0 1,800.0 7,500.0 5,800.0
Repayment ofamounts borrowed (181.7) (499.1) (1,251.7) (1,954.0) (1,954.0) 0.0 0.0 (2,804.7) (2,804.7)
Dividends paid (123.6) (123.8) (148.7) 0.0 0.0 0.0 0.0 0.0 0.0
Net cash used in financing activities 657.2 1,847.7 2,969.8 2,500.0 1,546.0 1,500.0 1,800.0 4,695.3 2,995.3
Increase in cash and cash equivalents (148.7) 190.6 104.6 567.3 (140.4) (175.7) 118.6 (30.6) (53.8)
Cash and cash equivalents at the beginning ofthe year 8.5 (137.9) 53.1 134.8 702.1 561.7 386.1 504.7 474.1
Effect oftranslation adjustment on cash held in foreign subsidiaries 2.3 0.4 (23.0) 0.0 0.0 0.0 0.0 0.0 0.0
Cash and cash equivalents at the end ofthe year (137.9) 53.1 134.8 702.1 561.7 386.1 504.7 474.1 420.3
Investments in short-term deposits 0.0 0.0 (843.0) (843.0) (843.0) (843.0) (843.0) (843.0) (843.0)
Bank overdraft 184.0 759.4 1,064.1 1,064.1 1,064.1 1,064.1 1,064.1 1,064.1 1,064.1
Cash & bank balances 46.1 812.5 355.9 923.2 782.8 607.2 725.8 695.2 641.4
Discounted Cash Flow Valuation (DCF)
ABC Cement Company Limited
Discounted Cash Flow (KES Mn) 2012E 2013E 2014E 2015E 2016E Terminal Year
Assumption: The valuation isdone ason January 1, 2012
Total Revenue 7,633.6 7,641.2 7,717.6 9,873.4 12,151.6 12,151.6
Growth % 2.7% 0.1% 1.0% 27.9% 23.1%
EBITDA 3,136.4 3,229.0 3,376.5 4,273.2 5,320.7 5,320.7
EBITDA% 41.1% 42.3% 43.7% 43.3% 43.8% 43.8%
EBIT 2,706.7 2,743.2 2,816.9 3,633.4 4,556.8 4,556.8
EBIT % 35.5% 35.9% 36.5% 36.8% 37.5% 37.5%
Tax on EBIT 1,042.1 1,042.4 1,070.4 1,344.4 1,640.5 1,640.5
Effective Tax % 38.5% 38.0% 38.0% 37.0% 36.0% 36.0%
NOPAT 1,664.6 1,700.8 1,746.5 2,289.0 2,916.4 2,916.4
NOPAT % 21.8% 22.3% 22.6% 23.2% 24.0% 24.0%
Depreciation & Amortization 429.7 485.8 559.5 639.8 763.9 763.9
Capex 3,053.4 3,056.5 3,087.1 5,924.0 4,860.6 763.9
Capex % 40.0% 40.0% 40.0% 60.0% 40.0% 6.3%
Working Capital Changes 18.6 34.5 45.9 (488.3) (424.4) (424.4)
Free Cash Flows to Firm 5,166.3 5,277.5 5,438.9 8,364.6 8,116.5 4,019.7
Growth % 2.2% 3.1% 53.8% -3.0%
Years Discounted 0.5 1.5 2.5 3.5 4.5
Discounting Factor 0.9410 0.8333 0.7379 0.6534 0.5786
Discounted Cash Flow 4,861.6 4,397.7 4,013.3 5,465.4 4,696.2
Assumption: The valuation isdone ason January 1, 2012
Valuation Parameters(KES Mn) Other Analysis
WACC 12.9% DTV/EV 69.7%
Terminal Growth Rate 5.1% Implied Exit EBITDAMultiple 14.5x
Terminal FCFF 4,019.7 EV/2012EFCF 15.0x
Discounted Terminal Value 53,962.0
Discounted Cash Flow of Forecasted Period 23,434.2 Sensitivity Analysis
Enterprise Value 77,396.2 Enterprise Value Sensitivity
Debt 11,218.8
Minority Interest 18.6 66,158.8 4.6% 4.9% 5.1% 5.4% 5.6%
Equity Value 66,158.8 11.9% 70,101.5 72,269.5 74,596.2 77,099.7 79,801.0
Shares Outstanding (mn) 99.1 12.4% 66,167.3 68,071.4 70,105.4 72,283.0 74,620.1
Market Value per share 667.9 12.9% 62,678.1 64,364.6 66,158.8 68,071.3 70,114.4
13.2% 61,076.4 62,668.1 64,358.3 66,156.5 68,073.2
13.4% 59,559.2 61,064.0 62,659.3 64,353.2 66,155.4
WACC
Growth Rate
Weighted Average Cost ofCapital
Comparableson Nairobi Stock Exhange Levered Beta
ARMCement Ltd 0.80
Bamburi Cement Ltd 0.73
E.A.Portland Cement Ltd 0.19
Mean Unlevered Beta 0.50
Weightage 0.50
Industry Beta 1.12
Weightage 0.50
Total Unlevered Beta 0.81
WACC Calculation
US Risk Free Rate ofReturn (Rf) 2.6%
Kenya Country Risk Premium 6.0%
Equity Risk Premium (Rm -Rf) 11.8%
Gearing (D/Eq) 1.97
Leverage (D/D+Eq) 0.66
Eq/D+Eq 0.34
Corporate Tax Rate (t) 30.0%
1-t 70.0%
Levered Beta 192.0%
Ke (Unlevered) 12.2%
Ke (Levered) 25.3%
Kd 9.5%
Kd (1-t) 6.7%
WACC 12.9%
Ratio Analysis
ABC Cement Company Limited
Key ratios 2008 2009 2010 2011 2012E 2013E 2014E 2015E 2016E
Profitability ratios
Gross margin % 49.7% 47.0% 45.0% 50.0% 50.0% 50.0% 50.5% 51.0% 51.8%
EBITDAmargin % 34.1% 29.3% 34.7% 39.8% 41.1% 42.3% 43.7% 43.3% 43.8%
EBITmargin % 27.6% 22.7% 26.9% 35.0% 35.5% 35.9% 36.5% 36.8% 37.5%
Net margin % 12.6% 11.5% 13.3% 14.0% 12.0% 11.3% 10.4% 10.6% 12.1%
RoA% 6.1% 4.2% 3.7% 5.7% 4.3% 3.6% 3.0% 3.4% 4.1%
RoE% 20.2% 12.4% 12.2% 20.1% 14.9% 12.2% 10.1% 11.9% 14.6%
Debt-to-Equity % 125.5% 126.2% 187.0% 196.6% 192.7% 190.6% 193.9% 222.5% 219.9%
Dividend yield % 0.2% 0.2% 0.2% 0.0% 0.0% 0.0% 0.0% 0.0% 0.0%
Inventory days 184.7 220.7 186.4 147.3 145.0 142.0 138.0 135.0 130.0
Days receivable 112.4 148.6 162.0 88.4 85.0 83.0 81.0 80.0 78.0
Days payable 184.3 228.8 203.1 127.7 125.0 122.0 120.0 118.0 116.0
Cash conversion cycle 112.7 140.6 145.3 108.0 105.0 103.0 99.0 97.0 92.0
Valuation Ratios
P/Ex 169.6x 169.9x 123.6x 63.4x 72.0x 76.9x 82.7x 63.2x 44.9x
P/S x 21.3x 19.5x 16.4x 8.9x 8.7x 8.7x 8.6x 6.7x 5.4x
P/BV x 31.1x 16.0x 14.2x 11.6x 10.0x 8.8x 8.0x 7.1x 6.1x
Per share Ratios
EPS (KES) 3.9 3.9 5.4 10.5 9.3 8.7 8.1 10.6 14.9
Sales per share (KES) 31.3 34.2 40.6 75.0 77.1 77.1 77.9 99.7 122.7
DPS (KES) 1.2 1.2 1.5 0.0 0.0 0.0 0.0 0.0 0.0
BVPS (KES) 21.5 41.7 47.1 57.6 66.9 75.6 83.6 94.2 109.1
Dupont Analysis
Net margin 12.6% 11.5% 13.3% 14.0% 12.0% 11.3% 10.4% 10.6% 12.1%
Asset Turnover 48.8% 27.9% 24.3% 36.9% 33.7% 30.6% 28.0% 29.4% 31.7%
Financial leverage 3.0 2.9 3.6 3.5 3.4 3.3 3.3 3.6 3.5
RoE 18.3% 9.4% 11.5% 18.3% 13.9% 11.5% 9.7% 11.2% 13.6%

Contenu connexe

Tendances

MARUTI SUZUKI INDIA PVT LTD. SALES PROMOTION
MARUTI SUZUKI INDIA PVT LTD. SALES PROMOTIONMARUTI SUZUKI INDIA PVT LTD. SALES PROMOTION
MARUTI SUZUKI INDIA PVT LTD. SALES PROMOTION
Apoorv Malu
 
Tata Motorsv
Tata MotorsvTata Motorsv
Tata Motorsv
purval
 
Fdocuments.in maruti suzuki-hr-practices
Fdocuments.in maruti suzuki-hr-practicesFdocuments.in maruti suzuki-hr-practices
Fdocuments.in maruti suzuki-hr-practices
Arvindsumitlakra
 
Business policy and strategic management of maruti suzuki
Business policy and strategic management of maruti suzukiBusiness policy and strategic management of maruti suzuki
Business policy and strategic management of maruti suzuki
Rahul Hedau
 

Tendances (20)

Tata steel
Tata steelTata steel
Tata steel
 
Auto mobile pakistan industry anylasis
Auto mobile pakistan industry anylasis Auto mobile pakistan industry anylasis
Auto mobile pakistan industry anylasis
 
MARUTI SUZUKI INDIA PVT LTD. SALES PROMOTION
MARUTI SUZUKI INDIA PVT LTD. SALES PROMOTIONMARUTI SUZUKI INDIA PVT LTD. SALES PROMOTION
MARUTI SUZUKI INDIA PVT LTD. SALES PROMOTION
 
A case study on ballarpur industries
A case study on ballarpur industriesA case study on ballarpur industries
A case study on ballarpur industries
 
Dg annual report_2021
Dg annual report_2021Dg annual report_2021
Dg annual report_2021
 
Strategic Management Report on Automotive sector.
Strategic Management Report on Automotive sector.Strategic Management Report on Automotive sector.
Strategic Management Report on Automotive sector.
 
Tata Motorsv
Tata MotorsvTata Motorsv
Tata Motorsv
 
Lucky cement Annual Report 2010
Lucky cement   Annual Report 2010Lucky cement   Annual Report 2010
Lucky cement Annual Report 2010
 
Organizational Structure & Leadership Style in M/s Larsen & Toubro , ...
Organizational Structure & Leadership Style in M/s Larsen & Toubro , ...Organizational Structure & Leadership Style in M/s Larsen & Toubro , ...
Organizational Structure & Leadership Style in M/s Larsen & Toubro , ...
 
Fdocuments.in maruti suzuki-hr-practices
Fdocuments.in maruti suzuki-hr-practicesFdocuments.in maruti suzuki-hr-practices
Fdocuments.in maruti suzuki-hr-practices
 
Financial Analysis of Lucky Cements & Attock Cements.
Financial Analysis of Lucky Cements & Attock Cements.Financial Analysis of Lucky Cements & Attock Cements.
Financial Analysis of Lucky Cements & Attock Cements.
 
Business policy and strategy ( dg khan cement company
Business policy and strategy ( dg khan cement companyBusiness policy and strategy ( dg khan cement company
Business policy and strategy ( dg khan cement company
 
Jk Tyre & Industries Ltd - Final Presentation.
Jk Tyre & Industries Ltd - Final Presentation.Jk Tyre & Industries Ltd - Final Presentation.
Jk Tyre & Industries Ltd - Final Presentation.
 
Financial Ratio Analysis PowerPoint Presentation Slides
Financial Ratio Analysis PowerPoint Presentation SlidesFinancial Ratio Analysis PowerPoint Presentation Slides
Financial Ratio Analysis PowerPoint Presentation Slides
 
The india cement ltd(pooja
The india cement ltd(poojaThe india cement ltd(pooja
The india cement ltd(pooja
 
Swot analysis of tata motors
Swot analysis of tata motorsSwot analysis of tata motors
Swot analysis of tata motors
 
Business policy and strategic management of maruti suzuki
Business policy and strategic management of maruti suzukiBusiness policy and strategic management of maruti suzuki
Business policy and strategic management of maruti suzuki
 
Wipro – Ratio Analysis
Wipro – Ratio AnalysisWipro – Ratio Analysis
Wipro – Ratio Analysis
 
industrial analysis of Pakistan cement industry
industrial analysis of Pakistan cement industryindustrial analysis of Pakistan cement industry
industrial analysis of Pakistan cement industry
 
Financial Statement Analysis of Lucky cement
Financial Statement Analysis of Lucky cementFinancial Statement Analysis of Lucky cement
Financial Statement Analysis of Lucky cement
 

En vedette

FINANCIAL STATEMENT DANGOTE...POLICY
FINANCIAL STATEMENT DANGOTE...POLICYFINANCIAL STATEMENT DANGOTE...POLICY
FINANCIAL STATEMENT DANGOTE...POLICY
Christian Ibe
 
paper recycle project
paper recycle projectpaper recycle project
paper recycle project
Syed Marzan
 
Cement Manufacturing Plant, Detailed Project Report, Profile, Business Plan, ...
Cement Manufacturing Plant, Detailed Project Report, Profile, Business Plan, ...Cement Manufacturing Plant, Detailed Project Report, Profile, Business Plan, ...
Cement Manufacturing Plant, Detailed Project Report, Profile, Business Plan, ...
Ajjay Kumar Gupta
 
Product costing ppt
Product costing pptProduct costing ppt
Product costing ppt
Sujay Kumar
 
Gypsum as a costruction material
Gypsum as a costruction materialGypsum as a costruction material
Gypsum as a costruction material
Sharon Shaji
 

En vedette (15)

FINANCIAL STATEMENT DANGOTE...POLICY
FINANCIAL STATEMENT DANGOTE...POLICYFINANCIAL STATEMENT DANGOTE...POLICY
FINANCIAL STATEMENT DANGOTE...POLICY
 
iPro - Software for Company Statutory e-forms & Registers.
iPro - Software for Company Statutory e-forms & Registers.iPro - Software for Company Statutory e-forms & Registers.
iPro - Software for Company Statutory e-forms & Registers.
 
Cement industry
Cement industryCement industry
Cement industry
 
Pitch Book Sample - Food Sector
Pitch Book Sample - Food SectorPitch Book Sample - Food Sector
Pitch Book Sample - Food Sector
 
Inventory Modelling
Inventory ModellingInventory Modelling
Inventory Modelling
 
Gujarat Ambuja-Cost Leader in the Indian Cement Industry
Gujarat Ambuja-Cost Leader in the Indian Cement IndustryGujarat Ambuja-Cost Leader in the Indian Cement Industry
Gujarat Ambuja-Cost Leader in the Indian Cement Industry
 
paper recycle project
paper recycle projectpaper recycle project
paper recycle project
 
Cement Manufacturing Plant, Detailed Project Report, Profile, Business Plan, ...
Cement Manufacturing Plant, Detailed Project Report, Profile, Business Plan, ...Cement Manufacturing Plant, Detailed Project Report, Profile, Business Plan, ...
Cement Manufacturing Plant, Detailed Project Report, Profile, Business Plan, ...
 
Cement Industry and Audit Presentation
Cement Industry and Audit PresentationCement Industry and Audit Presentation
Cement Industry and Audit Presentation
 
Cement Industry Analysis
Cement Industry AnalysisCement Industry Analysis
Cement Industry Analysis
 
Product costing ppt
Product costing pptProduct costing ppt
Product costing ppt
 
Real Estate Development - Financial Model
Real Estate Development - Financial ModelReal Estate Development - Financial Model
Real Estate Development - Financial Model
 
ESOP Business Model
ESOP Business ModelESOP Business Model
ESOP Business Model
 
Gypsum as a costruction material
Gypsum as a costruction materialGypsum as a costruction material
Gypsum as a costruction material
 
State of the Word 2011
State of the Word 2011State of the Word 2011
State of the Word 2011
 

Similaire à Financial Model Sample Format - Cement Company

thermo fisher ReconciliationFinancialInfoQ32008
thermo fisher ReconciliationFinancialInfoQ32008thermo fisher ReconciliationFinancialInfoQ32008
thermo fisher ReconciliationFinancialInfoQ32008
finance40
 
thermo fisher ReconciliationFinancialInfoQ32008
thermo fisher ReconciliationFinancialInfoQ32008thermo fisher ReconciliationFinancialInfoQ32008
thermo fisher ReconciliationFinancialInfoQ32008
finance40
 
Valuation Of ASHOK LEYLAND
Valuation Of ASHOK LEYLANDValuation Of ASHOK LEYLAND
Valuation Of ASHOK LEYLAND
Aakash Singh
 
Eli Lilly and Co Ratios - KeyEli Lilly and Co Ratios - Key Met.docx
Eli Lilly and Co  Ratios - KeyEli Lilly and Co  Ratios - Key Met.docxEli Lilly and Co  Ratios - KeyEli Lilly and Co  Ratios - Key Met.docx
Eli Lilly and Co Ratios - KeyEli Lilly and Co Ratios - Key Met.docx
christinemaritza
 
thermo fisher 02CD4A18-7BC2-44BB-869A-463BE382B07C_ReconciliationofFinancialI...
thermo fisher 02CD4A18-7BC2-44BB-869A-463BE382B07C_ReconciliationofFinancialI...thermo fisher 02CD4A18-7BC2-44BB-869A-463BE382B07C_ReconciliationofFinancialI...
thermo fisher 02CD4A18-7BC2-44BB-869A-463BE382B07C_ReconciliationofFinancialI...
finance40
 
thermo fisher 02CD4A18-7BC2-44BB-869A-463BE382B07C_ReconciliationofFinancial...
thermo fisher  02CD4A18-7BC2-44BB-869A-463BE382B07C_ReconciliationofFinancial...thermo fisher  02CD4A18-7BC2-44BB-869A-463BE382B07C_ReconciliationofFinancial...
thermo fisher 02CD4A18-7BC2-44BB-869A-463BE382B07C_ReconciliationofFinancial...
finance40
 
thermo fisher 02CD4A18-7BC2-44BB-869A-463BE382B07C_ReconciliationofFinancialI...
thermo fisher 02CD4A18-7BC2-44BB-869A-463BE382B07C_ReconciliationofFinancialI...thermo fisher 02CD4A18-7BC2-44BB-869A-463BE382B07C_ReconciliationofFinancialI...
thermo fisher 02CD4A18-7BC2-44BB-869A-463BE382B07C_ReconciliationofFinancialI...
finance40
 

Similaire à Financial Model Sample Format - Cement Company (20)

AZN/ALXN
AZN/ALXNAZN/ALXN
AZN/ALXN
 
Ppt ideko spx_team
Ppt ideko spx_teamPpt ideko spx_team
Ppt ideko spx_team
 
Hansson
HanssonHansson
Hansson
 
Excel Model for Valuation of Natural Gas Firm
Excel Model for Valuation of Natural Gas FirmExcel Model for Valuation of Natural Gas Firm
Excel Model for Valuation of Natural Gas Firm
 
thermo fisher ReconciliationFinancialInfoQ32008
thermo fisher ReconciliationFinancialInfoQ32008thermo fisher ReconciliationFinancialInfoQ32008
thermo fisher ReconciliationFinancialInfoQ32008
 
thermo fisher ReconciliationFinancialInfoQ32008
thermo fisher ReconciliationFinancialInfoQ32008thermo fisher ReconciliationFinancialInfoQ32008
thermo fisher ReconciliationFinancialInfoQ32008
 
INVESTAURA_Business-Planning-Template.pdf
INVESTAURA_Business-Planning-Template.pdfINVESTAURA_Business-Planning-Template.pdf
INVESTAURA_Business-Planning-Template.pdf
 
itw_041019
itw_041019itw_041019
itw_041019
 
Valuation Of ASHOK LEYLAND
Valuation Of ASHOK LEYLANDValuation Of ASHOK LEYLAND
Valuation Of ASHOK LEYLAND
 
KENYA AIRWAYS STATEMENT ANALYSIS- CIFA LUDENYO
KENYA AIRWAYS STATEMENT ANALYSIS- CIFA LUDENYOKENYA AIRWAYS STATEMENT ANALYSIS- CIFA LUDENYO
KENYA AIRWAYS STATEMENT ANALYSIS- CIFA LUDENYO
 
AXA Poland non life insurance companies
AXA Poland non life insurance companiesAXA Poland non life insurance companies
AXA Poland non life insurance companies
 
AXA Poland non life insurance companies
AXA Poland non life insurance companiesAXA Poland non life insurance companies
AXA Poland non life insurance companies
 
Axa poland non life insurance
Axa poland non life insuranceAxa poland non life insurance
Axa poland non life insurance
 
Profit and loss projection
Profit and loss projectionProfit and loss projection
Profit and loss projection
 
itw_050127
itw_050127itw_050127
itw_050127
 
Eli Lilly and Co Ratios - KeyEli Lilly and Co Ratios - Key Met.docx
Eli Lilly and Co  Ratios - KeyEli Lilly and Co  Ratios - Key Met.docxEli Lilly and Co  Ratios - KeyEli Lilly and Co  Ratios - Key Met.docx
Eli Lilly and Co Ratios - KeyEli Lilly and Co Ratios - Key Met.docx
 
itw_Q206
itw_Q206itw_Q206
itw_Q206
 
thermo fisher 02CD4A18-7BC2-44BB-869A-463BE382B07C_ReconciliationofFinancialI...
thermo fisher 02CD4A18-7BC2-44BB-869A-463BE382B07C_ReconciliationofFinancialI...thermo fisher 02CD4A18-7BC2-44BB-869A-463BE382B07C_ReconciliationofFinancialI...
thermo fisher 02CD4A18-7BC2-44BB-869A-463BE382B07C_ReconciliationofFinancialI...
 
thermo fisher 02CD4A18-7BC2-44BB-869A-463BE382B07C_ReconciliationofFinancial...
thermo fisher  02CD4A18-7BC2-44BB-869A-463BE382B07C_ReconciliationofFinancial...thermo fisher  02CD4A18-7BC2-44BB-869A-463BE382B07C_ReconciliationofFinancial...
thermo fisher 02CD4A18-7BC2-44BB-869A-463BE382B07C_ReconciliationofFinancial...
 
thermo fisher 02CD4A18-7BC2-44BB-869A-463BE382B07C_ReconciliationofFinancialI...
thermo fisher 02CD4A18-7BC2-44BB-869A-463BE382B07C_ReconciliationofFinancialI...thermo fisher 02CD4A18-7BC2-44BB-869A-463BE382B07C_ReconciliationofFinancialI...
thermo fisher 02CD4A18-7BC2-44BB-869A-463BE382B07C_ReconciliationofFinancialI...
 

Dernier

VIP Call Girl in Mira Road 💧 9920725232 ( Call Me ) Get A New Crush Everyday ...
VIP Call Girl in Mira Road 💧 9920725232 ( Call Me ) Get A New Crush Everyday ...VIP Call Girl in Mira Road 💧 9920725232 ( Call Me ) Get A New Crush Everyday ...
VIP Call Girl in Mira Road 💧 9920725232 ( Call Me ) Get A New Crush Everyday ...
dipikadinghjn ( Why You Choose Us? ) Escorts
 
➥🔝 7737669865 🔝▻ Malda Call-girls in Women Seeking Men 🔝Malda🔝 Escorts Ser...
➥🔝 7737669865 🔝▻ Malda Call-girls in Women Seeking Men  🔝Malda🔝   Escorts Ser...➥🔝 7737669865 🔝▻ Malda Call-girls in Women Seeking Men  🔝Malda🔝   Escorts Ser...
➥🔝 7737669865 🔝▻ Malda Call-girls in Women Seeking Men 🔝Malda🔝 Escorts Ser...
amitlee9823
 
VIP Independent Call Girls in Taloja 🌹 9920725232 ( Call Me ) Mumbai Escorts ...
VIP Independent Call Girls in Taloja 🌹 9920725232 ( Call Me ) Mumbai Escorts ...VIP Independent Call Girls in Taloja 🌹 9920725232 ( Call Me ) Mumbai Escorts ...
VIP Independent Call Girls in Taloja 🌹 9920725232 ( Call Me ) Mumbai Escorts ...
dipikadinghjn ( Why You Choose Us? ) Escorts
 
VIP Independent Call Girls in Mumbai 🌹 9920725232 ( Call Me ) Mumbai Escorts ...
VIP Independent Call Girls in Mumbai 🌹 9920725232 ( Call Me ) Mumbai Escorts ...VIP Independent Call Girls in Mumbai 🌹 9920725232 ( Call Me ) Mumbai Escorts ...
VIP Independent Call Girls in Mumbai 🌹 9920725232 ( Call Me ) Mumbai Escorts ...
dipikadinghjn ( Why You Choose Us? ) Escorts
 
VIP Call Girl Service Andheri West ⚡ 9920725232 What It Takes To Be The Best ...
VIP Call Girl Service Andheri West ⚡ 9920725232 What It Takes To Be The Best ...VIP Call Girl Service Andheri West ⚡ 9920725232 What It Takes To Be The Best ...
VIP Call Girl Service Andheri West ⚡ 9920725232 What It Takes To Be The Best ...
dipikadinghjn ( Why You Choose Us? ) Escorts
 
CBD Belapur Expensive Housewife Call Girls Number-📞📞9833754194 No 1 Vipp HIgh...
CBD Belapur Expensive Housewife Call Girls Number-📞📞9833754194 No 1 Vipp HIgh...CBD Belapur Expensive Housewife Call Girls Number-📞📞9833754194 No 1 Vipp HIgh...
CBD Belapur Expensive Housewife Call Girls Number-📞📞9833754194 No 1 Vipp HIgh...
priyasharma62062
 

Dernier (20)

(Vedika) Low Rate Call Girls in Pune Call Now 8250077686 Pune Escorts 24x7
(Vedika) Low Rate Call Girls in Pune Call Now 8250077686 Pune Escorts 24x7(Vedika) Low Rate Call Girls in Pune Call Now 8250077686 Pune Escorts 24x7
(Vedika) Low Rate Call Girls in Pune Call Now 8250077686 Pune Escorts 24x7
 
Toronto dominion bank investor presentation.pdf
Toronto dominion bank investor presentation.pdfToronto dominion bank investor presentation.pdf
Toronto dominion bank investor presentation.pdf
 
20240419-SMC-submission-Annual-Superannuation-Performance-Test-–-design-optio...
20240419-SMC-submission-Annual-Superannuation-Performance-Test-–-design-optio...20240419-SMC-submission-Annual-Superannuation-Performance-Test-–-design-optio...
20240419-SMC-submission-Annual-Superannuation-Performance-Test-–-design-optio...
 
Pension dashboards forum 1 May 2024 (1).pdf
Pension dashboards forum 1 May 2024 (1).pdfPension dashboards forum 1 May 2024 (1).pdf
Pension dashboards forum 1 May 2024 (1).pdf
 
Diva-Thane European Call Girls Number-9833754194-Diva Busty Professional Call...
Diva-Thane European Call Girls Number-9833754194-Diva Busty Professional Call...Diva-Thane European Call Girls Number-9833754194-Diva Busty Professional Call...
Diva-Thane European Call Girls Number-9833754194-Diva Busty Professional Call...
 
VIP Call Girl in Mira Road 💧 9920725232 ( Call Me ) Get A New Crush Everyday ...
VIP Call Girl in Mira Road 💧 9920725232 ( Call Me ) Get A New Crush Everyday ...VIP Call Girl in Mira Road 💧 9920725232 ( Call Me ) Get A New Crush Everyday ...
VIP Call Girl in Mira Road 💧 9920725232 ( Call Me ) Get A New Crush Everyday ...
 
➥🔝 7737669865 🔝▻ Malda Call-girls in Women Seeking Men 🔝Malda🔝 Escorts Ser...
➥🔝 7737669865 🔝▻ Malda Call-girls in Women Seeking Men  🔝Malda🔝   Escorts Ser...➥🔝 7737669865 🔝▻ Malda Call-girls in Women Seeking Men  🔝Malda🔝   Escorts Ser...
➥🔝 7737669865 🔝▻ Malda Call-girls in Women Seeking Men 🔝Malda🔝 Escorts Ser...
 
Mira Road Awesome 100% Independent Call Girls NUmber-9833754194-Dahisar Inter...
Mira Road Awesome 100% Independent Call Girls NUmber-9833754194-Dahisar Inter...Mira Road Awesome 100% Independent Call Girls NUmber-9833754194-Dahisar Inter...
Mira Road Awesome 100% Independent Call Girls NUmber-9833754194-Dahisar Inter...
 
VIP Independent Call Girls in Taloja 🌹 9920725232 ( Call Me ) Mumbai Escorts ...
VIP Independent Call Girls in Taloja 🌹 9920725232 ( Call Me ) Mumbai Escorts ...VIP Independent Call Girls in Taloja 🌹 9920725232 ( Call Me ) Mumbai Escorts ...
VIP Independent Call Girls in Taloja 🌹 9920725232 ( Call Me ) Mumbai Escorts ...
 
falcon-invoice-discounting-unlocking-prime-investment-opportunities
falcon-invoice-discounting-unlocking-prime-investment-opportunitiesfalcon-invoice-discounting-unlocking-prime-investment-opportunities
falcon-invoice-discounting-unlocking-prime-investment-opportunities
 
W.D. Gann Theory Complete Information.pdf
W.D. Gann Theory Complete Information.pdfW.D. Gann Theory Complete Information.pdf
W.D. Gann Theory Complete Information.pdf
 
VIP Independent Call Girls in Mumbai 🌹 9920725232 ( Call Me ) Mumbai Escorts ...
VIP Independent Call Girls in Mumbai 🌹 9920725232 ( Call Me ) Mumbai Escorts ...VIP Independent Call Girls in Mumbai 🌹 9920725232 ( Call Me ) Mumbai Escorts ...
VIP Independent Call Girls in Mumbai 🌹 9920725232 ( Call Me ) Mumbai Escorts ...
 
Call Girls Koregaon Park Call Me 7737669865 Budget Friendly No Advance Booking
Call Girls Koregaon Park Call Me 7737669865 Budget Friendly No Advance BookingCall Girls Koregaon Park Call Me 7737669865 Budget Friendly No Advance Booking
Call Girls Koregaon Park Call Me 7737669865 Budget Friendly No Advance Booking
 
(INDIRA) Call Girl Mumbai Call Now 8250077686 Mumbai Escorts 24x7
(INDIRA) Call Girl Mumbai Call Now 8250077686 Mumbai Escorts 24x7(INDIRA) Call Girl Mumbai Call Now 8250077686 Mumbai Escorts 24x7
(INDIRA) Call Girl Mumbai Call Now 8250077686 Mumbai Escorts 24x7
 
VIP Call Girl Service Andheri West ⚡ 9920725232 What It Takes To Be The Best ...
VIP Call Girl Service Andheri West ⚡ 9920725232 What It Takes To Be The Best ...VIP Call Girl Service Andheri West ⚡ 9920725232 What It Takes To Be The Best ...
VIP Call Girl Service Andheri West ⚡ 9920725232 What It Takes To Be The Best ...
 
CBD Belapur Expensive Housewife Call Girls Number-📞📞9833754194 No 1 Vipp HIgh...
CBD Belapur Expensive Housewife Call Girls Number-📞📞9833754194 No 1 Vipp HIgh...CBD Belapur Expensive Housewife Call Girls Number-📞📞9833754194 No 1 Vipp HIgh...
CBD Belapur Expensive Housewife Call Girls Number-📞📞9833754194 No 1 Vipp HIgh...
 
Vasai-Virar High Profile Model Call Girls📞9833754194-Nalasopara Satisfy Call ...
Vasai-Virar High Profile Model Call Girls📞9833754194-Nalasopara Satisfy Call ...Vasai-Virar High Profile Model Call Girls📞9833754194-Nalasopara Satisfy Call ...
Vasai-Virar High Profile Model Call Girls📞9833754194-Nalasopara Satisfy Call ...
 
8377087607, Door Step Call Girls In Kalkaji (Locanto) 24/7 Available
8377087607, Door Step Call Girls In Kalkaji (Locanto) 24/7 Available8377087607, Door Step Call Girls In Kalkaji (Locanto) 24/7 Available
8377087607, Door Step Call Girls In Kalkaji (Locanto) 24/7 Available
 
7 tips trading Deriv Accumulator Options
7 tips trading Deriv Accumulator Options7 tips trading Deriv Accumulator Options
7 tips trading Deriv Accumulator Options
 
Call Girls Service Pune ₹7.5k Pick Up & Drop With Cash Payment 9352852248 Cal...
Call Girls Service Pune ₹7.5k Pick Up & Drop With Cash Payment 9352852248 Cal...Call Girls Service Pune ₹7.5k Pick Up & Drop With Cash Payment 9352852248 Cal...
Call Girls Service Pune ₹7.5k Pick Up & Drop With Cash Payment 9352852248 Cal...
 

Financial Model Sample Format - Cement Company

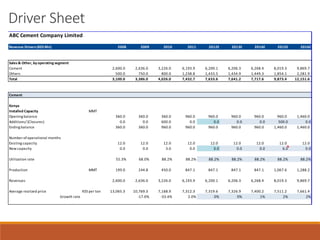
  • 1. Driver Sheet ABC Cement Company Limited Revenue Drivers(KES Mn) 2008 2009 2010 2011 2012E 2013E 2014E 2015E 2016E Sales& Other, by operating segment Cement 2,600.0 2,636.0 3,226.0 6,193.9 6,200.1 6,206.3 6,268.4 8,019.3 9,869.7 Others 500.0 750.0 800.0 1,238.8 1,433.5 1,434.9 1,449.3 1,854.1 2,281.9 Total 3,100.0 3,386.0 4,026.0 7,432.7 7,633.6 7,641.2 7,717.6 9,873.4 12,151.6 Cement Kenya Installed Capacity MMT Opening balance 360.0 360.0 360.0 960.0 960.0 960.0 960.0 960.0 1,460.0 Additions/ (Closures) 0.0 0.0 600.0 0.0 0.0 0.0 0.0 500.0 0.0 Ending balance 360.0 360.0 960.0 960.0 960.0 960.0 960.0 1,460.0 1,460.0 Number ofoperational months Existing capacity 12.0 12.0 12.0 12.0 12.0 12.0 12.0 12.0 12.0 New capacity 0.0 0.0 3.0 0.0 0.0 0.0 0.0 6.0 0.0 Utilization rate 55.3% 68.0% 88.2% 88.2% 88.2% 88.2% 88.2% 88.2% 88.2% Production MMT 199.0 244.8 450.0 847.1 847.1 847.1 847.1 1,067.6 1,288.2 Revenues 2,600.0 2,636.0 3,226.0 6,193.9 6,200.1 6,206.3 6,268.4 8,019.3 9,869.7 Average realized price KES per ton 13,065.3 10,769.3 7,168.9 7,312.3 7,319.6 7,326.9 7,400.2 7,511.2 7,661.4 Growth rate -17.6% -33.4% 2.0% 0% 0% 1% 2% 2%
  • 2. Driver Sheet (cont’d) ABC Cement Company Limited Revenue Drivers(KES Mn) 2008 2009 2010 2011 2012E 2013E 2014E 2015E 2016E Other sales 500.0 750.0 800.0 1,238.8 1,433.5 1,434.9 1,449.3 1,854.1 2,281.9 As a % ofCement sales 19.2% 28.5% 24.8% 20.0% 23% 23% 23% 23% 23% Cost ofsales (1,560.0) (1,793.0) (2,213.0) (3,716.4) (3,816.8) (3,820.6) (3,820.2) (4,837.9) (5,857.1) As a % ofsales 50.3% 53.0% 55.0% 50.0% 50.0% 50.0% 49.5% 49.0% 48.2% Other operating income 15.7 8.0 116.4 74.3 88.4 84.1 77.2 88.9 97.2 As a % ofsales 0.5% 0.2% 2.9% 1.0% 1.2% 1.1% 1.0% 0.9% 0.8% Distribution costs (268.3) (278.2) (263.5) (483.1) (496.2) (473.8) (463.1) (572.7) (704.8) As a % ofsales 8.7% 8.2% 6.5% 6.5% 6.5% 6.2% 6.0% 5.8% 5.8% Administrative costs (431.7) (553.9) (583.3) (706.1) (702.3) (687.7) (694.6) (918.2) (1,130.1) As a % ofsales 13.9% 16.4% 14.5% 9.5% 9.2% 9.0% 9.0% 9.3% 9.3% Operating Expense (2,260.0) (2,625.1) (3,059.8) (4,905.6) (5,015.3) (4,982.1) (4,977.9) (6,328.8) (7,692.0) Finance costs (263.7) (495.2) (828.3) (880.2) (1,212.7) (1,355.2) (1,526.2) (1,972.2) (2,256.8) Average rate ofinterest 9.9% 9.5% 9.5% 9.5% 9.5% 9.5% 9.5% 9.5% 9.5% Debt schedule Opening balance 1,704.0 2,670.7 5,212.7 8,718.8 11,218.8 12,764.8 14,264.8 16,064.8 20,760.1 Additions 1,565.4 3,574.0 5,705.4 4,454.0 3,500.0 1,500.0 1,800.0 7,500.0 5,800.0 Repayment (598.7) (1,032.0) (2,199.3) (1,954.0) (1,954.0) 0.0 0.0 (2,804.7) (2,804.7) Ending balance 2,670.7 5,212.7 8,718.8 11,218.8 12,764.8 14,264.8 16,064.8 20,760.1 23,755.4 Tax rate 34.1% 43.8% 37.5% 39.4% 38.5% 38.0% 38.0% 37.0% 36.0%
  • 3. Driver Sheet (cont’d) Balance Sheet Drivers(KES Mn) 2008 2009 2010 2011 2012E 2013E 2014E 2015E 2016E Current assets: Inventories 787.1 1,084.3 1,129.9 1,500.0 1,512.1 1,486.4 1,444.4 1,789.4 2,080.4 As a % ofCOGS 50.5% 60.5% 51.1% 40.4% 39.6% 38.9% 37.8% 37.0% 35.5% Inventory days 184.7 220.7 186.4 147.3 145.0 142.0 138.0 135.0 130.0 Trade and other receivables 951.9 1,378.6 1,787.1 1,800.0 1,772.8 1,737.6 1,712.7 2,164.0 2,589.7 As a % ofsales 30.7% 40.7% 44.4% 24.2% 23.2% 22.7% 22.2% 21.9% 21.3% Days receivable 112.4 148.6 162.0 88.4 85.0 83.0 81.0 80.0 78.0 Current liabilities: Trade & other payables 785.7 1,123.8 1,231.4 1,300.0 1,303.6 1,277.0 1,256.0 1,564.0 1,856.3 As a % ofCOGS 50.4% 62.7% 55.6% 35.0% 34.2% 33.4% 32.9% 32.3% 31.7% Days payable 184.3 228.8 203.1 127.7 125.0 122.0 120.0 118.0 116.0 Non-current assets: Property, plant & equipment -Total Opening balance 4,201.9 5,473.8 8,843.2 12,659.8 15,659.8 18,713.2 21,769.7 24,856.8 30,780.8 Additions 1,230.9 2,462.1 3,870.9 3,000.0 3,053.4 3,056.5 3,087.1 5,924.0 4,860.6 Transfers 0.0 0.0 0.0 0.0 0.0 0.0 0.0 0.0 0.0 Disposals (3.4) (4.3) (1.0) 0.0 0.0 0.0 0.0 0.0 0.0 Translation gains/(loss) 44.4 (64.7) (53.4) 0.0 0.0 0.0 0.0 0.0 0.0 Revaluation surplus/(deficit) 0.0 976.4 0.0 0.0 0.0 0.0 0.0 0.0 0.0 Balance at the end ofthe year 5,473.8 8,843.2 12,659.8 15,659.8 18,713.2 21,769.7 24,856.8 30,780.8 35,641.5 Depreciation Opening balance 898.4 1,101.7 155.1 470.5 825.5 1,255.2 1,741.0 2,300.5 2,940.3 Charge for the year 201.9 221.7 315.2 355.0 429.7 485.8 559.5 639.8 763.9 Depreciation rate ( as a % ofaverage gross balance) 4.2% 3.1% 2.9% 2.5% 2.5% 2.4% 2.4% 2.3% 2.3% Translation gain/(loss) 4.8 (0.0) 0.4 0.0 0.0 0.0 0.0 0.0 0.0 Transfers 0.0 0.0 0.0 0.0 0.0 0.0 0.0 0.0 0.0 Write back on revaluation 0.0 (1,163.9) 0.0 0.0 0.0 0.0 0.0 0.0 0.0
  • 4. Driver Sheet (cont’d) Days receivable 112.4 148.6 162.0 88.4 85.0 83.0 81.0 80.0 78.0 Current liabilities: Trade & other payables 785.7 1,123.8 1,231.4 1,300.0 1,303.6 1,277.0 1,256.0 1,564.0 1,856.3 As a % ofCOGS 50.4% 62.7% 55.6% 35.0% 34.2% 33.4% 32.9% 32.3% 31.7% Days payable 184.3 228.8 203.1 127.7 125.0 122.0 120.0 118.0 116.0 Non-current assets: Property, plant & equipment -Total Opening balance 4,201.9 5,473.8 8,843.2 12,659.8 15,659.8 18,713.2 21,769.7 24,856.8 30,780.8 Additions 1,230.9 2,462.1 3,870.9 3,000.0 3,053.4 3,056.5 3,087.1 5,924.0 4,860.6 Transfers 0.0 0.0 0.0 0.0 0.0 0.0 0.0 0.0 0.0 Disposals (3.4) (4.3) (1.0) 0.0 0.0 0.0 0.0 0.0 0.0 Translation gains/(loss) 44.4 (64.7) (53.4) 0.0 0.0 0.0 0.0 0.0 0.0 Revaluation surplus/(deficit) 0.0 976.4 0.0 0.0 0.0 0.0 0.0 0.0 0.0 Balance at the end ofthe year 5,473.8 8,843.2 12,659.8 15,659.8 18,713.2 21,769.7 24,856.8 30,780.8 35,641.5 Depreciation Opening balance 898.4 1,101.7 155.1 470.5 825.5 1,255.2 1,741.0 2,300.5 2,940.3 Charge for the year 201.9 221.7 315.2 355.0 429.7 485.8 559.5 639.8 763.9 Depreciation rate ( as a % ofaverage gross balance) 4.2% 3.1% 2.9% 2.5% 2.5% 2.4% 2.4% 2.3% 2.3% Translation gain/(loss) 4.8 (0.0) 0.4 0.0 0.0 0.0 0.0 0.0 0.0 Transfers 0.0 0.0 0.0 0.0 0.0 0.0 0.0 0.0 0.0 Write back on revaluation 0.0 (1,163.9) 0.0 0.0 0.0 0.0 0.0 0.0 0.0 At the end ofthe year 1,101.7 155.1 470.5 825.5 1,255.2 1,741.0 2,300.5 2,940.3 3,704.2 PPE, net 4,372.1 8,688.2 12,189.3 14,834.3 17,458.0 20,028.7 22,556.3 27,840.5 31,937.2 Balance Sheet Drivers(KES Mn) 2008 2009 2010 2011 2012E 2013E 2014E 2015E 2016E Current assets: Inventories 787.1 1,084.3 1,129.9 1,500.0 1,512.1 1,486.4 1,444.4 1,789.4 2,080.4 As a % ofCOGS 50.5% 60.5% 51.1% 40.4% 39.6% 38.9% 37.8% 37.0% 35.5% Inventory days 184.7 220.7 186.4 147.3 145.0 142.0 138.0 135.0 130.0 Trade and other receivables 951.9 1,378.6 1,787.1 1,800.0 1,772.8 1,737.6 1,712.7 2,164.0 2,589.7 As a % ofsales 30.7% 40.7% 44.4% 24.2% 23.2% 22.7% 22.2% 21.9% 21.3% Days receivable 112.4 148.6 162.0 88.4 85.0 83.0 81.0 80.0 78.0 Current liabilities: Trade & other payables 785.7 1,123.8 1,231.4 1,300.0 1,303.6 1,277.0 1,256.0 1,564.0 1,856.3 As a % ofCOGS 50.4% 62.7% 55.6% 35.0% 34.2% 33.4% 32.9% 32.3% 31.7% Days payable 184.3 228.8 203.1 127.7 125.0 122.0 120.0 118.0 116.0 Non-current assets: Property, plant & equipment -Total Opening balance 4,201.9 5,473.8 8,843.2 12,659.8 15,659.8 18,713.2 21,769.7 24,856.8 30,780.8 Additions 1,230.9 2,462.1 3,870.9 3,000.0 3,053.4 3,056.5 3,087.1 5,924.0 4,860.6 Transfers 0.0 0.0 0.0 0.0 0.0 0.0 0.0 0.0 0.0 Disposals (3.4) (4.3) (1.0) 0.0 0.0 0.0 0.0 0.0 0.0 Translation gains/(loss) 44.4 (64.7) (53.4) 0.0 0.0 0.0 0.0 0.0 0.0 Revaluation surplus/(deficit) 0.0 976.4 0.0 0.0 0.0 0.0 0.0 0.0 0.0 Balance at the end ofthe year 5,473.8 8,843.2 12,659.8 15,659.8 18,713.2 21,769.7 24,856.8 30,780.8 35,641.5 Depreciation Opening balance 898.4 1,101.7 155.1 470.5 825.5 1,255.2 1,741.0 2,300.5 2,940.3 Charge for the year 201.9 221.7 315.2 355.0 429.7 485.8 559.5 639.8 763.9 Depreciation rate ( as a % ofaverage gross balance) 4.2% 3.1% 2.9% 2.5% 2.5% 2.4% 2.4% 2.3% 2.3% Translation gain/(loss) 4.8 (0.0) 0.4 0.0 0.0 0.0 0.0 0.0 0.0 Transfers 0.0 0.0 0.0 0.0 0.0 0.0 0.0 0.0 0.0 Write back on revaluation 0.0 (1,163.9) 0.0 0.0 0.0 0.0 0.0 0.0 0.0
  • 5. Income Statement ABC Cement Company Limited Income Statement (KES Mn) 2008 2009 2010 2011 2012E 2013E 2014E 2015E 2016E Turnover 3,100.0 3,386.0 4,026.0 7,432.7 7,633.6 7,641.2 7,717.6 9,873.4 12,151.6 Cost ofsales (1,560.0) (1,793.0) (2,213.0) (3,716.4) (3,816.8) (3,820.6) (3,820.2) (4,837.9) (5,857.1) Gross profit 1,540.0 1,593.0 1,813.0 3,716.4 3,816.8 3,820.6 3,897.4 5,035.4 6,294.5 Expenses: Other operating income 15.7 8.0 116.4 74.3 88.4 84.1 77.2 88.9 97.2 Distribution costs (268.3) (278.2) (263.5) (483.1) (496.2) (473.8) (463.1) (572.7) (704.8) Administrative expenses (431.7) (553.9) (583.3) (706.1) (702.3) (687.7) (694.6) (918.2) (1,130.1) Operating profit 855.7 768.9 1,082.6 2,601.4 2,706.7 2,743.2 2,816.9 3,633.4 4,556.8 Finance costs (263.7) (76.5) (226.3) (880.2) (1,212.7) (1,355.2) (1,526.2) (1,972.2) (2,256.8) Profit before taxation 592.0 692.4 856.2 1,721.3 1,494.1 1,388.0 1,290.8 1,661.2 2,300.1 Taxation charge (202.0) (302.9) (321.0) (678.0) (575.2) (527.5) (490.5) (614.6) (828.0) Profit for the year 390.0 389.4 535.3 1,043.3 918.9 860.6 800.3 1,046.6 1,472.1 Annualized earnings per share -basic & diluted (KES) 3.94 3.93 5.40 10.53 9.28 8.69 8.08 10.57 14.86 Weighted average number ofshares outstanding (mn) 99.1 99.1 99.1 99.1 99.1 99.1 99.1 99.1 99.1 Operating Profit % 27.6% 22.7% 26.9% 35.0% 35.5% 35.9% 36.5% 36.8% 37.5% EBITDA 1,057.6 990.5 1,397.7 2,956.4 3,136.4 3,229.0 3,376.5 4,273.2 5,320.7
  • 6. Balance Sheet – Assets ABC Cement Company Limited Balance Sheet (KES Mn) 2008 2009 2010 2011 2012E 2013E 2014E 2015E 2016E ASSETS Non current assets: Property, plant and equipment 4,372.1 8,688.2 12,189.3 14,834.3 17,458.0 20,028.7 22,556.3 27,840.5 31,937.2 Operating lease prepayments 33.6 32.1 30.5 30.5 30.5 30.5 30.5 30.5 30.5 Intangible assets 10.9 7.1 54.2 54.2 54.2 54.2 54.2 54.2 54.2 Goodwill 50.9 50.9 50.9 50.9 50.9 50.9 50.9 50.9 50.9 Total non current assets 4,467.5 8,778.3 12,324.8 14,969.8 17,593.6 20,164.3 22,691.9 27,976.0 32,072.8 Current assets: Inventories 787.1 1,084.3 1,129.9 1,500.0 1,512.1 1,486.4 1,444.4 1,789.4 2,080.4 Trade and other receivables 951.9 1,378.6 1,787.1 1,800.0 1,772.8 1,737.6 1,712.7 2,164.0 2,589.7 Due from Employee Share Ownership Plan (ESOP) 83.6 66.8 49.0 49.0 49.0 49.0 49.0 49.0 49.0 Due from related parties 16.2 20.6 61.9 61.9 61.9 61.9 61.9 61.9 61.9 Tax recoverable 0.0 0.0 13.3 13.3 13.3 13.3 13.3 13.3 13.3 Short term Deposits 0.0 0.0 843.0 843.0 843.0 843.0 843.0 843.0 843.0 Cash and bank balances 46.1 812.5 355.9 923.2 782.8 607.2 725.8 695.2 641.4 Total current assets 1,885.0 3,362.7 4,240.1 5,190.4 5,035.0 4,798.4 4,850.1 5,615.8 6,278.7 Total assets 6,352.5 12,141.1 16,564.9 20,160.3 22,628.6 24,962.7 27,541.9 33,591.9 38,351.5
  • 7. Balance Sheet – Liabilities ABC Cement Company Limited Balance Sheet (KES Mn) 2008 2009 2010 2011 2012E 2013E 2014E 2015E 2016E ASSETS Non current assets: Property, plant and equipment 4,372.1 8,688.2 12,189.3 14,834.3 17,458.0 20,028.7 22,556.3 27,840.5 31,937.2 Operating lease prepayments 33.6 32.1 30.5 30.5 30.5 30.5 30.5 30.5 30.5 Intangible assets 10.9 7.1 54.2 54.2 54.2 54.2 54.2 54.2 54.2 Goodwill 50.9 50.9 50.9 50.9 50.9 50.9 50.9 50.9 50.9 Total non current assets 4,467.5 8,778.3 12,324.8 14,969.8 17,593.6 20,164.3 22,691.9 27,976.0 32,072.8 Current assets: Inventories 787.1 1,084.3 1,129.9 1,500.0 1,512.1 1,486.4 1,444.4 1,789.4 2,080.4 Trade and other receivables 951.9 1,378.6 1,787.1 1,800.0 1,772.8 1,737.6 1,712.7 2,164.0 2,589.7 Due from Employee Share Ownership Plan (ESOP) 83.6 66.8 49.0 49.0 49.0 49.0 49.0 49.0 49.0 Due from related parties 16.2 20.6 61.9 61.9 61.9 61.9 61.9 61.9 61.9 Tax recoverable 0.0 0.0 13.3 13.3 13.3 13.3 13.3 13.3 13.3 Short term Deposits 0.0 0.0 843.0 843.0 843.0 843.0 843.0 843.0 843.0 Cash and bank balances 46.1 812.5 355.9 923.2 782.8 607.2 725.8 695.2 641.4 Total current assets 1,885.0 3,362.7 4,240.1 5,190.4 5,035.0 4,798.4 4,850.1 5,615.8 6,278.7 Total assets 6,352.5 12,141.1 16,564.9 20,160.3 22,628.6 24,962.7 27,541.9 33,591.9 38,351.5 EQUITY & LIABILITIES Equity: Share capital 495.3 495.3 495.3 495.3 495.3 495.3 495.3 495.3 495.3 Share premium 302.0 302.0 302.0 302.0 302.0 302.0 302.0 302.0 302.0 Revaluation surplus 35.3 1,531.8 1,465.4 1,465.4 1,465.4 1,465.4 1,465.4 1,465.4 1,465.4 Translation reserve (68.1) (86.8) (99.6) (99.6) (99.6) (99.6) (99.6) (99.6) (99.6) Retained earnings 1,363.0 1,886.7 2,499.1 3,542.4 4,461.2 5,321.8 6,122.1 7,168.7 8,640.7 Equity attributable to equityholders ofthe parent 2,127.5 4,128.9 4,662.2 5,705.5 6,624.3 7,484.9 8,285.2 9,331.7 10,803.8 Non-controlling interest 0.0 0.0 (18.6) (18.6) (18.6) (18.6) (18.6) (18.6) (18.6) Total capital & reserves 2,127.5 4,128.9 4,643.6 5,686.9 6,605.7 7,466.3 8,266.6 9,313.2 10,785.2 Non-current liabilities: Borrowings 1,638.7 3,013.5 6,764.8 9,264.8 12,764.8 14,264.8 13,260.1 17,955.4 20,950.7 Deferred income tax 728.5 1,644.1 1,950.1 1,950.1 1,950.1 1,950.1 1,950.1 1,950.1 1,950.1 Finance leases 14.7 0.8 0.0 0.0 0.0 0.0 0.0 0.0 0.0 Total non-current liabilities 2,382.0 4,658.4 8,714.8 11,214.8 14,714.8 16,214.8 15,210.1 19,905.4 22,900.7 Current liabilities: Borrowings 1,032.0 2,199.3 1,954.0 1,954.0 0.0 0.0 2,804.7 2,804.7 2,804.7 Finance leases 13.8 7.4 1.0 1.0 1.0 1.0 1.0 1.0 1.0 Trade & other payables 785.7 1,123.8 1,231.4 1,300.0 1,303.6 1,277.0 1,256.0 1,564.0 1,856.3 Due to related parties 3.2 6.5 16.5 0.0 0.0 0.0 0.0 0.0 0.0 Unclaimed dividends 3.5 3.6 3.5 3.5 3.5 3.5 3.5 3.5 3.5 Current tax payable 4.7 13.2 0.0 0.0 0.0 0.0 0.0 0.0 0.0 Total current liabilities 1,842.9 3,353.8 3,206.5 3,258.5 1,308.1 1,281.5 4,065.2 4,373.3 4,665.5 Total equity & liabilities 6,352.5 12,141.1 16,564.9 20,160.3 22,628.6 24,962.7 27,541.9 33,591.9 38,351.5
  • 8. Cash Flow Statement ABC Cement Company Limited Cash Flow (KES Mn) 2008 2009 2010 2011 2012E 2013E 2014E 2015E 2016E OPERATING ACTIVITIES Proft before taxation 705.5 948.7 1,113.0 1,721.3 1,494.1 1,388.0 1,290.8 1,661.2 2,300.1 Adjustments: Depreciation 201.9 221.7 315.2 355.0 429.7 485.8 559.5 639.8 763.9 Amortisation ofoperating lease prepayments 0.3 0.3 1.1 0.0 0.0 0.0 0.0 0.0 0.0 Amortisation ofintangible assets 2.4 3.8 3.9 0.0 0.0 0.0 0.0 0.0 0.0 Interest expense charged to statement ofcomprehensive income 154.1 117.8 226.3 880.2 1,212.7 1,355.2 1,526.2 1,972.2 2,256.8 Finance income recognised in statement ofcomprehensive income (0.2) (9.8) 0.0 0.0 0.0 0.0 0.0 0.0 0.0 Net unrealised foreign exchange gains (23.4) (53.5) 53.5 0.0 0.0 0.0 0.0 0.0 0.0 Loss/ (Gain) on disposal ofproperty, plant and equipment (0.8) (0.9) 0.1 0.0 0.0 0.0 0.0 0.0 0.0 Adjusted proft before working capital 1,039.7 1,228.1 1,713.1 2,956.4 3,136.4 3,229.0 3,376.5 4,273.2 5,320.7 (Increase) Decrease in inventories (229.9) (297.2) (45.6) (370.1) (12.1) 25.7 42.0 (345.0) (291.0) (Increase) Decrease in trade and other receivables (542.4) (426.7) (408.5) (12.9) 27.2 35.2 24.9 (451.3) (425.7) Movement due from related party balances (15.4) (1.1) (31.3) (16.5) 0.0 0.0 0.0 0.0 0.0 Increase (Decrease) in trade and other payables 345.0 338.1 107.6 68.6 3.6 (26.5) (21.1) 308.1 292.3 Decrease in due from ESOP 0.0 16.9 17.8 0.0 0.0 0.0 0.0 0.0 0.0 Cash generated from operating activities 597.1 858.1 1,353.1 2,625.5 3,155.0 3,263.5 3,422.3 3,785.0 4,896.3 Interest paid (262.8) (287.2) (502.7) (880.2) (1,212.7) (1,355.2) (1,526.2) (1,972.2) (2,256.8) Interest received 0.2 9.8 0.0 0.0 0.0 0.0 0.0 0.0 0.0 Corporation tax paid (1.7) (21.8) (46.9) (678.0) (575.2) (527.5) (490.5) (614.6) (828.0) Net cash genertaed from operating activities 332.8 558.9 803.6 1,067.3 1,367.1 1,380.8 1,405.7 1,198.1 1,811.5
  • 9. Cash Flow Statement (cont’d) ABC Cement Company Limited Cash Flow (KES Mn) 2008 2009 2010 2011 2012E 2013E 2014E 2015E 2016E OPERATING ACTIVITIES Proft before taxation 705.5 948.7 1,113.0 1,721.3 1,494.1 1,388.0 1,290.8 1,661.2 2,300.1 Adjustments: Depreciation 201.9 221.7 315.2 355.0 429.7 485.8 559.5 639.8 763.9 Amortisation ofoperating lease prepayments 0.3 0.3 1.1 0.0 0.0 0.0 0.0 0.0 0.0 Amortisation ofintangible assets 2.4 3.8 3.9 0.0 0.0 0.0 0.0 0.0 0.0 Interest expense charged to statement ofcomprehensive income 154.1 117.8 226.3 880.2 1,212.7 1,355.2 1,526.2 1,972.2 2,256.8 Finance income recognised in statement ofcomprehensive income (0.2) (9.8) 0.0 0.0 0.0 0.0 0.0 0.0 0.0 Net unrealised foreign exchange gains (23.4) (53.5) 53.5 0.0 0.0 0.0 0.0 0.0 0.0 Loss/ (Gain) on disposal ofproperty, plant and equipment (0.8) (0.9) 0.1 0.0 0.0 0.0 0.0 0.0 0.0 Adjusted proft before working capital 1,039.7 1,228.1 1,713.1 2,956.4 3,136.4 3,229.0 3,376.5 4,273.2 5,320.7 (Increase) Decrease in inventories (229.9) (297.2) (45.6) (370.1) (12.1) 25.7 42.0 (345.0) (291.0) (Increase) Decrease in trade and other receivables (542.4) (426.7) (408.5) (12.9) 27.2 35.2 24.9 (451.3) (425.7) Movement due from related party balances (15.4) (1.1) (31.3) (16.5) 0.0 0.0 0.0 0.0 0.0 Increase (Decrease) in trade and other payables 345.0 338.1 107.6 68.6 3.6 (26.5) (21.1) 308.1 292.3 Decrease in due from ESOP 0.0 16.9 17.8 0.0 0.0 0.0 0.0 0.0 0.0 Cash generated from operating activities 597.1 858.1 1,353.1 2,625.5 3,155.0 3,263.5 3,422.3 3,785.0 4,896.3 Interest paid (262.8) (287.2) (502.7) (880.2) (1,212.7) (1,355.2) (1,526.2) (1,972.2) (2,256.8) Interest received 0.2 9.8 0.0 0.0 0.0 0.0 0.0 0.0 0.0 Corporation tax paid (1.7) (21.8) (46.9) (678.0) (575.2) (527.5) (490.5) (614.6) (828.0) Net cash genertaed from operating activities 332.8 558.9 803.6 1,067.3 1,367.1 1,380.8 1,405.7 1,198.1 1,811.5 INVESTING ACTIVITIES Additions to property, plant and equipment (1,111.5) (2,216.9) (3,618.6) (3,000.0) (3,053.4) (3,056.5) (3,087.1) (5,924.0) (4,860.6) Additions to operating lease prepayments (21.1) 0.0 0.0 0.0 0.0 0.0 0.0 0.0 0.0 Additions to intangible assets (6.8) 0.0 (51.0) 0.0 0.0 0.0 0.0 0.0 0.0 Proceeds ofdisposal ofproperty, plant and equipment 0.8 0.9 0.8 0.0 0.0 0.0 0.0 0.0 0.0 Net cash used in investing activities (1,138.6) (2,216.0) (3,668.8) (3,000.0) (3,053.4) (3,056.5) (3,087.1) (5,924.0) (4,860.6) FINANCING ACTIVITIES Finance lease payments (19.0) (22.4) (7.6) 0.0 0.0 0.0 0.0 0.0 0.0 Purchase ofshares from non-controlling interest (100.2) 0.0 0.0 0.0 0.0 0.0 0.0 0.0 0.0 Borrowings received 1,081.7 2,493.0 4,377.8 4,454.0 3,500.0 1,500.0 1,800.0 7,500.0 5,800.0 Repayment ofamounts borrowed (181.7) (499.1) (1,251.7) (1,954.0) (1,954.0) 0.0 0.0 (2,804.7) (2,804.7) Dividends paid (123.6) (123.8) (148.7) 0.0 0.0 0.0 0.0 0.0 0.0 Net cash used in financing activities 657.2 1,847.7 2,969.8 2,500.0 1,546.0 1,500.0 1,800.0 4,695.3 2,995.3 Increase in cash and cash equivalents (148.7) 190.6 104.6 567.3 (140.4) (175.7) 118.6 (30.6) (53.8) Cash and cash equivalents at the beginning ofthe year 8.5 (137.9) 53.1 134.8 702.1 561.7 386.1 504.7 474.1 Effect oftranslation adjustment on cash held in foreign subsidiaries 2.3 0.4 (23.0) 0.0 0.0 0.0 0.0 0.0 0.0 Cash and cash equivalents at the end ofthe year (137.9) 53.1 134.8 702.1 561.7 386.1 504.7 474.1 420.3 Investments in short-term deposits 0.0 0.0 (843.0) (843.0) (843.0) (843.0) (843.0) (843.0) (843.0) Bank overdraft 184.0 759.4 1,064.1 1,064.1 1,064.1 1,064.1 1,064.1 1,064.1 1,064.1 Cash & bank balances 46.1 812.5 355.9 923.2 782.8 607.2 725.8 695.2 641.4
  • 10. Discounted Cash Flow Valuation (DCF) ABC Cement Company Limited Discounted Cash Flow (KES Mn) 2012E 2013E 2014E 2015E 2016E Terminal Year Assumption: The valuation isdone ason January 1, 2012 Total Revenue 7,633.6 7,641.2 7,717.6 9,873.4 12,151.6 12,151.6 Growth % 2.7% 0.1% 1.0% 27.9% 23.1% EBITDA 3,136.4 3,229.0 3,376.5 4,273.2 5,320.7 5,320.7 EBITDA% 41.1% 42.3% 43.7% 43.3% 43.8% 43.8% EBIT 2,706.7 2,743.2 2,816.9 3,633.4 4,556.8 4,556.8 EBIT % 35.5% 35.9% 36.5% 36.8% 37.5% 37.5% Tax on EBIT 1,042.1 1,042.4 1,070.4 1,344.4 1,640.5 1,640.5 Effective Tax % 38.5% 38.0% 38.0% 37.0% 36.0% 36.0% NOPAT 1,664.6 1,700.8 1,746.5 2,289.0 2,916.4 2,916.4 NOPAT % 21.8% 22.3% 22.6% 23.2% 24.0% 24.0% Depreciation & Amortization 429.7 485.8 559.5 639.8 763.9 763.9 Capex 3,053.4 3,056.5 3,087.1 5,924.0 4,860.6 763.9 Capex % 40.0% 40.0% 40.0% 60.0% 40.0% 6.3% Working Capital Changes 18.6 34.5 45.9 (488.3) (424.4) (424.4) Free Cash Flows to Firm 5,166.3 5,277.5 5,438.9 8,364.6 8,116.5 4,019.7 Growth % 2.2% 3.1% 53.8% -3.0% Years Discounted 0.5 1.5 2.5 3.5 4.5 Discounting Factor 0.9410 0.8333 0.7379 0.6534 0.5786 Discounted Cash Flow 4,861.6 4,397.7 4,013.3 5,465.4 4,696.2 Assumption: The valuation isdone ason January 1, 2012 Valuation Parameters(KES Mn) Other Analysis WACC 12.9% DTV/EV 69.7% Terminal Growth Rate 5.1% Implied Exit EBITDAMultiple 14.5x Terminal FCFF 4,019.7 EV/2012EFCF 15.0x Discounted Terminal Value 53,962.0 Discounted Cash Flow of Forecasted Period 23,434.2 Sensitivity Analysis Enterprise Value 77,396.2 Enterprise Value Sensitivity Debt 11,218.8 Minority Interest 18.6 66,158.8 4.6% 4.9% 5.1% 5.4% 5.6% Equity Value 66,158.8 11.9% 70,101.5 72,269.5 74,596.2 77,099.7 79,801.0 Shares Outstanding (mn) 99.1 12.4% 66,167.3 68,071.4 70,105.4 72,283.0 74,620.1 Market Value per share 667.9 12.9% 62,678.1 64,364.6 66,158.8 68,071.3 70,114.4 13.2% 61,076.4 62,668.1 64,358.3 66,156.5 68,073.2 13.4% 59,559.2 61,064.0 62,659.3 64,353.2 66,155.4 WACC Growth Rate Weighted Average Cost ofCapital Comparableson Nairobi Stock Exhange Levered Beta ARMCement Ltd 0.80 Bamburi Cement Ltd 0.73 E.A.Portland Cement Ltd 0.19 Mean Unlevered Beta 0.50 Weightage 0.50 Industry Beta 1.12 Weightage 0.50 Total Unlevered Beta 0.81 WACC Calculation US Risk Free Rate ofReturn (Rf) 2.6% Kenya Country Risk Premium 6.0% Equity Risk Premium (Rm -Rf) 11.8% Gearing (D/Eq) 1.97 Leverage (D/D+Eq) 0.66 Eq/D+Eq 0.34 Corporate Tax Rate (t) 30.0% 1-t 70.0% Levered Beta 192.0% Ke (Unlevered) 12.2% Ke (Levered) 25.3% Kd 9.5% Kd (1-t) 6.7% WACC 12.9%
  • 11. Ratio Analysis ABC Cement Company Limited Key ratios 2008 2009 2010 2011 2012E 2013E 2014E 2015E 2016E Profitability ratios Gross margin % 49.7% 47.0% 45.0% 50.0% 50.0% 50.0% 50.5% 51.0% 51.8% EBITDAmargin % 34.1% 29.3% 34.7% 39.8% 41.1% 42.3% 43.7% 43.3% 43.8% EBITmargin % 27.6% 22.7% 26.9% 35.0% 35.5% 35.9% 36.5% 36.8% 37.5% Net margin % 12.6% 11.5% 13.3% 14.0% 12.0% 11.3% 10.4% 10.6% 12.1% RoA% 6.1% 4.2% 3.7% 5.7% 4.3% 3.6% 3.0% 3.4% 4.1% RoE% 20.2% 12.4% 12.2% 20.1% 14.9% 12.2% 10.1% 11.9% 14.6% Debt-to-Equity % 125.5% 126.2% 187.0% 196.6% 192.7% 190.6% 193.9% 222.5% 219.9% Dividend yield % 0.2% 0.2% 0.2% 0.0% 0.0% 0.0% 0.0% 0.0% 0.0% Inventory days 184.7 220.7 186.4 147.3 145.0 142.0 138.0 135.0 130.0 Days receivable 112.4 148.6 162.0 88.4 85.0 83.0 81.0 80.0 78.0 Days payable 184.3 228.8 203.1 127.7 125.0 122.0 120.0 118.0 116.0 Cash conversion cycle 112.7 140.6 145.3 108.0 105.0 103.0 99.0 97.0 92.0 Valuation Ratios P/Ex 169.6x 169.9x 123.6x 63.4x 72.0x 76.9x 82.7x 63.2x 44.9x P/S x 21.3x 19.5x 16.4x 8.9x 8.7x 8.7x 8.6x 6.7x 5.4x P/BV x 31.1x 16.0x 14.2x 11.6x 10.0x 8.8x 8.0x 7.1x 6.1x Per share Ratios EPS (KES) 3.9 3.9 5.4 10.5 9.3 8.7 8.1 10.6 14.9 Sales per share (KES) 31.3 34.2 40.6 75.0 77.1 77.1 77.9 99.7 122.7 DPS (KES) 1.2 1.2 1.5 0.0 0.0 0.0 0.0 0.0 0.0 BVPS (KES) 21.5 41.7 47.1 57.6 66.9 75.6 83.6 94.2 109.1 Dupont Analysis Net margin 12.6% 11.5% 13.3% 14.0% 12.0% 11.3% 10.4% 10.6% 12.1% Asset Turnover 48.8% 27.9% 24.3% 36.9% 33.7% 30.6% 28.0% 29.4% 31.7% Financial leverage 3.0 2.9 3.6 3.5 3.4 3.3 3.3 3.6 3.5 RoE 18.3% 9.4% 11.5% 18.3% 13.9% 11.5% 9.7% 11.2% 13.6%