NKU SpB 305 - Reds mkt segments
•
1 j'aime•295 vues

The Reds want to increase fan involvement from African American and Hispanic markets. Survey data found the main deterrent for these groups attending games is high ticket prices. Recommendations include promoting lower ticket prices, bundling tickets with food packages, and hosting heritage nights celebrating ethnic cultures with traditional foods and uniforms honoring the Negro Leagues.

Recommandé
Recommandé
Contenu connexe
Plus de Joe Cobbs
Plus de Joe Cobbs (20)
Dernier
Dernier (20)
NKU SpB 305 - Reds mkt segments
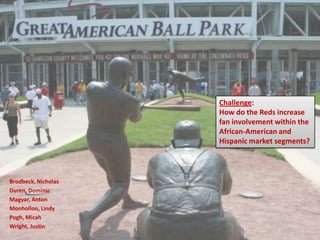
- 1. Challenge: How do the Reds increase fan involvement within the African-American and Hispanic market segments? Brodbeck, Nicholas Duren, Dominic Magyar, Anton Monhollon, Lindy Pugh, Micah Wright, Justin
- 2. Census Data • Hamilton County – Population (2010): 802,374 • White: 68.8% • African American: 25.7% • Hispanic: 2.6% • Boone County – Population (2010): 118,811 • White: 91.8% • African American: 2.5% • Hispanic: 3.5% • Kenton County – Population (2010): 159,720 • White: 91.0% • African American: 4.6% • Hispanic: 2.6% • Campbell County – Population (2010): 91,336 • White: 94.3% • African American: 2.5% • Hispanic: 1.7%
- 3. Demographics • Per U.S. Census data • The estimated Black/African American population in Cincinnati is 142,176, which is 42.9 percent of the total population in town (The U.S. average is 12.30%). • Hispanic Population The Hispanic population in the Cincinnati community was 4,230, or 1.3 percent of the total population (compared to the national average of 12.50% percent).
- 4. Survey Data – African American Games Attended Frequency Percent 0 Games 31 66.0 1-3 Games 11 23.4 4-9 Games 3 6.4 10-20 Games 2 4.3 Total 47 100.0
- 5. Why African-Americans Do Not Attend Games: Cost of Ticket Cost of the Ticket Frequency Percent Not at all Influential 12 25.5% Little Influence 7 14.9% Somewhat Influential 7 14.9% Very Influential 13 27.7% Extremely Influential 8 17% Total 47 100%
- 6. Why African-Americans Do Not Attend Games: Lack of Interest in Team Lack of Interest in Team Frequency Percent Not at all Influential 9 19.1 Little Influence 7 14.9 Somewhat Influential 15 31.9 Very Influential 10 21.3 Extremely Influential 6 12.8 Total 47 100
- 7. Why Hispanics Do Not Attend Games: Cost of Ticket Cost of the Ticket Frequency Percent Not at all Influential 3 13.6% Little Influence 0 0 Somewhat Influential 6 27.3% Very Influential 6 27.3% Extremely Influential 7 31.8% Total 22 100%
- 8. Why Hispanics Do Not Attend Games: No one to go with No one to go with Frequency Percent Not at all Influential 6 27.3 Little Influence 4 18.2 Somewhat Influential 7 31.8 Very Influential 5 22.7 Extremely Influential 0 0 Total 22 100
- 9. Statistical Significance between African-Americans and Hispanics To determine Statistical Significance (α≤ 0.05) between our two groups • The decision to attend a game based on identifying as a fan • Attending a Reds Baseball Game on a Summer Friday Night • Importance of In-Game Promotions to Overall Experience* • Decision to Not Attend more Reds Games: Cost of Ticket* • Decision to Not Attend more Reds Games: Lack of interest in team • (*): These two were found to be marginally significant as (α≤ 0.10)
- 10. Decision To Attend a Game Based on Identifying as a Fan
- 11. Attending a Reds Baseball Game on a Summer Friday Night
- 12. Importance of In-Game Promotions to Overall Experience
- 13. Decision to Not Attend more Reds Games: Cost of Ticket
- 14. Decision to Not Attend More Reds Games: Lack of Interest in Team
- 15. Recommendations • Our research shows that promoting lower ticket prices should increase the amount of African- Americans and Hispanics that attend Cincinnati Reds home games.
- 16. Recommendations • Another option is to include a meal into the ticket price, for example when buying tickets for a family of four your ticket would include 4 hotdogs, 4 popcorns, 4 drinks, 2 beers, and a small souvenir. Giving attendees a great incentive to attend home games.
- 17. Recommendations • Baseball cards featuring fan favorites cards to every kid under 12 look into local business sponsorship to lower cost to the Reds. • Below is the Descriptive Statistics for the decision to attend a Reds Game-Giveaway Item 95% Interval for Confidence Mean N Mean Std. Dev. Std. Error Lower Upper Min Max Bound Bound African- 16 3.00 1.461 .365 2.22 3.78 1 5 American Hispanic 14 3.50 1.160 .310 2.83 4.17 1 5 Total 30 3.23 1.331 .243 2.74 3.73 1 5
- 18. Recommendations • “Support Your Heritage Night” with a ticket promotion and traditional foods. • Below is the Descriptive Statistics for the “Interest in Ethnic Heritage Reds Game.” 95% Interval Confidence For Mean N Mean Std. Dev. Std. Error Lower 95% Upper Min Max 95% African- 46 3.22 1.365 .201 2.81 3.62 1 5 American Hispanic 21 2.90 1.179 .257 2.37 3.44 1 5 Total 67 3.12 1.309 .160 2.80 3.44 1 5
- 19. Recommendations • Similar to last year, Negro League throwback uniforms, but with more promotion and related products. This is something that the Milwaukee Brewers currently do.
- 20. Recommendations • Partner with Underground Railroad Freedom Center to do a game similar to the Civil Rights game • 2007 Memphis, TN - St. Louis Cardinals Cleveland Indians 12,815* • 2008 Memphis, TN - New York Mets Chicago White Sox 7,717* • 2009 Cincinnati, OH - Cincinnati Reds Chicago White Sox 42,234 • 2010 Cincinnati, OH - Cincinnati Reds St. Louis Cardinals 41,326 • 2011 Atlanta, GA - Atlanta Braves Philadelphia Phillies 42,117 • (*) 2007 and 2008 games were played at AutoZone Park (Triple-A Stadium of the Memphis Redbirds)
- 21. Conclusion • Based off findings from our surveys, the main deterrent for African Americans and Hispanics attending games is the price of tickets; our suggestions to better entice these segments are: – Focus promotions on low ticket prices – Ticket packages – Sponsorship on baseball cards – Ticket promotions and traditional foods on heritage night. – Negro League throwbacks – Game similar to Civil Rights game