ICT Role in 21st Century Education & its Challenges.pptx
WMS Report Card 2009-2010
1. IRN # 064196
Westfall Middle School
19545 Pherson Pike, Williamsport, OH 43164-9745 - Grades 6-8 - Pickaway County
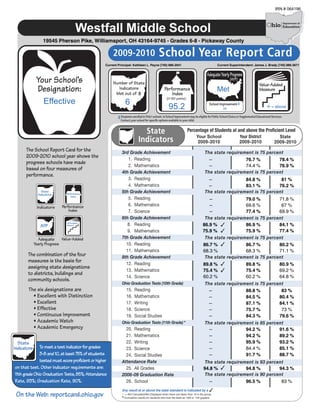
2009-2010 School Year Report Card
Current Principal: Kathleen L. Payne (740) 986-2941 Current Superintendent: James J. Brady (740) 986-3671
Your School’s Number of State Value-Added
Designation: Indicators
Met out of 8
Performance Met Measure
Index
Effective 6
(0-120 points)
95.2 School Improvement ‡
OK
+ = above
‡ Students enrolled infor speci c options available to your child. be eligible for Public School Choice or Supplemental Educational Services.
Contact your school
Title I schools in School Improvement may
State Percentage of Students at and above the Proficient Level
Your School Your District State
Indicators 2009-2010 2009-2010 2009-2010
The School Report Card for the 3rd Grade Achievement The state requirement is 75 percent
2009-2010 school year shows the 1. Reading -- 76.7 % 78.4 %
progress schools have made
2. Mathematics -- 74.4 % 76.9 %
based on four measures of
4th Grade Achievement The state requirement is 75 percent
performance.
3. Reading -- 84.8 % 81 %
4. Mathematics -- 83.1 % 76.2 %
State
Performance
5th Grade Achievement The state requirement is 75 percent
Indicators
Index
5. Reading -- 79.0 % 71.8 %
Indicators Performance 6. Mathematics -- 69.6 % 67 %
Index 7. Science -- 77.4 % 69.9 %
6th Grade Achievement The state requirement is 75 percent
AYP
Value-Added
Measure 8. Reading 86.9 % 86.9 % 84.1 %
9. Mathematics 75.9 % 75.9 % 77.4 %
Adequate Value-Added 7th Grade Achievement The state requirement is 75 percent
Yearly Progress 10. Reading 86.7 % 86.7 % 80.2 %
11. Mathematics 68.3 % 68.3 % 71.1 %
The combination of the four 8th Grade Achievement The state requirement is 75 percent
measures is the basis for 12. Reading 89.8 % 89.8 % 80.9 %
assigning state designations
13. Mathematics 75.4 % 75.4 % 69.2 %
to districts, buildings and
14. Science 60.2 % 60.2 % 64.8 %
community schools.
Ohio Graduation Tests (10th Grade) The state requirement is 75 percent
The six designations are 15. Reading -- 88.8 % 83 %
• Excellent with Distinction 16. Mathematics -- 84.5 % 80.4 %
• Excellent 17. Writing -- 87.1 % 84.1 %
• Effective 18. Science -- 75.7 % 73 %
• Continuous Improvement
Ohio Graduation Tests (11th Grade) *
19. Social Studies -- 84.3 % 79.6 %
• Academic Watch The state requirement is 85 percent
• Academic Emergency 20. Reading -- 94.2 % 91.6 %
21. Mathematics -- 94.2 % 89.2 %
State 22. Writing -- 95.9 % 93.2 %
Indicators To meet a test indicator for grades 23. Science -- 84.4 % 85.1 %
3-8 and 10, at least 75% of students 24. Social Studies -- 91.7 % 88.7 %
tested must score proficient or higher Attendance Rate The state requirement is 93 percent
on that test. Other indicator requirements are: 25. All Grades 94.8 % 94.8 % 94.3 %
11th grade Ohio Graduation Tests, 85%; Attendance 2008-09 Graduation Rate The state requirement is 90 percent
Rate, 93%; Graduation Rate, 90%. 26. School -- 96.5 % 83 %
Any result at or above the state standard is indicated by a .
*
-- = Not Calculated/Not Displayed when there are fewer than 10 in the group.
On the Web: reportcard.ohio.gov Cumulative results for students who took the tests as 10th or 11th graders.
2. 2
Your School’s Assessment Results Over Time
All students in the school for a full academic year are included in the results.
6th Grade Achievement 7th Grade Achievement
100% 100%
State Standard - 75%
State Standard - 75%
75% -------------------------------- 75% --------------------------------
50% 50%
25% 82.1 81.8 86.9 78.9 67.8 75.9 25% 85.2 77.0 86.7 79.1 84.4 68.3
0% 0%
07-08 08-09 09-10 07-08 08-09 09-10 07-08 08-09 09-10 07-08 08-09 09-10
Reading Mathematics Reading Mathematics
8th Grade Achievement
100%
State Standard - 75%
75% ------------------------------------------------------
50%
25% 79.1 80.5 89.8 77.6 82.8 75.4 65.2 61.7 60.2
0%
07-08 08-09 09-10 07-08 08-09 09-10 07-08 08-09 09-10
Reading Mathematics Science
State
Indicators
The State
Indicators are
based on state
assessments, as well
as on attendance and
graduation rates.
To earn an indicator
for Achievement or
Graduation Tests, at
least 75% of students
must reach proficient
or above for the given
assessment.
For the 11th grade Ohio
Graduation Tests indicators,
a cumulative 85% passage
rate for each assessment
is required. *Cumulative results for students who took the tests as 10th or 11th graders.
Westfall Middle School, Pickaway County
3. 3
Performance Index
The Performance
Performance Index Calculations Index reflects the
Performance
for the 2009-2010 School Year Index achievement of every student
enrolled for the fullacademic
Performance Level Across Grades year. The Performance Index is a
3-8 and 10 for all Tested Subjects weighted average that includes all
(Includes every student enrolled in
Percentage X Weight = Points
the school for a full academic year) tested subjects and grades and
untested students. The greatest
Untested 0.0 X 0.0 = 0.0
weight is given to advanced scores
4.1 0.3 = (1.2); the weights decrease for each
Limited X 1.2
performance level and a weight of
Basic 18.1 X 0.6 = 10.8 zero is given to untested students.
This results in a scale from 0 to 120
Proficient 38.3 X 1.0 = 38.3 points. The Performance Index can be
Accelerated 25.8 X 1.1 = compared across years to show
28.4
school achievement trends.
Advanced 13.7 X 1.2 = 16.4 Performance Index Over Time
Performance Index Over Time
2009-2010 2008-2009 2007-2008
Your School’s Performance Index 95.2
95.2 92.8 95.0
Value-Added Measure
Overall Composite
+ Scores reflect grade level and overall composite
ratings for the 2009-2010 school year.
Grade 4 Grade 5 Grade 6 Grade 7 Grade 8
Reading
+ +
Value-Added
Measure
Mathematics
- +
Note: Value-Added results are computed only for buildings that include students in grades 4 through 8.
Legend
+
Value-Added Your school’s Value-Added rating represents the progress your
Measure
school has made with its students since last school year. = Above
-
Expected Growth
In contrast, achievement scores represent students’ performance at a
point in time. A score of “Above” indicates greater than one year of = Met
Expected Growth
progress has been achieved; “Met”results are computed only for buildings
Value-Added indicates one year of progress has been
achieved; “Below” indicates less than one year of progress has been achieved. = Below
Value-Added results areinclude students in grades 4through 8.
that computed only for buildings that include sufficient Expected Growth
testing data for students in any grade 4 through 8.
On the Web: reportcard.ohio.gov
On the Web: reportcard.ohio.gov Westfall Middle School, Pickaway County
4. 4
Adequate Yearly Progress (AYP)
e
Adequate Yearly ed a tiv
aN s
Progress tag k itie ien
t
an de
r
las il fic
sa
dv n nic /A an
ic s ab
Pr
o
i sla isp
a n Di
Grades 3-8 and 10
yD cI ia isp ith lis
h
nt
s ll ifi -H Ind ial -H ng
Reading
de ca ac on n ac no
n sw dE
tu mi /P ,n ica an
ic
i-R e, nt
ite AYP Determination
and lS on
o
ia n
la ck er sp lt it ude
Mathematics Al Ec As B Am Hi Mu Wh St Lim by Indicator
Percent Proficient
Reading
Reading Met Met NR NR NR NR NR Met Met NR Proficiency: Met
Mathematics
Mathematics Met Met NR NR NR NR NR Met Met NR Proficiency: Met
Percent Tested
Reading Met Met NR NR NR NR NR Met Met NR Reading
Reading Met
Participation:
Participation:
Mathematics
Mathematics Met Met NR NR NR NR NR Met Met NR Participation:
Met
Graduation
Graduation Rate* N/A Rate: N/A
Attendance
Attendance Rate* Met Rate: Met
AYP Determination AYP
by Subgroup Met Met NR NR NR NR NR Met Met NR Determination Met
for Your School:
Legend
This legend explains terms used in the above chart that describe whether each student group met this yearʼs AYP goals.
For test indicators, AYP can be met in one of four ways: For non-test indicators, AYP can be met in one of three ways:
1) meeting the AYP targets with current year results; 1) meeting the AYP targets with current year results;
2) meeting the AYP targets with two-year combined results; 2) meeting the AYP targets with two-year combined results;
3) meeting the improvement requirements of Safe Harbor; 3) making improvement over the previous year.
* Theevaluatedindicatorsthe All for overallsubgroup.
4) meeting the AYP targets with projected results. non-test used AYP (Attendance Rate and Graduation Rate)
are only for Students
N/A Not applicable.
Not Required – This indicator was not evaluated for this subgroup because the subgroup size was smaller than the minimum number needed to achieve a statisti-
NR cally reliable result. 30 students is the minimum size for the proficiency and non-test indicators, while 40 is the minimum size for the participation rate indicators.
Met This subgroup met AYP for this indicator with its current year, two-year combined, Safe Harbor, or growth measure results.
Not Met This subgroup did not meet AYP for this indicator.
Adequate Yearly Progress (AYP) is a federally required measure. Every school
and district must meet AYP goals that are set for Reading and Mathematics 2008-2009
Proficiency and Participation, Attendance Rate, and Graduation
Rate. These goals are applied to ten student groups: All Students, Graduation Rate Information
AYP Economically Disadvantaged Students, Asian/Pacific Islander
Students, Black, non-Hispanic Students, American Indian/Alaska American Indian/ Asian or Black, Econ.
Native Students, Hispanic Students, Multi-Racial Students, White, Alaska Native Pacific Islander non-Hispanic Disadvtgd
non-Hispanic Students, Students with Disabilities (IEP), and Students with -- -- -- --
Limited English Proficiency (LEP). If any one of these groups does not meet
Limited English Students with White,
AYP in Reading or Mathematics Proficiency, or in Participation, Attendance Hispanic Proficient Multi-Racial Disabilities non-Hispanic
Rate, or Graduation Rate, then the school or district does not meet AYP.
Not meeting AYP for consecutive years will have both federal and state
-- -- -- -- --
consequences. Federal consequences could include a school or district being The disaggregated graduation rates of your school are provided for
identified for improvement. State consequences could include a reduction
informational purposes only and are not used for your AYP determination.
in the state’s rating designation.
Westfall Middle School, Pickaway County
5. 5
State and Federally Required School Information
Your School's Percentage of Students at Each Performance Level
American Asian or Non- Students Non- Limited
Black, Multi- White, Econ. English
Indian/ Pacific Hispanic Disabled with Migrant Econ. Female Male
non-Hispanic Racial non-Hispanic Disadvtgd Proficient
Alaska Native Islander Students Disabilities Disadvtgd
Percentage of Students Scoring Limited
Reading -- -- -- -- -- 2.7 2.1 7.0 -- 0.8 6.0 -- 1.5 3.9
Writing -- -- -- -- -- -- -- -- -- -- -- -- -- --
Mathematics -- -- -- -- -- 5.7 3.9 18.6 -- 3.3 9.8 -- 4.1 7.3
Science -- -- -- -- -- 4.3 3.9 6.7 -- 3.7 5.4 -- 4.4 4.0
Social Studies -- -- -- -- -- -- -- -- -- -- -- -- -- --
Percentage of Students Scoring Basic
Reading -- -- -- -- -- 9.7 6.9 30.2 -- 6.6 15.0 -- 8.1 11.2
Writing -- -- -- -- -- -- -- -- -- -- -- -- -- --
Mathematics -- -- -- -- -- 20.8 19.5 32.6 -- 15.6 30.8 -- 19.3 22.9
Science -- -- -- -- -- 33.9 34.0 46.7 -- 25.9 56.8 -- 35.3 36.0
Social Studies -- -- -- -- -- -- -- -- -- -- -- -- -- --
Percentage of Students Scoring Proficient
Reading -- -- -- -- -- 41.9 41.9 41.9 -- 38.4 48.1 -- 42.6 41.0
Writing -- -- -- -- -- -- -- -- -- -- -- -- -- --
Mathematics -- -- -- -- -- 37.7 39.9 20.9 -- 39.9 33.8 -- 42.1 33.0
Science -- -- -- -- -- 29.6 30.1 20.0 -- 30.9 24.3 -- 30.9 26.0
Social Studies -- -- -- -- -- -- -- -- -- -- -- -- -- --
Percentage of Students Scoring Accelerated
Reading -- -- -- -- -- 30.3 31.9 18.6 -- 34.3 23.3 -- 30.5 30.3
Writing -- -- -- -- -- -- -- -- -- -- -- -- -- --
Mathematics -- -- -- -- -- 24.5 25.2 16.3 -- 27.2 18.8 -- 25.4 22.9
Science -- -- -- -- -- 16.5 15.5 20.0 -- 19.8 8.1 -- 11.8 22.0
Social Studies -- -- -- -- -- -- -- -- -- -- -- -- -- --
Percentage of Students Scoring Advanced
Reading -- -- -- -- -- 15.4 17.2 2.3 -- 19.8 7.5 -- 17.3 13.5
Writing -- -- -- -- -- -- -- -- -- -- -- -- -- --
Mathematics -- -- -- -- -- 11.3 11.4 11.6 -- 14.0 6.8 -- 9.1 14.0
Science -- -- -- -- -- 15.7 16.5 6.7 -- 19.8 5.4 -- 17.6 12.0
Social Studies -- -- -- -- -- -- -- -- -- -- -- -- -- --
Your School’s Students 2009-2010
Average Daily Black, American Asian or White, Limited Students
Economically
Student non- Indian or Pacific Hispanic Multi-Racial non- Disadvantaged English with Migrant
Enrollment Hispanic Alaska Native Islander Hispanic Proficient Disabilities
390 -- -- -- -- -- 98.4% 36.9% -- 11.6% --
-- = Not Calculated/Not Displayed when there are fewer than 10 in the group.
Number of Limited English Proficient Students
Excluded from Accountability Calculations --
Under the federal
No Child Left Behind
Act, states are Federally Required School Teacher Information
required to report
Your Building’s Poverty Status*: Medium-Low Poverty
certain data about Your Building District
schools and teachers. Percentage of teachers with at least a Bachelor’s Degree 100.0 100.0
Data presented here
are for reporting Percentage of teachers with at least a Master’s Degree 81.8 68.4
purposes only and
Percentage of core academic subject elementary and secondary classes
are not used in the not taught by highly qualified teachers 0.0 0.7
computation of the Percentage of core academic subject elementary and secondary classes
state designation taught by properly certified teachers 100.0 99.8
for districts and Percentage of core academic subject elementary and secondary classes taught by
schools. teachers with temporary, conditional or long-term substitute certification/licensure 0.0 0.0
*High-poverty schools are those ranked in the top quartile based on the percentage of economically disadvantaged students. Low-poverty schools are those ranked in the bottom quartile based on the percentage of economically disadvantaged students.
-- = Not Calculated/Not Displayed when there are fewer than 10 in the group.
Westfall Middle School, Pickaway County
6. 6
Determining Your School's Designation
Determining your school’s report card designation is a multi-step process. The first step is to determine a preliminary designation,
which is based on the following components: 1) the percentage of indicators met, 2) the performance index and 3) AYP determination.
Indicators Met Performance Index AYP Designation Preliminary Designation
94%-100% or 100 to 120 and Met or Not Met = Excellent
75%-93.9% or 90 to 99.9 and Met or Not Met = Effective
0%-74.9% or 0 to 89.9 and Met = Continuous
50%-74.9% or Not Met = Improvement
80 to 89.9 and
31%-49.9% or 70 to 79.9 and Not Met = Academic Watch
0%-30.9% and 0 to 69.9 and Not Met = Academic Emergency
The preliminary designation results from identifying the Once the preliminary designation is determined, Value-Added,
higher value between the percentage of indicators met by the fourth measure in the accountability system, is evaluated
your school and your school’s performance index. to determine the impact (if any) on the school’s final
AYP then is evaluated to determine its effect on the designation.
preliminary designation. There are three ways in which
AYP can affect the preliminary designation. 1. If your school’s designation is restricted to Continuous
Improvement due to AYP, Value-Added has no impact
1. If a school meets AYP in the current year, it can be on the designation and the preliminary designation
rated no lower than Continuous Improvement. becomes the final designation.
2. If a school does not meet AYP for three consecutive 2. If your school experiences above expected growth for at
years and in the current year it does not meet AYP in least two consecutive years, your school’s final
more than one student group, it can be rated no designation will increase by one designation.
higher than Continuous Improvement.
3. If your school experiences below expected growth for at
3. In all other cases, AYP has no effect on the least three consecutive years, your school’s final
preliminary designation. designation will decrease by one designation.
Preliminary Designation Value-Added Measure* Final Designation
Above expected growth for at least 2 consecutive years Excellent with Distinction
Excellent and or
Below expected growth for at least 3 consecutive years Effective
Above expected growth for at least 2 consecutive years Excellent
Effective and or
Below expected growth for at least 3 consecutive years Continuous Improvement
Above expected growth for at least 2 consecutive years Effective
Continuous Improvement and or
Below expected growth for at least 3 consecutive years Academic Watch
Above expected growth for at least 2 consecutive years Continuous Improvement
Academic Watch and or
Below expected growth for at least 3 consecutive years Academic Emergency
Above expected growth for at least 2 consecutive years Academic Watch
Academic Emergency and or
Below expected growth for at least 3 consecutive years Academic Emergency
*In all other cases, including if your school’s designation has been restricted to Continuous Improvement, then Value-Added will have
no impact on the designation and the preliminary designation becomes the final designation.
Westfall Middle School, Pickaway County
7. 7
The National Assessment of Educational Progress (NAEP),
often referred to as “The Nation’s Report Card,” is the only nationally representative and continuing
assessment that enables the comparision of performance in Ohio and other states in various
subject areas. Schools and students within each state are selected randomly to be a part of the
assessment. Not all students in the state or in a particular school take the assessment. Data
are reported at the state level only, and there are no individual student or even school summary
results. The assessments are conducted in mathematics, reading, science, writing, the arts,
civics, economics, geography and U.S. history.
To view Ohio’s most recent
NAEP results, go to:
http://education.ohio.gov
and search for key word “NAEP”
Westfall Middle School, Pickaway County