This is the presentation Michael Skipper, Executive Director of the Metropolitan Planning Office, delivered to the Transit Citizen Leadership Academy of Septemb
Explore beautiful and ugly buildings. Mathematics helps us create beautiful d...
Revised skipper presentation
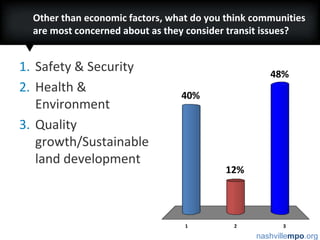
1. Other than economic factors, what do you think communities are most concerned about as they consider transit issues? Safety & Security Health & Environment Quality growth/Sustainable land development
2. Planning for the Future with Mass Transit Middle Tennessee Transit Academy September 14, 2011
3. What percentage of employees across the 10-county area commute to another county to work? 10% 25% 33% 66%
10. Development Pattern, 1965-2035 2035 2,600,000 (In 2035, the Nashville region will be about the size of the Denver region today) 2000 1,450,000 1965 750,000 Population Properties affected by development
11. Market and Policy Driven Forecasting Environmental Constraints Land Use Policy Suitability Analysis Growth Policy
13. Increasing Diversity Household Composition Census for 1960 and 2000, 2025 adapted from Martha Farnsworth Riche, How Changes in the Nation’s Age and Household Structure Will Reshape Housing Demand in the 21st Century, HUD, 2003.
15. Resiliency in Urban Congestion 2035 w/ Short-Term Improvements 2035 After Long-Term Improvements TODAY Congestion in Urban Areas Cannot Be Treated with Roadway Capacity Alone. Daily Recurring Congestion on Major Roadways.
16. How much does traffic congestion cost the region annually in wasted fuel and lost time? $200 million to $300 million $300 million to $400 million $400 million to $500 million $500 million to $600 million More than $600 million
17. Texas Transportation Institute (TTI) Urban Mobility Report, 2009 Nashville-Davidson Urbanized Area Cost of Congestion (wasted fuel and time): $ 426 Million, Annually $ 10.65 Billion, over next 25 years
20. What percentage of Middle Tennessee households spend 20% or more of their income on transportation costs? Less than 30% 30% to 50% 50% to 70% 70% to 90% More than 90%
21. On average, Americans spend about 18% of their Household Income on Transportation- Related Expenses Source: Center for Neighborhood Technology Housing + Transportation Affordability Index (http://www.htaindex.org/)
23. I have no choice but to drive as much as I do. Strongly agree Strongly disagree
24. I would like to spend less time in my car. Strongly agree Strongly disagree
25. No Other Options than Driving (National telephone survey of 800 registered voters: 700 landline interviews & 100 cell phone interviews.)
26. Transit a Preferred Solution (National telephone survey of 800 registered voters: 700 landline interviews & 100 cell phone interviews.)
27. U.S. DOT Responding to Public Demand “I have traveled all over this country…and everywhere I go, people want better options. Options that offer reduced greenhouse-gas emissions. Options that offer reduced fuel-consumption. Options that offer better health. Options that bring communities together. Now, let me make this absolutely clear: I never said we would stop repairing, maintaining, and –yes–even expanding roadways. I said only that it's time tostop assuming that putting more cars on more roads is the best way to move people around more effectively.” – U.S. DOT Secretary Ray LaHood
28. Middle TN Public Opinions Middle Tennessee residents are most satisfied with: the maintenance of roadways in their area (63%) overall levels of roadway congestion in their area (54%) Middle Tennessee residents are least satisfied with: how walkable their community is (49%) how safe it is to ride a bicycle in their community (42%) availability of mass transit services in their area (29%), with lack of transit options considered the greatest problem in Middle TN, followed by lack of walking & bicycling options. Of several issues mentioned, the most important to solve was to provide alternatives to driving.
29. Of these three strategies for improving transportation, which do you feel is most important? Improve and expand mass transit options Make communities more walkable and bike friendly Build or widen existing roadways
30. MPO Area Public Opinions Three strategies provided for improving transportation in Middle Tennessee; respondents then asked to prioritize– 1st choice: improve and expand mass transit options 2nd choice: make communities more walkable & bike-friendly 3rd choice: build new or widen existing roadways
32. #1A Bold, New Vision for Mass Transit #2Support for Active Transportation & Walkable Communities #3Preservation & Enhancement of Strategic Roadways
34. WHY MASS TRANSIT? Traffic Congestion, Energy Costs, Environmental Burden Changing Demographics & Market Demand Quality of Life & Economic Development Tool
38. A Bold, New Vision for Mass Transit Clarksville Springfield Gallatin FUTURE REGIONAL CORRIDOR SERVICE Lebanon Nashville Dickson FUTURE LOCAL TRANSIT SERVICE Franklin Murfreesboro Columbia
48. 13 Potential Station Sites Gallatin Harris Big Station Camp Indian Lake New Shackle Island Saundersville Conference Drive Center Point Old Hickory Dickerson/ Skyline Trinity Cleveland Street Music City Central
49.
50. Will be driven by policy decisions (focusing high density regional employment and residential opportunities) more than land use decisions.Station Context: Urban Downtown Center, Regional employment destination
77. The 2035 Plan Provides: A bold, new vision for mass transit to communicate the region's intentions for the long-term; Funding for upcoming corridor and circulator studies to layout more specific strategies to implement the vision; A call to re-organize the existing RTA to take advantage of new legislation; A call to establish dedicated funding for transit to improve operational capacity of existing agencies and to help build the vision; $950 million in federal transit funds for the continued maintenance and modest expansion of urban transit, ridesharing, and vanpool services; $30 million for continued support for the JARC and New Freedom programs; 10% of future U-STP for transit projects.
83. What do other things cost? 2030 Regional Plan adopted in 2005 = $3.5 B Annual Payroll for NFL Players = $3.6 B Central Texas Turnpike around Austin = $3.6 B San Francisco/Oakland Bridge Replacement = $6.3 B Denver FasTracks System = $6.9 B Las Vegas City Center (mixed-use) = $11 B Big Dig (Boston) = $14.6 B TTI Cost of Congestion for Nashville Metro between now and 2035 = $15+ B
84. Funding/ Financing Issues 2035 Plan estimated to provide approx $4.9 B Federal The cost of NEEDS/ VISION is at least triple the anticipated revenues Lack of dedicated funding for transit to ensure stability and to compete for federal transit funds Sprawling land development pattern creates unsustainable demand for infrastructure Declining fuel tax revenues and buying power means fewer projects, slower progress, less benefit
88. Thinking Beyond the Gas Tax… Public Private Partnerships Tolling & Congestion Pricing Distance-Based User Fees Multi-Modal District Impact Fees New Dedicated Funding for Mass Transit Align Current Dollars with Real Priorities Invest Now to Save Later Build More Sustainable Communities