SlideShare une entreprise Scribd logo
1  sur  28
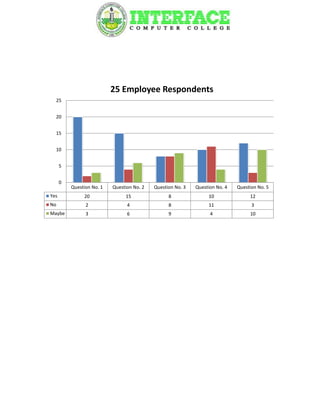
25 Employee Respondents
  25


  20


  15


  10


      5


      0
          Question No. 1   Question No. 2   Question No. 3   Question No. 4   Question No. 5
Yes            20               15                8               10               12
No              2                4                8               11                3
Maybe           3                6                9                4               10
Tally/Frequency percentage

Question No. 1                    Question No. 2                Question No. 3
  Yes       No   Maybe               Yes   No   Maybe              Yes   No     Maybe

      12%
                                    24%
 8%                                                              36%              32%


                                  16%             60%
                 80%
                                                                          32%


                 Question No. 4                 Question No. 5
                    Yes      No   Maybe            Yes     No   Maybe

                       16%

                                    40%         40%
                                                                   48%


                   44%
                                                         12%
30
                    25 Client/Customer Respondents
  25

  20

  15

  10

      5

      0
          Question No. 1   Question No. 2   Question No. 3   Question No. 4   Question No. 5
Yes            24               15                3                9               15
No              0                1               17               15                1
Maybe           1                9                5                1                9
Tally/Frequency percentage

Question No. 1                    Question No. 2                  Question No. 3
     Yes   No    Maybe              Yes       No   Maybe            Yes    No    Maybe
0%
       11%                                                                      12%
                                                                    20%
                                  36%


                                                     60%
                                   4%
                89%                                                             68%


                  Question No. 4                    Question No. 5
                       Yes   No    Maybe               Yes   No    Maybe
                             4%


                                        36%          36%


                                                                     60%
                      60%
                                                       4%
50 respondents (Employee and Client/Customer)
  50
  45
  40
  35
  30
  25
  20
  15
  10
   5
   0
        Question No. 1   Question No. 2   Question No. 3   Question No. 4   Question No. 5
Yes          44               30               11               19               27
No            2                5               25               26                4
Maybe         4               15               14                5               19
Tally/Frequency percentage

Question No. 1                  Question No. 2                Question No. 3
  Yes   No   Maybe                 Yes   No   Maybe              Yes   No     Maybe

  4% 8%
                                                                              22%
                                 30%                           28%


                                                60%
                                 10%
             88%                                                            50%


             Question No. 4                   Question No. 5
                   Yes     No   Maybe            Yes     No   Maybe

                         10%

                                  38%         38%


                                                                 54%
               52%
                                                    8%
Formula:


R=No. of respondent   R=?

N=No. of people       N=100

e=Margin of error     e=10 %( 0.1)
Formula:


                     50 respondents from Employee & Client/Customer

QUESTION NO.1

           Yes                           No                           Maybe


           Classes   Tally/Frequency                            Degree     p)
                                                   f)
            Yes             44                   88                   316.8
            No               2                    4                    14.4
           Maybe             4                    8                    28.8
                     R= 50 respondent           100                      =360
QUESTION NO.2


      Yes                           No             Maybe


       Classes   Tally/Frequency                Degree   p)
                                           f)
        Yes             30                60       216
        No               5                10        36
       Maybe            15                30       108
                 R= 50 respondent        100         =360
QUESTION NO.3


       Yes                          No              Maybe


       Classes   Tally/Frequency                Degree   p)
                                           f)
        Yes             11                22       79.2
        No              25                50       180
       Maybe            14                28      100.8
                 R= 50 respondent        100         =360
QUESTION NO.4


       Yes                          No              Maybe


       Classes   Tally/Frequency                Degree   p)
                                           f)
        Yes             19                38      136.8
        No              26                52      187.2
       Maybe             5                10       36
                 R= 50 respondent        100        =360
QUESTION NO.5


       Yes                          No               Maybe


       Classes   Tally/Frequency                 Degree   p)
                                            f)
        Yes             27                54       194.4
        No               4                 8        28.8
       Maybe            19                38       136.8
                 R= 50 respondent        100          =360
25 respondents from Employee

QUESTION NO.1


       Yes                            No                     Maybe


       Classes   Tally/Frequency                         Degree   p)
                                               f)
        Yes             20                   80             288
        No               2                    8             28.8
       Maybe             3                   12             43.2
                 R= 25 respondent           100               =360
QUESTION NO.2


       Yes                          No              Maybe


       Classes   Tally/Frequency                Degree   p)
                                           f)
        Yes             15                60       216
        No               4                16       57.6
       Maybe             6                24       86.4
                 R= 25 respondent        100         =360
QUESTION NO.3


       Yes                          No              Maybe


       Classes   Tally/Frequency                Degree   p)
                                           f)
        Yes              8                32      115.2
        No               8                32      115.2
       Maybe             9                36      129.6
                 R= 25 respondent        100        =360
QUESTION NO.4


       Yes                          No              Maybe


       Classes   Tally/Frequency                Degree   p)
                                           f)
        Yes             10                40       144
        No              11                44      158.4
       Maybe             4                16       57.6
                 R= 25 respondent        100         =360
QUESTION NO.5


       Yes                          No              Maybe


       Classes   Tally/Frequency                Degree   p)
                                           f)
        Yes             12                48      172.8
        No               3                12       43.2
       Maybe            10                40       144
                 R= 25 respondent        100         =360
25 respondents from Client/Customer


QUESTION NO.1


       Yes                            No                           Maybe


       Classes   Tally/Frequency                               Degree   p)
                                               f)
        Yes
        No
       Maybe
                 R= 25 respondent           100                     =360
QUESTION NO.2


       Yes                          No              Maybe


       Classes   Tally/Frequency                Degree   p)
                                           f)
        Yes
        No
       Maybe
                 R= 25 respondent        100         =360
QUESTION NO.3


       Yes                          No              Maybe


       Classes   Tally/Frequency                Degree   p)
                                           f)
        Yes              3
        No              17
       Maybe             5
                 R= 25 respondent        100         =360
QUESTION NO.4


       Yes                          No              Maybe


       Classes   Tally/Frequency                Degree   p)
                                           f)
        Yes              9
        No              15
       Maybe             1
                 R= 25 respondent        100         =360
QUESTION NO.5


       Yes                          No              Maybe


       Classes   Tally/Frequency                Degree   p)
                                           f)
        Yes             15
        No               1
       Maybe             9
                 R= 25 respondent        100         =360
Formula used:


ITS= Individual Total Score

A= Number of persons who mark Yes

B= Number of persons who mark No

C= Number of persons who mark Maybe

X= Total number of respondents


                       50 respondents (Employee and Client/Customer)


                                   = 4.84 Yes


                                   = 4.5 Yes
= 3.72 No


= 3.86 No


= 4.46 Yes
25 respondents (Employee)


  = 4.72 Yes


  = 4.44 Yes


  = 4.00 Yes
= 3.96 No


= 4.36 Yes
25 respondents (Client/Customer)


     = 4.96 Yes


     = 4.56 Yes


     = 3.44 No
= 3.76 No


               = 4.56 Yes


Scale Table


   SCALE
   INTERPRETATION

   5.00-4.00      Yes
   3.99-2.51      No
   2.50-1.00      Maybe
Contenu connexe

En vedette (11)

серебряный век
серебряный вексеребряный век
серебряный век
 
Magazine research q kerrang nme
Magazine research q kerrang nmeMagazine research q kerrang nme
Magazine research q kerrang nme
 
Cd design
Cd designCd design
Cd design
 
5 Critical Challenges & 5 Compelling Opportunities for ATM ISOs and IADs
5 Critical Challenges & 5 Compelling Opportunities for ATM ISOs and IADs5 Critical Challenges & 5 Compelling Opportunities for ATM ISOs and IADs
5 Critical Challenges & 5 Compelling Opportunities for ATM ISOs and IADs
 
Ai report
Ai reportAi report
Ai report
 
Proyecto gira 4_b
Proyecto gira 4_bProyecto gira 4_b
Proyecto gira 4_b
 
Chapter1
Chapter1Chapter1
Chapter1
 
Natco
NatcoNatco
Natco
 
Proyecto musica de_terror3
Proyecto musica de_terror3Proyecto musica de_terror3
Proyecto musica de_terror3
 
Powertrain Codes DTC list
Powertrain Codes DTC listPowertrain Codes DTC list
Powertrain Codes DTC list
 
Storm Anatomy
Storm AnatomyStorm Anatomy
Storm Anatomy
 

Dernier

Salient Features of India constitution especially power and functions
Salient Features of India constitution especially power and functionsSalient Features of India constitution especially power and functions
Salient Features of India constitution especially power and functions
KarakKing
 
Vishram Singh - Textbook of Anatomy Upper Limb and Thorax.. Volume 1 (1).pdf
Vishram Singh - Textbook of Anatomy  Upper Limb and Thorax.. Volume 1 (1).pdfVishram Singh - Textbook of Anatomy  Upper Limb and Thorax.. Volume 1 (1).pdf
Vishram Singh - Textbook of Anatomy Upper Limb and Thorax.. Volume 1 (1).pdf
ssuserdda66b
 
1029-Danh muc Sach Giao Khoa khoi 6.pdf
1029-Danh muc Sach Giao Khoa khoi  6.pdf1029-Danh muc Sach Giao Khoa khoi  6.pdf
1029-Danh muc Sach Giao Khoa khoi 6.pdf
QucHHunhnh
 
Activity 01 - Artificial Culture (1).pdf
Activity 01 - Artificial Culture (1).pdfActivity 01 - Artificial Culture (1).pdf
Activity 01 - Artificial Culture (1).pdf
ciinovamais
 

Dernier (20)

ICT role in 21st century education and it's challenges.
ICT role in 21st century education and it's challenges.ICT role in 21st century education and it's challenges.
ICT role in 21st century education and it's challenges.
 
Unit-IV- Pharma. Marketing Channels.pptx
Unit-IV- Pharma. Marketing Channels.pptxUnit-IV- Pharma. Marketing Channels.pptx
Unit-IV- Pharma. Marketing Channels.pptx
 
How to Give a Domain for a Field in Odoo 17
How to Give a Domain for a Field in Odoo 17How to Give a Domain for a Field in Odoo 17
How to Give a Domain for a Field in Odoo 17
 
TỔNG ÔN TẬP THI VÀO LỚP 10 MÔN TIẾNG ANH NĂM HỌC 2023 - 2024 CÓ ĐÁP ÁN (NGỮ Â...
TỔNG ÔN TẬP THI VÀO LỚP 10 MÔN TIẾNG ANH NĂM HỌC 2023 - 2024 CÓ ĐÁP ÁN (NGỮ Â...TỔNG ÔN TẬP THI VÀO LỚP 10 MÔN TIẾNG ANH NĂM HỌC 2023 - 2024 CÓ ĐÁP ÁN (NGỮ Â...
TỔNG ÔN TẬP THI VÀO LỚP 10 MÔN TIẾNG ANH NĂM HỌC 2023 - 2024 CÓ ĐÁP ÁN (NGỮ Â...
 
Salient Features of India constitution especially power and functions
Salient Features of India constitution especially power and functionsSalient Features of India constitution especially power and functions
Salient Features of India constitution especially power and functions
 
Towards a code of practice for AI in AT.pptx
Towards a code of practice for AI in AT.pptxTowards a code of practice for AI in AT.pptx
Towards a code of practice for AI in AT.pptx
 
Unit-V; Pricing (Pharma Marketing Management).pptx
Unit-V; Pricing (Pharma Marketing Management).pptxUnit-V; Pricing (Pharma Marketing Management).pptx
Unit-V; Pricing (Pharma Marketing Management).pptx
 
This PowerPoint helps students to consider the concept of infinity.
This PowerPoint helps students to consider the concept of infinity.This PowerPoint helps students to consider the concept of infinity.
This PowerPoint helps students to consider the concept of infinity.
 
Explore beautiful and ugly buildings. Mathematics helps us create beautiful d...
Explore beautiful and ugly buildings. Mathematics helps us create beautiful d...Explore beautiful and ugly buildings. Mathematics helps us create beautiful d...
Explore beautiful and ugly buildings. Mathematics helps us create beautiful d...
 
Understanding Accommodations and Modifications
Understanding  Accommodations and ModificationsUnderstanding  Accommodations and Modifications
Understanding Accommodations and Modifications
 
Sociology 101 Demonstration of Learning Exhibit
Sociology 101 Demonstration of Learning ExhibitSociology 101 Demonstration of Learning Exhibit
Sociology 101 Demonstration of Learning Exhibit
 
Introduction to Nonprofit Accounting: The Basics
Introduction to Nonprofit Accounting: The BasicsIntroduction to Nonprofit Accounting: The Basics
Introduction to Nonprofit Accounting: The Basics
 
How to Create and Manage Wizard in Odoo 17
How to Create and Manage Wizard in Odoo 17How to Create and Manage Wizard in Odoo 17
How to Create and Manage Wizard in Odoo 17
 
Application orientated numerical on hev.ppt
Application orientated numerical on hev.pptApplication orientated numerical on hev.ppt
Application orientated numerical on hev.ppt
 
Vishram Singh - Textbook of Anatomy Upper Limb and Thorax.. Volume 1 (1).pdf
Vishram Singh - Textbook of Anatomy  Upper Limb and Thorax.. Volume 1 (1).pdfVishram Singh - Textbook of Anatomy  Upper Limb and Thorax.. Volume 1 (1).pdf
Vishram Singh - Textbook of Anatomy Upper Limb and Thorax.. Volume 1 (1).pdf
 
1029-Danh muc Sach Giao Khoa khoi 6.pdf
1029-Danh muc Sach Giao Khoa khoi  6.pdf1029-Danh muc Sach Giao Khoa khoi  6.pdf
1029-Danh muc Sach Giao Khoa khoi 6.pdf
 
HMCS Max Bernays Pre-Deployment Brief (May 2024).pptx
HMCS Max Bernays Pre-Deployment Brief (May 2024).pptxHMCS Max Bernays Pre-Deployment Brief (May 2024).pptx
HMCS Max Bernays Pre-Deployment Brief (May 2024).pptx
 
Activity 01 - Artificial Culture (1).pdf
Activity 01 - Artificial Culture (1).pdfActivity 01 - Artificial Culture (1).pdf
Activity 01 - Artificial Culture (1).pdf
 
Key note speaker Neum_Admir Softic_ENG.pdf
Key note speaker Neum_Admir Softic_ENG.pdfKey note speaker Neum_Admir Softic_ENG.pdf
Key note speaker Neum_Admir Softic_ENG.pdf
 
Unit-IV; Professional Sales Representative (PSR).pptx
Unit-IV; Professional Sales Representative (PSR).pptxUnit-IV; Professional Sales Representative (PSR).pptx
Unit-IV; Professional Sales Representative (PSR).pptx
 

Tallys

  • 1. 25 Employee Respondents 25 20 15 10 5 0 Question No. 1 Question No. 2 Question No. 3 Question No. 4 Question No. 5 Yes 20 15 8 10 12 No 2 4 8 11 3 Maybe 3 6 9 4 10
  • 2. Tally/Frequency percentage Question No. 1 Question No. 2 Question No. 3 Yes No Maybe Yes No Maybe Yes No Maybe 12% 24% 8% 36% 32% 16% 60% 80% 32% Question No. 4 Question No. 5 Yes No Maybe Yes No Maybe 16% 40% 40% 48% 44% 12%
  • 3. 30 25 Client/Customer Respondents 25 20 15 10 5 0 Question No. 1 Question No. 2 Question No. 3 Question No. 4 Question No. 5 Yes 24 15 3 9 15 No 0 1 17 15 1 Maybe 1 9 5 1 9
  • 4. Tally/Frequency percentage Question No. 1 Question No. 2 Question No. 3 Yes No Maybe Yes No Maybe Yes No Maybe 0% 11% 12% 20% 36% 60% 4% 89% 68% Question No. 4 Question No. 5 Yes No Maybe Yes No Maybe 4% 36% 36% 60% 60% 4%
  • 5. 50 respondents (Employee and Client/Customer) 50 45 40 35 30 25 20 15 10 5 0 Question No. 1 Question No. 2 Question No. 3 Question No. 4 Question No. 5 Yes 44 30 11 19 27 No 2 5 25 26 4 Maybe 4 15 14 5 19
  • 6. Tally/Frequency percentage Question No. 1 Question No. 2 Question No. 3 Yes No Maybe Yes No Maybe Yes No Maybe 4% 8% 22% 30% 28% 60% 10% 88% 50% Question No. 4 Question No. 5 Yes No Maybe Yes No Maybe 10% 38% 38% 54% 52% 8%
  • 7. Formula: R=No. of respondent R=? N=No. of people N=100 e=Margin of error e=10 %( 0.1)
  • 8. Formula: 50 respondents from Employee & Client/Customer QUESTION NO.1 Yes No Maybe Classes Tally/Frequency Degree p) f) Yes 44 88 316.8 No 2 4 14.4 Maybe 4 8 28.8 R= 50 respondent 100 =360
  • 9. QUESTION NO.2 Yes No Maybe Classes Tally/Frequency Degree p) f) Yes 30 60 216 No 5 10 36 Maybe 15 30 108 R= 50 respondent 100 =360
  • 10. QUESTION NO.3 Yes No Maybe Classes Tally/Frequency Degree p) f) Yes 11 22 79.2 No 25 50 180 Maybe 14 28 100.8 R= 50 respondent 100 =360
  • 11. QUESTION NO.4 Yes No Maybe Classes Tally/Frequency Degree p) f) Yes 19 38 136.8 No 26 52 187.2 Maybe 5 10 36 R= 50 respondent 100 =360
  • 12. QUESTION NO.5 Yes No Maybe Classes Tally/Frequency Degree p) f) Yes 27 54 194.4 No 4 8 28.8 Maybe 19 38 136.8 R= 50 respondent 100 =360
  • 13. 25 respondents from Employee QUESTION NO.1 Yes No Maybe Classes Tally/Frequency Degree p) f) Yes 20 80 288 No 2 8 28.8 Maybe 3 12 43.2 R= 25 respondent 100 =360
  • 14. QUESTION NO.2 Yes No Maybe Classes Tally/Frequency Degree p) f) Yes 15 60 216 No 4 16 57.6 Maybe 6 24 86.4 R= 25 respondent 100 =360
  • 15. QUESTION NO.3 Yes No Maybe Classes Tally/Frequency Degree p) f) Yes 8 32 115.2 No 8 32 115.2 Maybe 9 36 129.6 R= 25 respondent 100 =360
  • 16. QUESTION NO.4 Yes No Maybe Classes Tally/Frequency Degree p) f) Yes 10 40 144 No 11 44 158.4 Maybe 4 16 57.6 R= 25 respondent 100 =360
  • 17. QUESTION NO.5 Yes No Maybe Classes Tally/Frequency Degree p) f) Yes 12 48 172.8 No 3 12 43.2 Maybe 10 40 144 R= 25 respondent 100 =360
  • 18. 25 respondents from Client/Customer QUESTION NO.1 Yes No Maybe Classes Tally/Frequency Degree p) f) Yes No Maybe R= 25 respondent 100 =360
  • 19. QUESTION NO.2 Yes No Maybe Classes Tally/Frequency Degree p) f) Yes No Maybe R= 25 respondent 100 =360
  • 20. QUESTION NO.3 Yes No Maybe Classes Tally/Frequency Degree p) f) Yes 3 No 17 Maybe 5 R= 25 respondent 100 =360
  • 21. QUESTION NO.4 Yes No Maybe Classes Tally/Frequency Degree p) f) Yes 9 No 15 Maybe 1 R= 25 respondent 100 =360
  • 22. QUESTION NO.5 Yes No Maybe Classes Tally/Frequency Degree p) f) Yes 15 No 1 Maybe 9 R= 25 respondent 100 =360
  • 23. Formula used: ITS= Individual Total Score A= Number of persons who mark Yes B= Number of persons who mark No C= Number of persons who mark Maybe X= Total number of respondents 50 respondents (Employee and Client/Customer) = 4.84 Yes = 4.5 Yes
  • 24. = 3.72 No = 3.86 No = 4.46 Yes
  • 25. 25 respondents (Employee) = 4.72 Yes = 4.44 Yes = 4.00 Yes
  • 26. = 3.96 No = 4.36 Yes
  • 27. 25 respondents (Client/Customer) = 4.96 Yes = 4.56 Yes = 3.44 No
  • 28. = 3.76 No = 4.56 Yes Scale Table SCALE INTERPRETATION 5.00-4.00 Yes 3.99-2.51 No 2.50-1.00 Maybe