Data Management Open House
•
2 j'aime•2,572 vues

data management, information, data, scholarly communication, research, science, publication, peer review, alt metrics

Recommandé
Contenu connexe
Tendances
Tendances (20)
Similaire à Data Management Open House
Similaire à Data Management Open House (20)
Plus de Jackie Wirz, PhD
Plus de Jackie Wirz, PhD (20)
Dernier
Dernier (20)
Data Management Open House
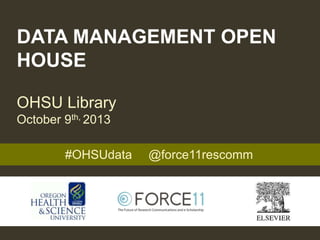
- 1. DATA MANAGEMENT OPEN HOUSE OHSU Library October 9th, 2013 #OHSUdata @force11rescomm
- 2. 0 | Introductions 1 | Scientific Communication 2 | Making it work for you 3 | Your impact 4 | Hands On 5 | Making it matter
- 4. Melissa Haendel Ontology Development Group and DMICE Nicole Vasilevsky Ontology Development Group Jackie Wirz Research Specialist, Research Roadmap SOM Robin Champieux Scholarly Communication
- 6. Who is FORCE11? Publishers Library and Information scientists Policy makers Tool builders Funders Scholars Social Science Humanities Science Free to join!
- 7. Beyond-the-PDF San Diego, Jan 2011 | Amsterdam, March 2013 www.force11.org/beyondthepdf2 | #btpdf2
- 8. How does OHSU fit in? We won 1K to find out. Today | Discuss data-research cycle, reproducibility, and communication of findings Later | Data playground with researchers: Your data needs Identify the material and services you need Get paid $50
- 9. 1 | Scientific Communication
- 10. Once upon a time…. Research, Present, Publish. Repeat.
- 12. You might say it wears a uniform
- 13. Our relationship is so one-sided.
- 14. From Paper to Tweet
- 16. New Modes & Models
- 19. asdf Data can be pretty complex…
- 20. Data does not speak for itself…
- 21. You speak for your data
- 22. You need to manage it
- 23. But, even more fundamentally…
- 24. what does data mean to you?
- 31. asdf
- 32. asdf
- 33. You speak for your data
- 34. How do you speak for your data when you are not around?
- 35. Do you know what metadata is? a. Philosophy b. describes data c. dating site d. data
- 38. - Anne Gilliland Your metadata should make your data understandable to others… without your involvement Metadata Metadata Metadata Metadata Metadata Metadata Metadata Metadata Metadata Metadata Metadata Metadata Metadata Metadata Metadata Metadata
- 42. 2 | Making it work for you
- 44. Biomed Res Int. 2013;2013:350419.
- 46. A Solution: Antibody Registry The Antibody Registry www.antibodyregistry.org
- 47. Data standards can help with reproducibility Average of ~50% of resources were not identifiable Vasilevsky et al., 2013 PeerJ 1:e148 www.force11.org/node/4463 biosharing.org/bsg-000532
- 48. Data Analysis Pipeline Reproducibility Platforms RESOURCES www.wf4ever-project.org runmycode.org galaxyproject.org/
- 49. Are you aware of data standards in your field? @OHSU, 72% said no or didn’t know!
- 50. Data standards are the rules by which data are described and recorded. In order to share, exchange, and understand data, we must standardize the format as well as the meaning. www.usgs.gov/datamanagement/plan/datastandards.php Data Standards
- 51. Types of data standards Reporting guidelines Terminology Artifacts (includes ontologies) Exchange Formats Can be used together
- 53. Many microarray transcriptomics standards JAMIA:sea-of-standards
- 54. www.cdisc.org RESOURCES Minimum Information for Biological and Biomedical Investigations biosharing.org/
- 55. But it isn’t just about reproducibility… It’s about
- 57. Ontologies as a tool for unification Disease- Phenotype databases Disease phenotype ontology Expression data Gene function data Cell and tissue ontology GO annotations ontologies
- 58. For example, there are many useful ways to classify organism parts: its parts and their arrangement its relation to other structures what is it: part of; connected to; adjacent to, overlapping? its shape its function its developmental origins its species or clade its evolutionary history Cajal 1915, “Accept the view that nothing in nature is useless, even from the human point of view.” Ontologies classify data in multiple ways http://www.boloncol.com/images/stories/boletin19/cajal16.jpg
- 59. Human Disease: PFEIFFER SYNDROME Most similar mouse model: CD1.Cg-Fgfr2tm4Lni/H shortened head MP:0000435 malocclusion MP:0000120 ocular hypertelorism MP:0001300 short maxilla MP:0000097 Brachyturricephaly HP:0000244 Hypoplasia of the maxilla HP:0000327 Dental crowding HP:0000678 Hypertelorism HP:0000316 Coronal craniosynostosis HP:0004440 premature suture closure maxilla hypoplasia malocclusion shortened head ocular hypertelorism premature suture closure MP:0000081 Cross-species Phenotype Ontologies aid candidate gene identification for undiagnosed diseases
- 61. How can I make my data reusable? There are tools to help!
- 62. Tools for research management RESOURCES www.labguru.com www.labarchives.com
- 63. Data management plan tool RESOURCES https://dmp.cdlib.org/
- 64. What to do with data? Storage Versioning Publication Back up in multiple locations: Local hard drive Removable storage Shared Network Cloud server File name versioning Dropbox Version control software CVS SVN Git Data sharing repositories: Local repository Domain specific Generic public repository
- 65. Computing in the cloud
- 66. Uniquely identifying data Document Object Identifier (DOI) Unique resource identifier (URI) www.flickr.com/photos/pmeimon
- 67. v figshare.com datadryad.org thedata.org n2t.net/ezid www.dataone.org data.rutgers.edu/ Data journals and repositories RESOURCES nature.com/scientificdata/
- 68. 3 | Your impact
- 70. Thinking Beyond the PDF Raw Science Small publications Self-publishing Datasets Code Experimental design Argument or passage Blogging Microblogging Comments & Reviews Annotations Single figure publications Nanopublications
- 71. Who are you?
- 72. Impact.Story impactstory.org www.plumanalytics.com orcid.org RESOURCES Services to identify yourself and your impact
- 75. Citing products of your research
- 76. 4 | Hands On
- 77. What is your scientific footprint?
- 78. 5 | Making it Matter
- 79. Legitimate, citable products of research Same importance as traditional citations Data management is central Data
- 82. Thank you!
Notes de l'éditeur
- MH introduce
- MH: Introduce
- JW
- MH: introduce everyone
- MH: A grass roots effort to accelerate the pace and nature of scholarly communications and e-scholarship through technology, education, and community Why 11? We were born in 2011
- MH: Force11 is comprised of a diversity of participants to best aid in the redefinition of scholarly communication
- MH: (Un)conference where stakeholders came together as equals to discuss issues Incubator for change What would you do to change scholarly communication if you had $1K? M. Haendel award winner
- MH-why we are here today, and how all of you can help. JW: put the slide 2 here perhaps? This still has too much text; slide 2 is much less intimidating.
- JW
- RC: The traditional model of scientific communication is fairly straightforward. Sucessful research is shared via presentations and papers, after data is collected and analyzed.
- RC: This model is slow, even when considred within the context of electronic journals. A recent study clocked the average timeframe from submission to to publication for biomedical journals at over 9 months: http://www.openaccesspublishing.org/2013/09/06/the-publishing-delay-in-scholarly-peer-reviewed-journals/.
- RC: The traditional model is also very formalized in respect to when in the research cycle the science is shared (well after the study has taken place), how it is disseminated (peer-reviewed articles), to whom one is communicating (most often scientists in your specialized field) and how impact is measured (citation counts to articles).
- RC: Finally, it is unilateral in that it doesn’t faciliate dynamic, real-time, interaction between scientists outside of the society meeting or conference. Nor does it further coversation between scientists and the public.
- The Internet has had a profound affect on science and scientific communication, wherein the traditional model I just described is being reimainged, ulitmately in the perusuit of advancing the scientific process. But the traditional model of scholarly communication stills dominates how many scientists manage and share their research and data.
- RC: Volume of literature has exploded since the first online journals were launched in the late 1980’s. Today, virtually all science journals are online. There are over 28,000 active peer reviewed journals, publishing nearly 2 million articles per year, with a new paper is published every 20 seconds. This is a huge industry, with revenues of about 10 billion/year. 50% of new research is freely available online either immediately or within 12 months of publication. But the other 50% lives behind high paywalls. Limiting the scope of science available to potential readers (human and compter; scientists and the public). Infographic: http://www.sciencemag.org/site/special/scicomm/infographic.jpg
- RC: We have also seen a proliferation of new publishing modes and models. This includes a variety of open access publishers and journals with new peer-review models such as open and post-publication peer-reivew. And, new economic models, wherein authors, funders, and libraries are sharing the cost of publication. New modes include but are not limited to self-publication and social media, such as science blogs and twitter, and data sharing via public repositories.
- Communication is also occurring at more points across the research cycle. For instance, ideas are shared and developed via on-line conversations on blogs and Twitter. Code and data are being released as they are built and recorded via open lab notebooks. This activity compliments and feeds the traditional products of research – papers and presentations.
- RC: However, if scientists don’t thoughtfully and actively manage their research products in this new system, the advantages are minimized and all this new stuff becomes noise.
- Data. Complex…
- JW
- JW
- JW
- JW
- JW: this is raw crystallography data, collected at OHSU. This is visual, high resolution, data
- The image then gets integrated along the spots, transforming the image into a series of mathematical values
- The “model’ we are used to seeing is actually a mathematical representation of how well a model (the sticks) fits into the mathematical distillation of the raw image. This looks static, but is actually a best representaiton along one axis of the data (which is to say, confidence levels). Crystallography boils down to solving the “phase problem”, which can be done two ways: brute force (holy hell!), and by using an exisitng model as a jumping off point. This is the fastest and most efficient way of solving off structures, and is, in fact, what I did to solve this structure. I got the previously published data from pdb.org, which is also where I deposited my data. The point of this is three fold: 1) data comes in many shapes and forms, 2) data transforms, and 3) data helps inform more data.
- JW: this is raw crystallography data, collected at OHSU. This is visual, high resolution, data
- Ask them to think about what type of data they deal with/generate. Give a couple minutes.
- Ask if they have additional data types that they brainstormed JW: yes, need this slide if we are to cover the examples listed later. Also, we are eventually getting to alt metrics, which means the third quadrant; therefore, important to cover here.
- Data. Complex…
- Data. Complex…
- JW
- JW
- ! Add metadata not only to your experimental results, but also your process during research, such as resources, protocols, etc. Ways to apply metadata to every moving part of your research
- JW: this is raw crystallography data, collected at OHSU. This is visual, high resolution, data
- JW: this is raw crystallography data, collected at OHSU. This is visual, high resolution, data
- JW: this is raw crystallography data, collected at OHSU. This is visual, high resolution, data
- JW
- NV-The literature was the place we would go to find information to get protocols, information about techniques, find resources/reagents Assuming you got to your relevant paper- look at the methods section, is there enough info there for you to be able to reuse/reproduce the info/experiment/technique?
- NV- For example, if you look in the materials and methods section for an antibody used in a western blot, oftentimes the name is reported, along with the vendor and vendor’s location Say here that the authors met the journal standards, but that they really aren’t sufficient.
- NV However, there are several antibodies generated against one target, so how do you know which one works in this assay? Need to report catalog numbers…
- NV - Alternatively, report the AR ID Permanent identifier, stays with the Ab, even as it changes vendors or catalog #’s change. Similar to genbank for antibodies. Most resources can be reported more specifically than publisher guidelines, which are not intended to support reproducibility.
- NV: An area with poor data standards shows poor reproducibility. Here we showed how irrereproducible many studies were simply due to lack of specificity in the resources used in the experiments. We therefore developed guidelines that are now in place to support resource reporting, and these are now in effect in a number of journals, with more to come. OHSU participates in the Reproducibility Initiative, aimed at developing policies and tools to aid scientific reproducibility. Some bioinformatics tools to aid reproducibility are Workflow4Ever and RunMyCode.org. Outcomes from data standards: Reproducibility and data reuse Place urls in separate document, not on slide www.scienceexchange.com/reproducibility www.wf4ever-project.org runmycode.org
- Bioinformatics workflow standards such as Workflow 4Ever and Run my code have been developed to help with standardization and sharing of scientific workflows and code. Workflow 4 ever Run my code is a repository where people can share or reuse code that is associated with scientific publications. For data manipulations, here is an example of tools that can help with reproducibility.
- MH: Yes 28.0% , No 26.9% , I don't know 45.1% 175 answered question
- MH Put URL in supporting document. Too distracting here. http://www.usgs.gov/datamanagement/plan/datastandards.php
- MH: each type serves a different purpose: Reporting guidelines serve to ensure that a minimum of metadata is reported, so that someone else can know what your data is about. Terminology artifacts allow some of the data to be structured for reuse and interoperability. Think of these as interoperability handles. Exchange formats provide the syntax for the data structure, and further enable data integration and mashup.
- MH: each type serves a different purpose: Reporting guidelines serve to ensure that a minimum of metadata is reported, so that someone else can know what your data is about. Terminology artifacts allow some of the data to be structured for reuse and interoperability. Think of these as interoperability handles. Exchange formats provide the syntax for the data structure, and further enable data integration and mashup.
- MH: which one to use? Need a solution to help identify the right standard, contribute to and/or extend existing ones to best support community reproducibility and reuse
- MH –Both of these resources provide a survey of data standards of all three types – Reporting Guidelines Terminology Artifacts (includes ontologies) Exchange Formats Biosharing has a biology focus, CDISC is a clinical focus There are others, these are just two resources. Take away- there are different standards, no standard meets everyone’s need.
- NV: this is transition back to melissa
- MH: Reusing data is not as easy as dumpster diving. You don’t always know that a coke can or a keyboard key can be a critical data element. JW: Oh. My. God.
- MH: Slide from Chris Mungall Ontologies provide the handle by which data from different databases and of different types can be linked and integrated for maximal biological knowledge Do we need this slide? JW: Maybe not IN the deck, but at the back. If soembody asks what an ontology is during the Q&A, we can bring it up. I did this all the time for my seminars – always have extra slides at the back end for potential questions.
- MH: ontologies, unlike a file system, allow data to be classified in many different ways using logic and standardized identifiers
- MH: When data is encoded using ontologies, it can allow mashup in novel ways. Here, we are using clinical phenotype data and comparing it with model organism phenotype data to identify candidate genes for undiagnosed human diseases. JW: Please let me clean up the original image. The pixilated borders are driving me nuts, and the human head has some white pixels that can very easily and quickly be cleaned up!
- MH: those pesky data sharing mandates, what are they really for? Does dumping my data into a data repository with no metadata or use of standards really help? Answer- no it doesn’t. If you want your data to be a first class citizen as a scholarly product that can be cited and actually be reused, then you need to go a bit further. Need to add links to policies
- Transition- how can I meet data sharing requirements, and actually make my data reusable? ANSWER: Just like any experiment or quality statistical approach, you need to plan ahead. There are tools to help. The library can help too.
- FigShare Dryad Data.gov
- MH: add link
- Want people to come to library to help with archiving/data publication Where can you keep your data? Does it have sensitive info? Yes/no Does it need to be archived? Make decision tree for one on one meetings
- What does this mean? It means storing or performing analyses on (many times) unsecure shared servers that may exist anywhere in the world Why should you care? Tools like dropbox and googledocs are research effecience lifesavers but come with an IP risk as well as risk of sharing PHI data Similarly, amazon cloud servers and genomics data analysis platforms are all too easy to set up or use, and can lead to PHI data being leaked.
- MH: Example: DOIs for publications, data, or other research product doi: 10.1371/journal.pbio.1001339 A URI will resolve to a single location on the web URIs for people
- RC
- Scientific output and potential impact is more complex, dynamic, and diverse than peer-reviewed papers. Actively managing your research footprint – which includes of course your data – can positively affect your scientific impact.
- MH – I updated a bit..
- MELISSA
- Robin add better title? Needs cleanup still
- Grab info for NIH Melissa also talk about NSF biosketch and how everything you create speaks to you as a scientist- make it citable! End with your scholarly footprint – lead into breakouts
- JW
- JW
- MH: Should add links to libguide, library pages etc.