SlideShare une entreprise Scribd logo
1  sur  15
Télécharger pour lire hors ligne
CASE OF THE WEEK
                   PROFESSOR YASSER METWALLY
CLINICAL PICTURE

CLINICAL PICTURE

A 65 years old female patient presented clinically with left sided hemiplegia of 10 days duration. The patient also
give a previous history of right sided hemiplegia of 8 months duration. The patient was normotensive when
admitted with negative history of diabetes mellitus and other vascular risk factors.

RADIOLOGICAL FINDINGS

RADIOLOGICAL FINDINGS  


Figure 1. A, Precontrast CT scan and precontrast MRI T1 images showing a right superficial lobar subacute
hematoma in the posterior parietal region. The hematoma is hyperdense on CT scan image. In the MRI T1 images
(B,C) the ring hyperintensity at the periphery of the right posterior parietal hematoma is due to methemoglobin,
while the central T1 hypointensity in the same hematoma is due to deoxyhemoglobin. A large lesion (hypointense on
the MRI T1 images and hypodense on CT scan image) is seen in the left fronto-parietal region, The lesion has a
negative mass effect noted by ventricular dilatation in the same side of the hematoma. Also notice lacunar
infarctions seen in the basal ganglionic and thalamic regions. The left fronto-parietal lesion represents an old
intracerebral hematoma and the right posterior parietal lesion represents a subacute hematoma. Notice that both
hematomas are lobar and superficial. Both hematomas have an irregular, variegated appearance.
Figure 2. Precontrast MRI T1 images (A,B) and MRI T2 image (C). The precontrast T1 hyperintensity and T2
hyperintensity is due to Extracellular migration of methemoglobin. The hypointense rim surrounding the right
posterior parietal lesion and the left fronto-parietal lesion on the MRI T1,T2 images is due to hemosiderin. Both
hematomas have an irregular, variegated appearance.


Figure 3. Bilateral hematomas of different ages. MRI T2 images showing a subacute right posterior parietal
hematoma and an old left fronto-parietal hematoma. The T2 hyperintensity is due to extracellular migration of
methemoglobin. The hypointense rim surrounding the right posterior parietal lesion and the left fronto-parietal
lesion on the MRI T2 images is due to hemosiderin. The older left fronto-parietal hematoma is still surrounded by
the hemosiderin hypointense rim. Both hematomas have an irregular, variegated appearance.
Figure 4. Bilateral hematomas of different ages. MRI T2 images showing a subacute right posterior parietal
hematoma and an old left fronto-parietal hematoma. The T2 hyperintensity is due to extracellular migration of
methemoglobin. The hypointense rim surrounding the right posterior parietal lesion and the left fronto-parietal
lesion on the MRI T2 images is due to hemosiderin. The older left fronto-parietal hematoma is still surrounded by
the hemosiderin hypointense rim. Both hematomas have an irregular, variegated appearance.


                                                              Figure 5. CT scan (A) and precontrast MRI T1
                                                              (B,C) and MRI T2 image (D) showing the right
                                                              posterior parietal subacute hematoma and the left
                                                              old fronto-parietal hematoma
The hematoma biochemical stages


Table 1. The MRI biochemical stages of cerebral hematomas [25]

          Biochemical substance                                         MRI changes
    Oxyhemoglobin                       Oxyhemoglobin lacks unpaired electrons and thus clot signal is close to
                                        normal brain parenchyma- normal to slightly lower signal on TI-weighted
                                        images and slightly higher signal on T2-weighted images
    Paramagnetic intracellular          Because the deoxyhemoglobin within intact, clotted hypoxic red blood cells
    deoxyhemoglobin.                    does not cause T1 shortening, the hematoma will have normal to slightly
                                        lower signal on TI-weighted MR images. The concentration of red blood
                                        cells with clot and the concentration of fibrin cause T2 shortening, with
                                        areas of very low signal on T2-weighted spin echo and T2 * -weighted
                                        gradient echo images
    Paramagnetic intracellular          Proton-electron dipole-dipole interactions between hydrogen atoms and the
    methemoglobin.                      paramagnetic centers of methemoglobin will cause marked TI shortening
                                        and very high signal intensity on TI-weighted images within the periphery of
                                        the hematoma. The intracellular methemoglobin will cause T2 shortening
                                        and very low signal on T2-weighted images.
    Extracellular migration of          MR will exhibit the persistent high signal of extracellular methemoglobin on
    methemoglobin.                      TI - and T2-weighted images for up to a year. The peripheral rim of
                                        hemosiderin and ferritin has slightly low signal on Tl- and marked low
                                        signal on T2-weighted images from the susceptibility effect of hemosiderin
                                        within macrophage lysosomes.
    Clot resorption begins from the     Focal atrophy is characterized by a decrease in the size of cortical gyri, with
    periphery inward, and depending     compensatory enlargement of cerebrospinal fluid spaces and dilatation of
    on the size of the hematoma, may    the adjacent ventricle. Cystic cavities are surrounded by gliosis and
    vary from one to six weeks in       hemosiderin scarring.
    duration.    Necrotic  tissue  is
    sloughed and cystic cavities are
    formed over the next 6 to 12
    months.


The multiple intracerebral hematomas are due to amyloid angiopathy because of
1- The multiplicity of the lesions.

    2- The superficial nature of both hematomas.

    3- The lobar location of both hematomas.

    4- Both hematomas have an irregular, variegated appearance.

    5- Absence of vascular risk factors.


    DIAGNOSIS:

DIAGNOSIS: AMYLOID ANGIOPATHY WITH MULTIPLE LOBAR INTRACEREBRAL HEMATOMAS

DISCUSSION

DISCUSSION

          Cerebral amyloid angiopathy

Cerebral amyloid angiopathy (CAA), also known as congophilic angiopathy, affects exclusively the cerebral
vasculature, without involvement of other areas of the body. The amyloid substance is deposited in the media and
adventitia of small and medium diameter arteries, as well as in veins, of the cortical surface and leptomeninges. The
histological diagnosis is made by showing areas of the vessel wall that stain with Congo red and show a
characteristic apple green birefringence under polarized light.  

CAA characteristically affects the elderly, with a linear increase in frequency with age. In routine autopsy studies,
the frequency of CAA has been 5-13% in those patients aged 60-69, 20-40% in patients aged 70-79, 35-45% in
patients aged 80-89, and 45-58% in individuals older than 90 years of age. The main clinical manifestation of CAA
is ICH, but an association with Alzheimer's disease and with a leukoencephalopathy are now well recognized as
well. [25]


Figure 6. Lobar hemorrhage due to amyloid angiopathy, B Microscopic section of the brain cortex, section has been
stained with Congo Red for amyloid viewed with polarized light. The section shows relatively preserved cortical
neurons and the blood vessels shows birefringence with polarized light. In some areas the walls of the blood vessels
are yellow-green (arrow). Diagnosis: Amyloid angiopathy, also known as congophilic angiopathy.


The ICHs that occur in the setting of CAA have several characteristic features. These include: [25]

             A lobar location, due to the cortical and leptomeningeal distribution of the angiopathy.
CCA
             A frequently irregular, variegated appearance on a computed tomography (CT) scan, which results
              from extension of the superficially-located haemorrhage into the adjacent subarachnoid space.
CCA
             A tendency to be recurrent, on occasion with multiple episodes of lobar ICH over periods of months or
CCA
              years, a feature that is exceptionally rare in ICH due to hypertension.
CCA
             The occasional presence of multiple simultaneous haemorrhages, is also a distinct rarity in ICH of
              hypertensive mechanism.

The ICH in patients with CAA can occasionally be related to preceding head trauma or a neurosurgical procedure,
raising the possibility that mechanically-induced vascular rupture may be at times involved in its pathogenesis.
Similarly, the use of anticoagulant and fibrinolytic agents is being increasingly suspected as a potential risk factor
in instances of ICH in the elderly, presumed to harbour CAA as a local vascular lesion predisposing to ICH.

The actual mechanism of bleeding in CAA has not been elucidated. A factor that may be related to bleeding is the
association of this angiopathy with other vascular changes, notably fibrinoid necrosis. Such vascular lesion has been
found with high frequency (71%) in instances of CAA associated with ICH, while it is not present in patients with
CAA but without ICH. These data suggest that despite the high prevalence of CAA in the elderly, the relatively low
frequency of ICH may be explained by the need to have the associated changes of fibrinoid necrosis in the affected
vessels, in order to result in rupture and ICH. [25]

CA with ICH is a sporadic condition, but two rare familial forms have been described only in specific geographical
locations in Iceland and in Holland. The latter form of familial CAA with ICH has been characterized as a
biochemical abnormality in the precursor protein of amyloid, which is also present in Alzheimer's disease and
Down's syndrome.

Other associations of CAA include Alzheimer's disease and a leukoencephalopathy. The histological features of
Alzheimer's disease are present in approximately 40% of patients with CAA-related ICH, and 30-40% of patients
with CAA have clinical features of dementia. The leukoencephalopathy of CAA affects the white matter of the
cerebral hemispheres, with preservation of the 'U' fibres, corpus callosum, internal capsule, optic radiation, and
white matter of the temporal lobes. The imaging diagnosis of this leukoencephalopathy is greatly facilitated by the
use of magnetic resonance imaging (MRI), which shows hyperintensity of the white matter in T2-weighted
sequences. [25]

NEUROIMAGING OF HEMATOMA

      Neuroimaging of cerebral hematoma

             CT imaging of haematoma.

A cerebral haematoma, in the acute stage, has higher attenuation values on precontrast scan (hyperdense). The
higher attenuation values of fresh blood is due to the existence of packed haemoglobin in the haematoma. In
particular the globin component of the haemoglobin is responsible for the increased CT density on precontrast
scan. With progressive absorption of haemoglobin, (this usually starts from the periphery of the haematoma) the
attenuation value of the haematoma gradually decreases until the high density haematoma is replaced by a low
density space occupying cyst.
Figure 7. A, Acute haematoma, B, an apoplectic cyst and C, an old haematoma (slit-like scar)

The evolution of the haematoma from a high density clot to a low density cyst usually takes a period that ranges
between one month to three months. The walls of this cyst might enhance and the haematoma at this stage might be
mixed with abscess or glioma. History is of paramount significance at this stage. Very old haematoma appears by
CT scan as a slit-like hypodense area with negative mass effect.

In general Haematomas are space-occupying with positive mass effect and are commonly surrounded by a
hypodense oedema area. The most common sites are the putameno-capsular and the thalamic sites and either of
them might rupture intraventricularly. Less common sites includes the parietal lobe, pons and cerebellum. [25]

The diagnosis of acute ICH is virtually 100% reliable with non-contrast CT due to the characteristic mass of blood
of high attenuation value, due to the presence of the globin component of the haemoglobin molecule. Under
exceptional circumstances, patients with profound anaemia, with a haematocrit of 20% or less have presented with
an acute haematoma which was isointense to brain on account of the low haemoglobin contents of the fresh
haematoma. Fresh blood has an attenuation value of 55-85 Hounsfield units, the high attenuation (50-70 Hounsfield
units) is from high protein concentration within intact red blood cells and not iron content. [25]

As the fresh clot starts to retract after 24-48 hours from onset, there is serum extrusion around its periphery,
resulting in a ring of hypointensity that surrounds the haematoma . In the subacute stage, the haematoma
maintains its mass effect but becomes progressively less dense, from the periphery toward the center, until reaching
isointensity with the adjacent brain parenchyma. The infusion of intravenous contrast at this stage can demonstrate
an area of ring enhancement at the periphery of the haematoma. In the chronic stage, the mass effect of the
haematoma is no longer present, post-contrast enhancement has disappeared after about 6 weeks from onset , and
the residual is a hypointense cavity, at times in the form of a slit that can be indistinguishable from an area of old
cavitated infarction. [25]

                  More detailed description of the CT scan appearance of brain hemorrhage

The CT appearance of hemorrhage is determined by the degree of attenuation of the x-ray beam, which is
proportional to the density of hemoglobin protein (relative to plasma concentration) within the hematoma. [25]

Immediately following vessel rupture, the hematoma consists of a collection of red blood cells, white blood cells,
platelet clumps, and protein-rich serum that has a heterogeneous appearance on CT with attenuation in the range
of 30–60 Hounsfield units (HU), depending on the degree of plasma extrusion. In this hyperacute phase,
hemorrhage may be difficult to distinguish from normal cortex because of similar attenuation. Over minutes to
hours, a fibrin clot forms with an increase in attenuation to 60–80 HU (Fig. 8). Clot retraction and extrusion of
serum can further increase attenuation to as high as 80–100 HU in the center of the hematoma. The degree of
attenuation may be reduced in patients with severe anemia, impaired clot formation due to coagulopathy, or
volume averaging with adjacent tissue. Vasogenic edema evolves around the hematoma within hours and may
continue to increase for up to 2 weeks after hemorrhage onset. [25]
Figure 8. CT appearance of hemorrhage. Serial CT scans of right
                                              thalamic hematoma. (A) Acute ICH in the right thalamus with mean
                                              attenuation 65 HU. (B) CT performed 8 days later than (A); the
                                              periphery of the hematoma is now isodense to the brain while the
                                              center of the hematoma has mean attenuation 45 HU. (C) CT
                                              performed 13 days later than (A) shows continued evolution of the
                                              hematoma with decreasing attenuation. (D) CT performed 5 months
                                              later than (A) shows a small area of encephalomalacia in the location
                                              of the previous hemorrhage.


Over the following days, cells and protein are broken down and scavenged by macrophages, leading to slowly
decreasing attenuation, with the greatest decrease at the periphery of the hematoma and more gradual evolution
toward the center (Fig. 9). Within 4 to 9 days, the hematoma attenuation decreases to that of normal cortex, and
within 2 to 3 weeks to that of normal white matter.

The CT recognition of subacute intracerebral hematoma can be challenging because the attenuation is similar to
that of normal brain tissue, although mass effect may still be present. MR imaging can confirm subacute
hematoma. As time goes on, attenuation continues to decrease to levels below that of the normal brain. Eventually,
the hematoma resolves into a fluid-filled or slit-like cavity that may be difficult to visualize on CT (Fig. 9). Contrast
enhancement is not present in the initial days following ICH but may develop at the periphery in weeks to months,
sometimes leading to diagnostic confusion with brain tumor or abscess.

A blood-fluid level may be seen in medium to large ICH within the first hours after onset; the dependent portion
displays higher attenuation due to sedimentation of cellular elements. This finding may be more common in ICH
caused by anticoagulation, but it is not specific and has also been described in ICH due to hypertension, trauma,
tumor, or arterial-venous malformation. The association with shorter time interval from ICH onset, and in some
cases with anticoagulation, has led to speculation that incomplete clotting is required for blood-fluid level
formation.


                             Figure 9. CT with blood-fluid level. A 77-year-old woman was admitted with coma of 4
                             hours' duration. CT scan shows massive left hemispheric hematoma with blood-fluid
                             level. No history of anticoagulation or coagulopathy.


Box 1. As the hemorrhage evolves, different characteristic appearances can be identified on CT, depending on the
age of the bleed. CT findings over time are as follows:
   After 7-10 days, the high density of blood begins to decrease, starting from the periphery of the lesion.

       From 1-6 weeks, peripheral enhancement can be seen, mimicking the appearance of an abscess, possibly
        related to hypervascularity at the periphery of a resolving hematoma or disruption of the blood-brain
        barrier.

       By 2-4 months, decreased density indicates cavity formation. A residual cavity is the final stage, which is
        reached after complete absorption of necrotic and hemorrhagic tissue.

             MR imaging of cerebral hematoma

                    Physical Factors

The appearance of intracranial hemorrhage on MR imaging is influenced by intrinsic factors, such as age, location,
and cause of the hemorrhage, as well as extrinsic factors, which include the strength of the magnetic field and the
pulse sequence parameters used for imaging. For the purposes of this discussion, the appearance of hemorrhage is
examined in five time frames: hyperacute (O to 12 hours), acute (12 hours to 3 days), early subacute (3 days to 1
week), late subacute (1 week to months), and chronic (months to years).

Magnetic susceptibility refers to the ability of tissues within a magnetic field to generate their own local magnetic
field. When a substance generates a local magnetic field that augments the main magnetic field, it is termed
paramagnetic. The number of unpaired electrons within the outer shell of atoms or molecules is responsible for the
paramagnetic effect. The greater the number of unpaired electrons, the larger the effect. In the normal afferent
cerebral circulation, oxyhemoglobin, which is non paramagnetic (diamagnetic), predominates. When
oxyhemoglobin is isolated from an oxygen-rich environment, progressive changes occur that yield three
paramagnetic products of hemoglobin: deoxyhemoglobin, followed by methemoglobin, and then hemosiderin. The
paramagnetic effects of these three hemoglobin byproducts are in large part responsible for the distinctive MR
imaging appearance of the various stages of intracranial hemorrhage, particularly at high field strength (1.5 T).

Paramagnetic substances alter the local magnetic environment experienced by individual hydrogen nuclei. When
placed within an external magnetic field (the MR scanner), paramagnetic substances generate their own local
magnetic field, which is additive to the externally applied field. This situation induces magnetic field inhomogeneity,
which affects MR relaxation processes, causing accelerated signal loss because of spin dephasing and loss of
transverse coherence (enhanced T2 relaxation). This accelerated signal loss results in decreased signal intensity on
T2-weighted images roughly proportional to the square of the field strength of the MR scanner. Therefore, high
field MR scanners (1.5 T) are more sensitive for the detection of hemorrhage than low field scanners

                    MR appearance of intracerebral hemorrhage

The physics of MR imaging of hemorrhage is complex; multiple reviews have covered this topic in detail [1,2]. A
brief explanation is warranted here, however, because an understanding of the signal characteristics of
hemorrhage, as well as their evolution over time, is essential for radiologic interpretation.

The MR signal intensity of hemorrhage is dependent on both the chemical state of the iron atoms within the
hemoglobin molecule and the integrity of the red blood cell membrane [3]. Iron can be either diamagnetic or
paramagnetic, depending on the state of its outer electron orbitals. In the paramagnetic state, it alters the T1 and
T2 relaxation times of water protons through magnetic dipole–dipole interactions and susceptibility effects. Dipole–
dipole interactions shorten both the T1 and T2 relaxation times but have a greater effect on T1. Susceptibility effect
is present when iron atoms are compartmentalized within the red cell membrane, causing magnetic field
inhomogeneity, with resulting loss of phase coherence and selective shortening of the T2 relaxation time. After
degradation of red cell membranes, the iron becomes more homogenously distributed, and this effect is nullified.
Other factors that influence signal characteristics to a lesser extent include protein content, brain edema, oxygen
tension, blood–brain barrier breakdown, thrombus formation, and clot retraction [2].

Both the chemical environment surrounding the hemoglobin iron atom and red cell membrane integrity undergo
relatively predictable changes after ICH. The following section enumerates these changes in MR signal
characteristics during the different phases of ICH evolution (Fig. 10 and Table 1).
Figure 10. MR imaging appearance of hemorrhage on T1-weighted (left column) and T2-weighted (right column)
sequences for the different stages of hematoma (rows). Examples are selected from various patients. Hyperacute:
There is relative isointensity on the T1-weighted and hyperintensity on the T2-weighted sequence of this right
occipital hematoma. A small degree of vasogenic edema surrounds the hematoma. On the T2-weighted sequence
there is a thin rim of hypointensity that is barely detectable in the periphery; this is caused by susceptibility effect
from deoxy-hemoglobin. Acute: The marked hypointensity on the T2-weighted sequence of this left frontal
hematoma is caused by susceptibility effect from deoxy-hemoglobin. Early subacute: The hyperintensity on the T1-
weighted sequence of this right occipital hematoma is caused by the oxidation of deoxy-hemoglobin to met-
hemoglobin. Late subacute: The hyperintensity on the T2-weighted sequence of this large left frontal hematoma
results from the loss of susceptibility effect caused by degradation of the red cell membranes. The degree of
vasogenic edema is lesser compared with earlier phases. Chronic: A former large right frontal hematoma has
resolved into a slit-like cavity with a rim of hypointensity on the T2-weighted sequence caused by hemosiderin
deposition.


Table 2. Evolution of MR imaging signal characteristics with time
Iron
                               Iron-containing                   Red cell
    Phase           Time                            oxidation                     T1            T2           T2*
                                  molecule                      membranes
                                                        state
Hyperacute Hours             Oxyhemoglobin         Fe 2+      Intact         Hypointense      Hyperintense
Acute      Hours to          Deoxyhemoglobin       Fe 2+      Intact            iso/
                                                                                         Hypointense Hypointense
           days                                                              Hypointense
Early      Days to 1         Methemoglobin         Fe 2+          Intact
                                                                             Hyperintense         Hypointense
subacute   week
Late       1 week to         Methemoglobin         Fe 2+          Degraded
                                                                             Hyperintense        Hyperintense
subacute   months
Chronic    >months           Hemosiderin           Fe 2+          Degraded      iso/
                                                                                         Hypointense Hypointense
                                                                             Hypointense
Abbreviations: Fe, iron; iso, isointense relative to normal brain..

                   Effect of hematoma evolution on MR imaging appearance of intracerebral hemorrhage

                          Hyperacute phase

The hyperacute phase of the hematoma is seen immediately following extravasation of blood into the brain
parenchyma. At this stage the red cell membrane is intact, and the hemoglobin molecule is normally saturated with
oxygen (oxy-hemoglobin). Specifically, the iron atoms contained within the heme portions of the hemoglobin
molecule are bound to oxygen. This is the only phase of hematoma in which the iron atoms have no unpaired
electrons in their outer orbitals and are therefore “diamagnetic,” without exaggerated T1 relaxation or
susceptibility effects. The ICH signal characteristics are thus not primarily attributable to iron but instead to the
increased spin density of the hematoma relative to uninvolved brain tissue. Hyperacute hematoma appears slightly
hypointense or iso-intense on T1-weighted images and slightly hyperintense on T2-weighted images (see Fig. 10);
this pattern resembles that of many other pathologic conditions of the brain. Even early in the hyperacute phase,
however, there is often deoxy-hemoglobin at the periphery of the hematoma, which appears as a thin rim of T2
hypointensity. This pattern can help differentiate hyperacute hematoma from other brain pathologies [4–5].

                          Acute phase

The acute phase, which begins within hours of ICH, is characterized by deoxy-hemoglobin. Deoxygenation occurs
first at the periphery of the hematoma and progresses toward the center. This pattern appears because
intrahematoma oxygen tension is lowest in the periphery, where red cells are adjacent to oxygen-starved tissue, and
highest in the center, because red cells do not use oxygen for their metabolism. The iron atoms of deoxy-hemoglobin
have five ligands and four unpaired electrons and hence are paramagnetic. Susceptibility effect is present because
the iron is compartmentalized within intact red cell membranes, resulting in hypointensity on T2-weighted images
that is due to increased T2* relaxation (see Fig. 10). Magnetic dipole–dipole interactions are prevented by the three-
dimensional atomic structure of deoxy-hemoglobin, which blocks access of water protons to iron atoms. T1
relaxation times are therefore not shortened, and there is iso- or slight hypointensity on T1-weighted images (see
Fig. 10). Sometimes a thin rim of T1 hyperintensity can be seen in the periphery of the hematoma, caused by early
oxidation of intracellular deoxy-hemoglobin to intracellular met-hemoglobin.

                          Early subacute phase

After several days, the early subacute phase begins. The production of reducing substances declines with failure of
red cell metabolism, and the iron atoms are oxidized to the ferric state, Fe3+, to produce met-hemoglobin. Magnetic
dipole–dipole interactions can occur because the three-dimensional structure of met-hemoglobin exposes the iron
atoms to water protons. This pattern leads to decreased T1 relaxation times and marked hyperintensity on T1-
weighted images. Susceptibility effect is present because the red cell membranes remain intact, and hence there is
continued hypointensity on T2-weighted images (see Fig. 10).

                          Late subacute phase

Over several days to weeks, the red cell membranes are degraded, and the late subacute phase begins. Susceptibility
effect is lost because met-hemoglobin is no longer locally sequestered within red cell membranes; it freely diffuses
within the hematoma cavity, resulting in a locally homogeneous magnetic field. This pattern leads to T2*
lengthening, and hence to increased hyperintensity, on T2-weighted images (see Fig. 10).

                        Chronic phase

Over the ensuing months, the hematoma enters the chronic phase. The degree of hyperintensity on T1- and T2-
weighted images lessens as the concentration of met-hemoglobin decreases with protein breakdown. The center of
the hematoma may evolve into a fluid-filled cavity with signal characteristics identical to cerebrospinal fluid, or the
walls of the cavity may collapse, leaving only a thin slit (see Fig. 10). As proteins are degraded, the iron atoms
become liberated from the heme molecules, scavenged by macrophages, and converted into ferritin, which can be
recycled. In most cases, however, the degree of iron deposition overwhelms the recycling capacity, with the excess
being locally concentrated in hemosiderin molecules. The iron in hemosiderin does not have access to water protons
and therefore exerts only susceptibility effect without significant dipole–dipole interactions, leading to marked
hypointensity on T2-weighted images. This hypointensity is seen at the rim of the hematoma cavity and may persist
indefinitely.

In practice, there is considerable variability in the orderly progression of hematoma signal change over time. The
evolution of these signal characteristics may be influenced by a number of factors, including ICH size, oxygen
tension, integrity of the blood–brain barrier, the presence of rebleeding, the efficiency of the patient's intrinsic
repair processes, and the presence of an underlying lesion such as an arteriovenous malformation or tumor [2]. It is
common to see different stages appear simultaneously. For these reasons, “dating” of bleed onset using MR imaging
data alone is intrinsically imprecise.


SUMMARY


SUMMARY

Hyperacute          Hyperacute hemorrhage refers to a collection of blood in which oxyhemoglobin predominates.
Hemorrhage (0       This type of hemorrhage is rarely encountered in the clinical setting because several hours
TO 12 Hours)        commonly elapse between the onset of hemorrhage and a patient being referred for MR
                    imaging. A hyperacute hematoma may have a nonspecific appearance on MR imaging because
                    oxyhemoglobin is not paramagnetic. Hyperacute hemorrhages can behave similar to other
                    lesions with increased water content and are typically isointense or low signal on Tl-weighted
                    images and high signal on T2- weighted images.With clot retraction in the hyperacute phase,
                    the increased protein content of the hemorrhage results in the lesion being isointense to
                    hyperintense on Tl- weighted images, which can facilitate differentiation from other mass
                    lesions.A hypointense rim along the periphery of a hyperacute hemorrhage was noted ,and this
                    may provide an additional clue to the diagnosis. Hyperacute hemorrhage, however, is more
                    readily identified on CT, which remains the initial examination of choice for its evaluation.
Acute               In the acute setting, there is clot retraction and resorption of serum. As the hematoma
Hemorrhage (12      becomes isolated from the normal cerebral circulation, oxyhemoglobin rapidly deoxygenates
Hours to 3 Days)    to yield deoxyhemoglobin. The increased protein content of the retracted clot, which is
                    responsible for the high attenuation noted on noncontrast CT, causes the hematoma to be
                    slightly hyperintense relative to low-intensity cerebrospinal fluid (CSF) and slightly
                    hypointense to brain parenchyma on Tl-weighted images. In contrast to CT in the acute
                    setting, which reliably demonstrates high attenuation characteristic of acute hemorrhage, MR
                    imaging findings on Tl-weighted images are relatively nonspecific.

                   T2-weighted images demonstrate a marked decrease in signal intensity because of magnetic
                   susceptibility effects. The signal loss is due to local field inhomogeneity related to
                   paramagnetic deoxyhemoglobin within intact red blood cells.Gradient echo images exaggerate
                   this effect and are often useful for the diagnosis of acute hemorrhage
Subacute           In the early subacute stage, oxidation of deoxyhemoglobin to methemoglobin occurs within
Hemorrhage:        intact red blood cells. Methemoglobin is paramagnetic, which results in marked increased
Early (3 Days to I signal intensity on Tl-weighted images.Typically the increased signal begins at the periphery of
Week)                 the clot and progresses inward. The differential diagnosis of lesions that demonstrate
                      increased signal intensity on noncontrast TI-weighted images is relatively limited. Fat;
                      substances with elevated protein content (mucus or fluid within certain intracranial tumors,
                      i.e., craniopharyngioma); and paramagnetic moieties, such as melanin, free radicals (within
                      the wall of parenchymal abscesses), and ions including calcium, manganese, and copper, can
                      exhibit high signal intensity on Tl-weighted images. Correlation with the clinical history,
                      morphology, and location of the lesion as well as appearance on other imaging sequences (i.e.,
                      T2, gradient echo, and fat suppression) typically allows differentiation from subacute
                      hemorrhage.

                  On T2-weighted images, paramagnetic methemoglobin in intact red blood cells results in low
                  signal intensity similar to that of deoxyhemoglobin. The combination of bright signal intensity
                  on Tl and markedly decreased signal intensity on T2 is relatively specific for paramagnetic
                  substances and, with the appropriate morphology, is highly suggestive of intracranial
                  hemorrhage
Subacute          The late subacute stage is characterized by lysis of the blood cells. Concurrently, there is
Hemorrhage: Late dilution of extracellular methemoglobin and breakdown of the proteinaceous clot. High signal
(1 Week to        intensity persists on TI-weighted images because of methemoglobin; however, lysis of the red
Months)           blood cells and the decrease in protein content result in increased signal intensity on T2-
                  weighted images.Bright signal intensity on both Tl-weighted and T2- weighted images is highly
                  specific for hemorrhage . Furthermore, at the periphery of the hemorrhage, early
                  accumulation of hemosiderin and ferritin within macrophages causes a low signal intensity
                  ring, most prominent on T2-weighted images.
Chronic stage     The hallmark of chronic hemorrhage is low signal intensity on T2-weighted images because of
(Months to Years) ferritin and hemosiderin within macrophages, which are the final breakdown products of
                  hemoglobin. The resulting low intensity first appears during the late subacute stage of
                  hematoma evolution at the margin of the lesion. With time, the rim thickens. A collapsed
                  cavity with peripheral areas of low signal intensity on T2-weighted images is the residuum of
                  an uncomplicated intraparenchymal hemorrhage. This appearance can persist indefinitely .

      Addendum

            A new version of this software is uploaded in my web site every week (every Saturday and remains available
             till Friday.)

            To download the current version follow the link quot;http://neurology.yassermetwally.com/crow.zipquot;.
            You can also download the current version from within the publication or go to my web site at
             quot;http://yassermetwally.comquot; to download it.
            At the end of each year, all the publications are compiled on a single CD-ROM, please contact the author to
             know more details.
            Screen resolution is better set at 1024*768 pixel screen area for optimum display


REFERENCES

References

1. Bradley WG. MR appearance of hemorrhage in the brain. Radiology. 1993;189(1):15–26.

2. Atlas SW, Thulborn KR. Intracranial hemorrhage. In: Atlas SW editors. Magnetic resonance imaging of the
brain and spine. 3rd edition. Philadelphia: Lippincott Williams & Wilkins; 2002;.

3. Gomori JM, Grossman RI, Goldberg HI, et al.. Intracranial hematomas: imaging by high-field MR. Radiology.
1985;157(1):87–93.

4. Linfante I, Llinas RH, Caplan LR, et al.. MRI features of intracerebral hemorrhage within 2 hours from
symptom onset. Stroke. 1999;30(11):2263–2267.
5. Wintermark M, Maeder P, Reichhart M, et al.. MR pattern of hyperacute cerebral hemorrhage. J Magn Reson
Imaging. 2002;15(6):705–709.

6. New PF, Aronow S. Attenuation measurements of whole blood and blood fractions in computed tomography.
Radiology 1976;121:635-40.

7. Atlas SW, Thulbom KR. MR detection of hyperacute parenchymal hemorrhage of the brain. Am J Neuroradiol
1998;19:1471-507.

8. Gomori JM, Grossman RI, Goldberg HI, et al. Intracranial hematomas: imaging by high-field MR. Radiology
1985;157:87-93.

9. Wilberger JE, Rothfus WE, Tabas J, et al. Acute tissue tear hemorrhages of the brain: computed tomography
and clinicopathological correlations. Neurosurgery 1990;27:208-13.

10. Barnett HJM, Yatsu FM, Mohr JP, Stein BM, eds.: Stroke: Pathophysiology, Diagnosis, and Management. 3rd
ed. Churchill Livingstone; 1998.

11. Bradley WG Jr: MR appearance of hemorrhage in the brain. Radiology 1993 Oct; 189(1): 15-26.

12. Broderick JP, Brott T, Tomsick T: Intracerebral hemorrhage more than twice as common as subarachnoid
hemorrhage. J Neurosurg 1993 Feb; 78(2): 188-91.

13. roderick JP, Brott TG, Duldner JE: Volume of intracerebral hemorrhage. A powerful and easy-to-use predictor
of 30-day mortality. Stroke 1993 Jul; 24(7): 987-93.

14. Challa VR, Moody DM, Bell MA: The Charcot-Bouchard aneurysm controversy: impact of a new histologic
technique. J Neuropathol Exp Neurol 1992 May; 51(3): 264-71.

15. Chan S, Kartha K, Yoon SS: Multifocal hypointense cerebral lesions on gradient-echo MR are associated with
chronic hypertension. AJNR Am J Neuroradiol 1996 Nov-Dec; 17(10): 1821-7.

16. Fazekas F, Kleinert R, Roob G: Histopathologic analysis of foci of signal loss on gradient-echo T2*- weighted
MR images in patients with spontaneous intracerebral hemorrhage: evidence of microangiopathy-related
microbleeds. AJNR Am J Neuroradiol 1999 Apr; 20(4): 637-42.

17. Gokaslan ZL, Narayan RK: Intracranial Hemorrhage in the Hypertensive Patient. Neuroimaging Clinics of
North America 1992; 2: 171-86.

18. Gomori JM, Grossman RI: Mechanisms responsible for the MR appearance and evolution of intracranial
hemorrhage. Radiographics 1988 May; 8(3): 427-40.

19. Nelson JS, Parisi JE, Schochet SS Jr: Principles and Practise of Neuropathology. Mosby - Year Book, Inc. St.
Louis, MO; 1993.

20. Robertson CS, Contant CF, Gokaslan ZL: Cerebral blood flow, arteriovenous oxygen difference, and outcome
in head injured patients. J Neurol Neurosurg Psychiatry 1992 Jul; 55(7): 594-603.

21. Ruscalleda J, Peiro A: Prognostic factors in intraparenchymatous hematoma with ventricular hemorrhage.
Neuroradiology 1986; 28(1): 34-7.

22. Spangler KM, Challa VR, Moody DM: Arteriolar tortuosity of the white matter in aging and hypertension. A
microradiographic study. J Neuropathol Exp Neurol 1994 Jan; 53(1): 22-6.

23. Taveras JM, Pile-Spellman J: Neuroradiology. 3rd ed. Williams & Wilkins; 1996.

24. Welch KMA, Caplan LR, Reis DJ, Weir B, Siesjo BK, eds.: Primer on Cerebrovascular Diseases. Morgan
Kaufmann; 1997.
25. Metwally, MYM: Textbook of neurimaging, A CD-ROM publication, (Metwally, MYM editor) WEB-CD
agency for electronic publication, version 8.4a october 2007

Contenu connexe

Tendances

Basic physics and normal interpretation of MRS
Basic physics and normal interpretation of MRSBasic physics and normal interpretation of MRS
Basic physics and normal interpretation of MRStanzilur rahman
 
Imaging in stroke
Imaging in stroke Imaging in stroke
Imaging in stroke Deepak Garg
 
Presentation1.pptx, radiological imaging of cerebral venous thrombosis.
Presentation1.pptx, radiological imaging of cerebral venous thrombosis.Presentation1.pptx, radiological imaging of cerebral venous thrombosis.
Presentation1.pptx, radiological imaging of cerebral venous thrombosis.Abdellah Nazeer
 
Diffusion tensor imaging in Neurology
Diffusion tensor imaging in NeurologyDiffusion tensor imaging in Neurology
Diffusion tensor imaging in NeurologyOsama Ragab
 
Susceptibility Weighted Imaging (SWI)
Susceptibility Weighted Imaging (SWI)Susceptibility Weighted Imaging (SWI)
Susceptibility Weighted Imaging (SWI)Nija Panchal
 
Current trends in imaging of Epilepsy
Current trends in imaging of EpilepsyCurrent trends in imaging of Epilepsy
Current trends in imaging of EpilepsySameer Peer
 
Cerebro vascular lesions
Cerebro vascular lesionsCerebro vascular lesions
Cerebro vascular lesionsAbdellah Nazeer
 
DIGITAL SUBTRACTION ANGIOGRAPHY IN CEREBROVASCULAR DISEASE AND PERSPECTIVE.pptx
DIGITAL SUBTRACTION ANGIOGRAPHY IN CEREBROVASCULAR DISEASE AND PERSPECTIVE.pptxDIGITAL SUBTRACTION ANGIOGRAPHY IN CEREBROVASCULAR DISEASE AND PERSPECTIVE.pptx
DIGITAL SUBTRACTION ANGIOGRAPHY IN CEREBROVASCULAR DISEASE AND PERSPECTIVE.pptxNeurologyKota
 
Reversible cerebral vasoconstriction syndrome
Reversible cerebral vasoconstriction syndromeReversible cerebral vasoconstriction syndrome
Reversible cerebral vasoconstriction syndromeSAYED FATHY
 
Bilateral basal ganglia abnormalities - MRI
Bilateral basal ganglia abnormalities - MRIBilateral basal ganglia abnormalities - MRI
Bilateral basal ganglia abnormalities - MRIRoshan Valentine
 
Presentation1.pptx, radiological imaging of parkinsonism.
Presentation1.pptx, radiological imaging of parkinsonism.Presentation1.pptx, radiological imaging of parkinsonism.
Presentation1.pptx, radiological imaging of parkinsonism.Abdellah Nazeer
 
Neuroimaging in dementia
Neuroimaging in dementiaNeuroimaging in dementia
Neuroimaging in dementiaNeurologyKota
 
Mesial temporal lobe epilepsy
Mesial temporal lobe epilepsyMesial temporal lobe epilepsy
Mesial temporal lobe epilepsydr archana verma
 
Arteriovenous Malformation (AVM) of Brain
Arteriovenous Malformation (AVM) of BrainArteriovenous Malformation (AVM) of Brain
Arteriovenous Malformation (AVM) of BrainDhaval Shukla
 
Magnetic Resonance Angiography and Venography
Magnetic Resonance Angiography and VenographyMagnetic Resonance Angiography and Venography
Magnetic Resonance Angiography and VenographyAnjan Dangal
 
Genetic stroke syndrome
Genetic stroke syndromeGenetic stroke syndrome
Genetic stroke syndromeSarath Menon
 
CT perfusion physics and its application in Neuroimaging
CT perfusion physics and its application in NeuroimagingCT perfusion physics and its application in Neuroimaging
CT perfusion physics and its application in NeuroimagingDr.Suhas Basavaiah
 

Tendances (20)

Basic physics and normal interpretation of MRS
Basic physics and normal interpretation of MRSBasic physics and normal interpretation of MRS
Basic physics and normal interpretation of MRS
 
CTV and MRV
CTV and MRVCTV and MRV
CTV and MRV
 
Imaging in stroke
Imaging in stroke Imaging in stroke
Imaging in stroke
 
Presentation1.pptx, radiological imaging of cerebral venous thrombosis.
Presentation1.pptx, radiological imaging of cerebral venous thrombosis.Presentation1.pptx, radiological imaging of cerebral venous thrombosis.
Presentation1.pptx, radiological imaging of cerebral venous thrombosis.
 
Diffusion tensor imaging in Neurology
Diffusion tensor imaging in NeurologyDiffusion tensor imaging in Neurology
Diffusion tensor imaging in Neurology
 
Susceptibility Weighted Imaging (SWI)
Susceptibility Weighted Imaging (SWI)Susceptibility Weighted Imaging (SWI)
Susceptibility Weighted Imaging (SWI)
 
Current trends in imaging of Epilepsy
Current trends in imaging of EpilepsyCurrent trends in imaging of Epilepsy
Current trends in imaging of Epilepsy
 
Cerebro vascular lesions
Cerebro vascular lesionsCerebro vascular lesions
Cerebro vascular lesions
 
DIGITAL SUBTRACTION ANGIOGRAPHY IN CEREBROVASCULAR DISEASE AND PERSPECTIVE.pptx
DIGITAL SUBTRACTION ANGIOGRAPHY IN CEREBROVASCULAR DISEASE AND PERSPECTIVE.pptxDIGITAL SUBTRACTION ANGIOGRAPHY IN CEREBROVASCULAR DISEASE AND PERSPECTIVE.pptx
DIGITAL SUBTRACTION ANGIOGRAPHY IN CEREBROVASCULAR DISEASE AND PERSPECTIVE.pptx
 
Reversible cerebral vasoconstriction syndrome
Reversible cerebral vasoconstriction syndromeReversible cerebral vasoconstriction syndrome
Reversible cerebral vasoconstriction syndrome
 
Bilateral basal ganglia abnormalities - MRI
Bilateral basal ganglia abnormalities - MRIBilateral basal ganglia abnormalities - MRI
Bilateral basal ganglia abnormalities - MRI
 
Presentation1.pptx, radiological imaging of parkinsonism.
Presentation1.pptx, radiological imaging of parkinsonism.Presentation1.pptx, radiological imaging of parkinsonism.
Presentation1.pptx, radiological imaging of parkinsonism.
 
Neuroimaging in dementia
Neuroimaging in dementiaNeuroimaging in dementia
Neuroimaging in dementia
 
Mesial temporal lobe epilepsy
Mesial temporal lobe epilepsyMesial temporal lobe epilepsy
Mesial temporal lobe epilepsy
 
Arteriovenous Malformation (AVM) of Brain
Arteriovenous Malformation (AVM) of BrainArteriovenous Malformation (AVM) of Brain
Arteriovenous Malformation (AVM) of Brain
 
Magnetic Resonance Angiography and Venography
Magnetic Resonance Angiography and VenographyMagnetic Resonance Angiography and Venography
Magnetic Resonance Angiography and Venography
 
Genetic stroke syndrome
Genetic stroke syndromeGenetic stroke syndrome
Genetic stroke syndrome
 
MR spectroscopy
MR spectroscopyMR spectroscopy
MR spectroscopy
 
CT perfusion physics and its application in Neuroimaging
CT perfusion physics and its application in NeuroimagingCT perfusion physics and its application in Neuroimaging
CT perfusion physics and its application in Neuroimaging
 
Imaging in acute stroke
Imaging in acute strokeImaging in acute stroke
Imaging in acute stroke
 

Similaire à Case record...Cerebral amyloid angiopathy (CAA),

Case record...Hypertensive cerebral hemorrhage
Case record...Hypertensive cerebral hemorrhageCase record...Hypertensive cerebral hemorrhage
Case record...Hypertensive cerebral hemorrhageProfessor Yasser Metwally
 
Ich imaging mbs kota
Ich imaging mbs kotaIch imaging mbs kota
Ich imaging mbs kotaNeurologyKota
 
CEREBRAL VENOUS THROMBOSIS
CEREBRAL VENOUS THROMBOSISCEREBRAL VENOUS THROMBOSIS
CEREBRAL VENOUS THROMBOSISNija Panchal
 
Neuroradiology case presentation
Neuroradiology case presentationNeuroradiology case presentation
Neuroradiology case presentationVamshi Medico
 
LEUKODYSTROPHY FINAL.pptx sms medical jaipur
LEUKODYSTROPHY FINAL.pptx sms medical jaipurLEUKODYSTROPHY FINAL.pptx sms medical jaipur
LEUKODYSTROPHY FINAL.pptx sms medical jaipurdineshdandia
 
Case record...Arterial embolic hemorrhagic infarction
Case record...Arterial embolic hemorrhagic infarctionCase record...Arterial embolic hemorrhagic infarction
Case record...Arterial embolic hemorrhagic infarctionProfessor Yasser Metwally
 
Imágenes cerebrales a través de Resonancia Magnética
Imágenes cerebrales a través de Resonancia MagnéticaImágenes cerebrales a través de Resonancia Magnética
Imágenes cerebrales a través de Resonancia Magnéticacristalina.segura
 
Meningeal Based Intracranial Masses Beyond Meningioma
Meningeal Based Intracranial Masses Beyond MeningiomaMeningeal Based Intracranial Masses Beyond Meningioma
Meningeal Based Intracranial Masses Beyond MeningiomaDr Varun Bansal
 
Imaging in MESIAL TEMPORAL EPILESPY
Imaging in MESIAL TEMPORAL EPILESPYImaging in MESIAL TEMPORAL EPILESPY
Imaging in MESIAL TEMPORAL EPILESPYSarath Menon
 
Radiological pathology of spontaneous cerebral hemorrhage
Radiological pathology of spontaneous cerebral hemorrhageRadiological pathology of spontaneous cerebral hemorrhage
Radiological pathology of spontaneous cerebral hemorrhageProfessor Yasser Metwally
 
Neuroradiology in dementia
Neuroradiology in dementiaNeuroradiology in dementia
Neuroradiology in dementiaNeurologyKota
 
Orbital pathologies.pptx 1
Orbital pathologies.pptx 1Orbital pathologies.pptx 1
Orbital pathologies.pptx 1Anish Choudhary
 
Orbital pathologies.pptx (part 1)
Orbital pathologies.pptx (part 1)Orbital pathologies.pptx (part 1)
Orbital pathologies.pptx (part 1)Dr. Mohit Goel
 

Similaire à Case record...Cerebral amyloid angiopathy (CAA), (20)

Case record...Hypertensive cerebral hemorrhage
Case record...Hypertensive cerebral hemorrhageCase record...Hypertensive cerebral hemorrhage
Case record...Hypertensive cerebral hemorrhage
 
Ich imaging mbs kota
Ich imaging mbs kotaIch imaging mbs kota
Ich imaging mbs kota
 
Moyamoya disease
Moyamoya diseaseMoyamoya disease
Moyamoya disease
 
MRI Sequences in Neuroradiology
MRI Sequences in NeuroradiologyMRI Sequences in Neuroradiology
MRI Sequences in Neuroradiology
 
CEREBRAL VENOUS THROMBOSIS
CEREBRAL VENOUS THROMBOSISCEREBRAL VENOUS THROMBOSIS
CEREBRAL VENOUS THROMBOSIS
 
Case record...Occipital lobe cavernoma
Case record...Occipital lobe cavernomaCase record...Occipital lobe cavernoma
Case record...Occipital lobe cavernoma
 
Neuroradiology case presentation
Neuroradiology case presentationNeuroradiology case presentation
Neuroradiology case presentation
 
LEUKODYSTROPHY FINAL.pptx sms medical jaipur
LEUKODYSTROPHY FINAL.pptx sms medical jaipurLEUKODYSTROPHY FINAL.pptx sms medical jaipur
LEUKODYSTROPHY FINAL.pptx sms medical jaipur
 
Case record...Arterial embolic hemorrhagic infarction
Case record...Arterial embolic hemorrhagic infarctionCase record...Arterial embolic hemorrhagic infarction
Case record...Arterial embolic hemorrhagic infarction
 
Imágenes cerebrales a través de Resonancia Magnética
Imágenes cerebrales a través de Resonancia MagnéticaImágenes cerebrales a través de Resonancia Magnética
Imágenes cerebrales a través de Resonancia Magnética
 
Meningeal Based Intracranial Masses Beyond Meningioma
Meningeal Based Intracranial Masses Beyond MeningiomaMeningeal Based Intracranial Masses Beyond Meningioma
Meningeal Based Intracranial Masses Beyond Meningioma
 
Progressive multifocal leukoencephalopathy
Progressive multifocal leukoencephalopathyProgressive multifocal leukoencephalopathy
Progressive multifocal leukoencephalopathy
 
Imaging in MESIAL TEMPORAL EPILESPY
Imaging in MESIAL TEMPORAL EPILESPYImaging in MESIAL TEMPORAL EPILESPY
Imaging in MESIAL TEMPORAL EPILESPY
 
Case record... Behcet disease
Case record... Behcet diseaseCase record... Behcet disease
Case record... Behcet disease
 
Radiological pathology of spontaneous cerebral hemorrhage
Radiological pathology of spontaneous cerebral hemorrhageRadiological pathology of spontaneous cerebral hemorrhage
Radiological pathology of spontaneous cerebral hemorrhage
 
Case record...Parasagittal meningioma
Case record...Parasagittal meningiomaCase record...Parasagittal meningioma
Case record...Parasagittal meningioma
 
Neuroradiology in dementia
Neuroradiology in dementiaNeuroradiology in dementia
Neuroradiology in dementia
 
Orbital pathologies.pptx 1
Orbital pathologies.pptx 1Orbital pathologies.pptx 1
Orbital pathologies.pptx 1
 
Orbital pathologies.pptx (part 1)
Orbital pathologies.pptx (part 1)Orbital pathologies.pptx (part 1)
Orbital pathologies.pptx (part 1)
 
MRI brain
MRI brain MRI brain
MRI brain
 

Plus de Professor Yasser Metwally

The Snake, the Scorpion, the turtle in Egypt
The Snake, the Scorpion, the turtle in EgyptThe Snake, the Scorpion, the turtle in Egypt
The Snake, the Scorpion, the turtle in EgyptProfessor Yasser Metwally
 
Radiological pathology of epileptic disorders
Radiological pathology of epileptic disordersRadiological pathology of epileptic disorders
Radiological pathology of epileptic disordersProfessor Yasser Metwally
 
Radiological pathology of cerebrovascular disorders
Radiological pathology of cerebrovascular disordersRadiological pathology of cerebrovascular disorders
Radiological pathology of cerebrovascular disordersProfessor Yasser Metwally
 
Radiological pathology of cerebral amyloid angiography
Radiological pathology of cerebral amyloid angiographyRadiological pathology of cerebral amyloid angiography
Radiological pathology of cerebral amyloid angiographyProfessor Yasser Metwally
 
Radiological pathology of cerebral microbleeds
Radiological pathology of cerebral microbleedsRadiological pathology of cerebral microbleeds
Radiological pathology of cerebral microbleedsProfessor Yasser Metwally
 
Issues in radiological pathology: Radiological pathology of watershed infarct...
Issues in radiological pathology: Radiological pathology of watershed infarct...Issues in radiological pathology: Radiological pathology of watershed infarct...
Issues in radiological pathology: Radiological pathology of watershed infarct...Professor Yasser Metwally
 
Radiological pathology of cortical laminar necrosis
Radiological pathology of cortical laminar necrosisRadiological pathology of cortical laminar necrosis
Radiological pathology of cortical laminar necrosisProfessor Yasser Metwally
 

Plus de Professor Yasser Metwally (20)

The Egyptian Zoo in Cairo 2015
The Egyptian Zoo in Cairo 2015The Egyptian Zoo in Cairo 2015
The Egyptian Zoo in Cairo 2015
 
End of the great nile river in Ras Elbar
End of the great nile river in Ras ElbarEnd of the great nile river in Ras Elbar
End of the great nile river in Ras Elbar
 
The Lion and The tiger in Egypt
The Lion and The tiger in EgyptThe Lion and The tiger in Egypt
The Lion and The tiger in Egypt
 
The monkeys in Egypt
The monkeys in EgyptThe monkeys in Egypt
The monkeys in Egypt
 
The Snake, the Scorpion, the turtle in Egypt
The Snake, the Scorpion, the turtle in EgyptThe Snake, the Scorpion, the turtle in Egypt
The Snake, the Scorpion, the turtle in Egypt
 
The Egyptian Parrot
The Egyptian ParrotThe Egyptian Parrot
The Egyptian Parrot
 
The Egyptian Deer
The Egyptian DeerThe Egyptian Deer
The Egyptian Deer
 
The Egyptian Pelican
The Egyptian PelicanThe Egyptian Pelican
The Egyptian Pelican
 
The Flamingo bird in Egypt
The Flamingo bird in EgyptThe Flamingo bird in Egypt
The Flamingo bird in Egypt
 
Egyptian Cats
Egyptian CatsEgyptian Cats
Egyptian Cats
 
Radiological pathology of epileptic disorders
Radiological pathology of epileptic disordersRadiological pathology of epileptic disorders
Radiological pathology of epileptic disorders
 
Radiological pathology of cerebrovascular disorders
Radiological pathology of cerebrovascular disordersRadiological pathology of cerebrovascular disorders
Radiological pathology of cerebrovascular disorders
 
Radiological pathology of cerebral amyloid angiography
Radiological pathology of cerebral amyloid angiographyRadiological pathology of cerebral amyloid angiography
Radiological pathology of cerebral amyloid angiography
 
Radiological pathology of cerebral microbleeds
Radiological pathology of cerebral microbleedsRadiological pathology of cerebral microbleeds
Radiological pathology of cerebral microbleeds
 
The Egyptian Zoo in Cairo
The Egyptian Zoo in CairoThe Egyptian Zoo in Cairo
The Egyptian Zoo in Cairo
 
Progressive multifocal leukoencephalopathy
Progressive multifocal leukoencephalopathyProgressive multifocal leukoencephalopathy
Progressive multifocal leukoencephalopathy
 
Issues in radiological pathology: Radiological pathology of watershed infarct...
Issues in radiological pathology: Radiological pathology of watershed infarct...Issues in radiological pathology: Radiological pathology of watershed infarct...
Issues in radiological pathology: Radiological pathology of watershed infarct...
 
Radiological pathology of cortical laminar necrosis
Radiological pathology of cortical laminar necrosisRadiological pathology of cortical laminar necrosis
Radiological pathology of cortical laminar necrosis
 
Neurological examination PDF manual
Neurological examination  PDF manualNeurological examination  PDF manual
Neurological examination PDF manual
 
Fundus examination
Fundus examinationFundus examination
Fundus examination
 

Dernier

Holdier Curriculum Vitae (April 2024).pdf
Holdier Curriculum Vitae (April 2024).pdfHoldier Curriculum Vitae (April 2024).pdf
Holdier Curriculum Vitae (April 2024).pdfagholdier
 
ICT Role in 21st Century Education & its Challenges.pptx
ICT Role in 21st Century Education & its Challenges.pptxICT Role in 21st Century Education & its Challenges.pptx
ICT Role in 21st Century Education & its Challenges.pptxAreebaZafar22
 
Paris 2024 Olympic Geographies - an activity
Paris 2024 Olympic Geographies - an activityParis 2024 Olympic Geographies - an activity
Paris 2024 Olympic Geographies - an activityGeoBlogs
 
PROCESS RECORDING FORMAT.docx
PROCESS      RECORDING        FORMAT.docxPROCESS      RECORDING        FORMAT.docx
PROCESS RECORDING FORMAT.docxPoojaSen20
 
1029-Danh muc Sach Giao Khoa khoi 6.pdf
1029-Danh muc Sach Giao Khoa khoi  6.pdf1029-Danh muc Sach Giao Khoa khoi  6.pdf
1029-Danh muc Sach Giao Khoa khoi 6.pdfQucHHunhnh
 
Mixin Classes in Odoo 17 How to Extend Models Using Mixin Classes
Mixin Classes in Odoo 17  How to Extend Models Using Mixin ClassesMixin Classes in Odoo 17  How to Extend Models Using Mixin Classes
Mixin Classes in Odoo 17 How to Extend Models Using Mixin ClassesCeline George
 
Grant Readiness 101 TechSoup and Remy Consulting
Grant Readiness 101 TechSoup and Remy ConsultingGrant Readiness 101 TechSoup and Remy Consulting
Grant Readiness 101 TechSoup and Remy ConsultingTechSoup
 
Unit-V; Pricing (Pharma Marketing Management).pptx
Unit-V; Pricing (Pharma Marketing Management).pptxUnit-V; Pricing (Pharma Marketing Management).pptx
Unit-V; Pricing (Pharma Marketing Management).pptxVishalSingh1417
 
psychiatric nursing HISTORY COLLECTION .docx
psychiatric  nursing HISTORY  COLLECTION  .docxpsychiatric  nursing HISTORY  COLLECTION  .docx
psychiatric nursing HISTORY COLLECTION .docxPoojaSen20
 
Measures of Central Tendency: Mean, Median and Mode
Measures of Central Tendency: Mean, Median and ModeMeasures of Central Tendency: Mean, Median and Mode
Measures of Central Tendency: Mean, Median and ModeThiyagu K
 
Z Score,T Score, Percential Rank and Box Plot Graph
Z Score,T Score, Percential Rank and Box Plot GraphZ Score,T Score, Percential Rank and Box Plot Graph
Z Score,T Score, Percential Rank and Box Plot GraphThiyagu K
 
How to Give a Domain for a Field in Odoo 17
How to Give a Domain for a Field in Odoo 17How to Give a Domain for a Field in Odoo 17
How to Give a Domain for a Field in Odoo 17Celine George
 
Accessible design: Minimum effort, maximum impact
Accessible design: Minimum effort, maximum impactAccessible design: Minimum effort, maximum impact
Accessible design: Minimum effort, maximum impactdawncurless
 
Application orientated numerical on hev.ppt
Application orientated numerical on hev.pptApplication orientated numerical on hev.ppt
Application orientated numerical on hev.pptRamjanShidvankar
 
Seal of Good Local Governance (SGLG) 2024Final.pptx
Seal of Good Local Governance (SGLG) 2024Final.pptxSeal of Good Local Governance (SGLG) 2024Final.pptx
Seal of Good Local Governance (SGLG) 2024Final.pptxnegromaestrong
 
An Overview of Mutual Funds Bcom Project.pdf
An Overview of Mutual Funds Bcom Project.pdfAn Overview of Mutual Funds Bcom Project.pdf
An Overview of Mutual Funds Bcom Project.pdfSanaAli374401
 
microwave assisted reaction. General introduction
microwave assisted reaction. General introductionmicrowave assisted reaction. General introduction
microwave assisted reaction. General introductionMaksud Ahmed
 

Dernier (20)

Holdier Curriculum Vitae (April 2024).pdf
Holdier Curriculum Vitae (April 2024).pdfHoldier Curriculum Vitae (April 2024).pdf
Holdier Curriculum Vitae (April 2024).pdf
 
ICT Role in 21st Century Education & its Challenges.pptx
ICT Role in 21st Century Education & its Challenges.pptxICT Role in 21st Century Education & its Challenges.pptx
ICT Role in 21st Century Education & its Challenges.pptx
 
Mattingly "AI & Prompt Design: Structured Data, Assistants, & RAG"
Mattingly "AI & Prompt Design: Structured Data, Assistants, & RAG"Mattingly "AI & Prompt Design: Structured Data, Assistants, & RAG"
Mattingly "AI & Prompt Design: Structured Data, Assistants, & RAG"
 
Paris 2024 Olympic Geographies - an activity
Paris 2024 Olympic Geographies - an activityParis 2024 Olympic Geographies - an activity
Paris 2024 Olympic Geographies - an activity
 
PROCESS RECORDING FORMAT.docx
PROCESS      RECORDING        FORMAT.docxPROCESS      RECORDING        FORMAT.docx
PROCESS RECORDING FORMAT.docx
 
1029-Danh muc Sach Giao Khoa khoi 6.pdf
1029-Danh muc Sach Giao Khoa khoi  6.pdf1029-Danh muc Sach Giao Khoa khoi  6.pdf
1029-Danh muc Sach Giao Khoa khoi 6.pdf
 
Mixin Classes in Odoo 17 How to Extend Models Using Mixin Classes
Mixin Classes in Odoo 17  How to Extend Models Using Mixin ClassesMixin Classes in Odoo 17  How to Extend Models Using Mixin Classes
Mixin Classes in Odoo 17 How to Extend Models Using Mixin Classes
 
Grant Readiness 101 TechSoup and Remy Consulting
Grant Readiness 101 TechSoup and Remy ConsultingGrant Readiness 101 TechSoup and Remy Consulting
Grant Readiness 101 TechSoup and Remy Consulting
 
Unit-V; Pricing (Pharma Marketing Management).pptx
Unit-V; Pricing (Pharma Marketing Management).pptxUnit-V; Pricing (Pharma Marketing Management).pptx
Unit-V; Pricing (Pharma Marketing Management).pptx
 
Advance Mobile Application Development class 07
Advance Mobile Application Development class 07Advance Mobile Application Development class 07
Advance Mobile Application Development class 07
 
psychiatric nursing HISTORY COLLECTION .docx
psychiatric  nursing HISTORY  COLLECTION  .docxpsychiatric  nursing HISTORY  COLLECTION  .docx
psychiatric nursing HISTORY COLLECTION .docx
 
Measures of Central Tendency: Mean, Median and Mode
Measures of Central Tendency: Mean, Median and ModeMeasures of Central Tendency: Mean, Median and Mode
Measures of Central Tendency: Mean, Median and Mode
 
Código Creativo y Arte de Software | Unidad 1
Código Creativo y Arte de Software | Unidad 1Código Creativo y Arte de Software | Unidad 1
Código Creativo y Arte de Software | Unidad 1
 
Z Score,T Score, Percential Rank and Box Plot Graph
Z Score,T Score, Percential Rank and Box Plot GraphZ Score,T Score, Percential Rank and Box Plot Graph
Z Score,T Score, Percential Rank and Box Plot Graph
 
How to Give a Domain for a Field in Odoo 17
How to Give a Domain for a Field in Odoo 17How to Give a Domain for a Field in Odoo 17
How to Give a Domain for a Field in Odoo 17
 
Accessible design: Minimum effort, maximum impact
Accessible design: Minimum effort, maximum impactAccessible design: Minimum effort, maximum impact
Accessible design: Minimum effort, maximum impact
 
Application orientated numerical on hev.ppt
Application orientated numerical on hev.pptApplication orientated numerical on hev.ppt
Application orientated numerical on hev.ppt
 
Seal of Good Local Governance (SGLG) 2024Final.pptx
Seal of Good Local Governance (SGLG) 2024Final.pptxSeal of Good Local Governance (SGLG) 2024Final.pptx
Seal of Good Local Governance (SGLG) 2024Final.pptx
 
An Overview of Mutual Funds Bcom Project.pdf
An Overview of Mutual Funds Bcom Project.pdfAn Overview of Mutual Funds Bcom Project.pdf
An Overview of Mutual Funds Bcom Project.pdf
 
microwave assisted reaction. General introduction
microwave assisted reaction. General introductionmicrowave assisted reaction. General introduction
microwave assisted reaction. General introduction
 

Case record...Cerebral amyloid angiopathy (CAA),

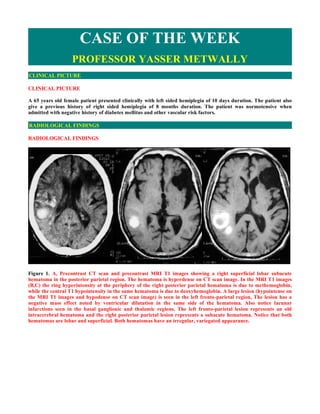
  • 1. CASE OF THE WEEK PROFESSOR YASSER METWALLY CLINICAL PICTURE CLINICAL PICTURE A 65 years old female patient presented clinically with left sided hemiplegia of 10 days duration. The patient also give a previous history of right sided hemiplegia of 8 months duration. The patient was normotensive when admitted with negative history of diabetes mellitus and other vascular risk factors. RADIOLOGICAL FINDINGS RADIOLOGICAL FINDINGS   Figure 1. A, Precontrast CT scan and precontrast MRI T1 images showing a right superficial lobar subacute hematoma in the posterior parietal region. The hematoma is hyperdense on CT scan image. In the MRI T1 images (B,C) the ring hyperintensity at the periphery of the right posterior parietal hematoma is due to methemoglobin, while the central T1 hypointensity in the same hematoma is due to deoxyhemoglobin. A large lesion (hypointense on the MRI T1 images and hypodense on CT scan image) is seen in the left fronto-parietal region, The lesion has a negative mass effect noted by ventricular dilatation in the same side of the hematoma. Also notice lacunar infarctions seen in the basal ganglionic and thalamic regions. The left fronto-parietal lesion represents an old intracerebral hematoma and the right posterior parietal lesion represents a subacute hematoma. Notice that both hematomas are lobar and superficial. Both hematomas have an irregular, variegated appearance.
  • 2. Figure 2. Precontrast MRI T1 images (A,B) and MRI T2 image (C). The precontrast T1 hyperintensity and T2 hyperintensity is due to Extracellular migration of methemoglobin. The hypointense rim surrounding the right posterior parietal lesion and the left fronto-parietal lesion on the MRI T1,T2 images is due to hemosiderin. Both hematomas have an irregular, variegated appearance. Figure 3. Bilateral hematomas of different ages. MRI T2 images showing a subacute right posterior parietal hematoma and an old left fronto-parietal hematoma. The T2 hyperintensity is due to extracellular migration of methemoglobin. The hypointense rim surrounding the right posterior parietal lesion and the left fronto-parietal lesion on the MRI T2 images is due to hemosiderin. The older left fronto-parietal hematoma is still surrounded by the hemosiderin hypointense rim. Both hematomas have an irregular, variegated appearance.
  • 3. Figure 4. Bilateral hematomas of different ages. MRI T2 images showing a subacute right posterior parietal hematoma and an old left fronto-parietal hematoma. The T2 hyperintensity is due to extracellular migration of methemoglobin. The hypointense rim surrounding the right posterior parietal lesion and the left fronto-parietal lesion on the MRI T2 images is due to hemosiderin. The older left fronto-parietal hematoma is still surrounded by the hemosiderin hypointense rim. Both hematomas have an irregular, variegated appearance. Figure 5. CT scan (A) and precontrast MRI T1 (B,C) and MRI T2 image (D) showing the right posterior parietal subacute hematoma and the left old fronto-parietal hematoma
  • 4. The hematoma biochemical stages Table 1. The MRI biochemical stages of cerebral hematomas [25] Biochemical substance MRI changes Oxyhemoglobin Oxyhemoglobin lacks unpaired electrons and thus clot signal is close to normal brain parenchyma- normal to slightly lower signal on TI-weighted images and slightly higher signal on T2-weighted images Paramagnetic intracellular Because the deoxyhemoglobin within intact, clotted hypoxic red blood cells deoxyhemoglobin. does not cause T1 shortening, the hematoma will have normal to slightly lower signal on TI-weighted MR images. The concentration of red blood cells with clot and the concentration of fibrin cause T2 shortening, with areas of very low signal on T2-weighted spin echo and T2 * -weighted gradient echo images Paramagnetic intracellular Proton-electron dipole-dipole interactions between hydrogen atoms and the methemoglobin. paramagnetic centers of methemoglobin will cause marked TI shortening and very high signal intensity on TI-weighted images within the periphery of the hematoma. The intracellular methemoglobin will cause T2 shortening and very low signal on T2-weighted images. Extracellular migration of MR will exhibit the persistent high signal of extracellular methemoglobin on methemoglobin. TI - and T2-weighted images for up to a year. The peripheral rim of hemosiderin and ferritin has slightly low signal on Tl- and marked low signal on T2-weighted images from the susceptibility effect of hemosiderin within macrophage lysosomes. Clot resorption begins from the Focal atrophy is characterized by a decrease in the size of cortical gyri, with periphery inward, and depending compensatory enlargement of cerebrospinal fluid spaces and dilatation of on the size of the hematoma, may the adjacent ventricle. Cystic cavities are surrounded by gliosis and vary from one to six weeks in hemosiderin scarring. duration. Necrotic tissue is sloughed and cystic cavities are formed over the next 6 to 12 months.     The multiple intracerebral hematomas are due to amyloid angiopathy because of
  • 5. 1- The multiplicity of the lesions. 2- The superficial nature of both hematomas. 3- The lobar location of both hematomas. 4- Both hematomas have an irregular, variegated appearance. 5- Absence of vascular risk factors.   DIAGNOSIS: DIAGNOSIS: AMYLOID ANGIOPATHY WITH MULTIPLE LOBAR INTRACEREBRAL HEMATOMAS DISCUSSION DISCUSSION  Cerebral amyloid angiopathy Cerebral amyloid angiopathy (CAA), also known as congophilic angiopathy, affects exclusively the cerebral vasculature, without involvement of other areas of the body. The amyloid substance is deposited in the media and adventitia of small and medium diameter arteries, as well as in veins, of the cortical surface and leptomeninges. The histological diagnosis is made by showing areas of the vessel wall that stain with Congo red and show a characteristic apple green birefringence under polarized light.   CAA characteristically affects the elderly, with a linear increase in frequency with age. In routine autopsy studies, the frequency of CAA has been 5-13% in those patients aged 60-69, 20-40% in patients aged 70-79, 35-45% in patients aged 80-89, and 45-58% in individuals older than 90 years of age. The main clinical manifestation of CAA is ICH, but an association with Alzheimer's disease and with a leukoencephalopathy are now well recognized as well. [25] Figure 6. Lobar hemorrhage due to amyloid angiopathy, B Microscopic section of the brain cortex, section has been stained with Congo Red for amyloid viewed with polarized light. The section shows relatively preserved cortical neurons and the blood vessels shows birefringence with polarized light. In some areas the walls of the blood vessels are yellow-green (arrow). Diagnosis: Amyloid angiopathy, also known as congophilic angiopathy.    
  • 6. The ICHs that occur in the setting of CAA have several characteristic features. These include: [25]  A lobar location, due to the cortical and leptomeningeal distribution of the angiopathy. CCA  A frequently irregular, variegated appearance on a computed tomography (CT) scan, which results from extension of the superficially-located haemorrhage into the adjacent subarachnoid space. CCA  A tendency to be recurrent, on occasion with multiple episodes of lobar ICH over periods of months or CCA years, a feature that is exceptionally rare in ICH due to hypertension. CCA  The occasional presence of multiple simultaneous haemorrhages, is also a distinct rarity in ICH of hypertensive mechanism. The ICH in patients with CAA can occasionally be related to preceding head trauma or a neurosurgical procedure, raising the possibility that mechanically-induced vascular rupture may be at times involved in its pathogenesis. Similarly, the use of anticoagulant and fibrinolytic agents is being increasingly suspected as a potential risk factor in instances of ICH in the elderly, presumed to harbour CAA as a local vascular lesion predisposing to ICH. The actual mechanism of bleeding in CAA has not been elucidated. A factor that may be related to bleeding is the association of this angiopathy with other vascular changes, notably fibrinoid necrosis. Such vascular lesion has been found with high frequency (71%) in instances of CAA associated with ICH, while it is not present in patients with CAA but without ICH. These data suggest that despite the high prevalence of CAA in the elderly, the relatively low frequency of ICH may be explained by the need to have the associated changes of fibrinoid necrosis in the affected vessels, in order to result in rupture and ICH. [25] CA with ICH is a sporadic condition, but two rare familial forms have been described only in specific geographical locations in Iceland and in Holland. The latter form of familial CAA with ICH has been characterized as a biochemical abnormality in the precursor protein of amyloid, which is also present in Alzheimer's disease and Down's syndrome. Other associations of CAA include Alzheimer's disease and a leukoencephalopathy. The histological features of Alzheimer's disease are present in approximately 40% of patients with CAA-related ICH, and 30-40% of patients with CAA have clinical features of dementia. The leukoencephalopathy of CAA affects the white matter of the cerebral hemispheres, with preservation of the 'U' fibres, corpus callosum, internal capsule, optic radiation, and white matter of the temporal lobes. The imaging diagnosis of this leukoencephalopathy is greatly facilitated by the use of magnetic resonance imaging (MRI), which shows hyperintensity of the white matter in T2-weighted sequences. [25] NEUROIMAGING OF HEMATOMA  Neuroimaging of cerebral hematoma  CT imaging of haematoma. A cerebral haematoma, in the acute stage, has higher attenuation values on precontrast scan (hyperdense). The higher attenuation values of fresh blood is due to the existence of packed haemoglobin in the haematoma. In particular the globin component of the haemoglobin is responsible for the increased CT density on precontrast scan. With progressive absorption of haemoglobin, (this usually starts from the periphery of the haematoma) the attenuation value of the haematoma gradually decreases until the high density haematoma is replaced by a low density space occupying cyst.
  • 7. Figure 7. A, Acute haematoma, B, an apoplectic cyst and C, an old haematoma (slit-like scar) The evolution of the haematoma from a high density clot to a low density cyst usually takes a period that ranges between one month to three months. The walls of this cyst might enhance and the haematoma at this stage might be mixed with abscess or glioma. History is of paramount significance at this stage. Very old haematoma appears by CT scan as a slit-like hypodense area with negative mass effect. In general Haematomas are space-occupying with positive mass effect and are commonly surrounded by a hypodense oedema area. The most common sites are the putameno-capsular and the thalamic sites and either of them might rupture intraventricularly. Less common sites includes the parietal lobe, pons and cerebellum. [25] The diagnosis of acute ICH is virtually 100% reliable with non-contrast CT due to the characteristic mass of blood of high attenuation value, due to the presence of the globin component of the haemoglobin molecule. Under exceptional circumstances, patients with profound anaemia, with a haematocrit of 20% or less have presented with an acute haematoma which was isointense to brain on account of the low haemoglobin contents of the fresh haematoma. Fresh blood has an attenuation value of 55-85 Hounsfield units, the high attenuation (50-70 Hounsfield units) is from high protein concentration within intact red blood cells and not iron content. [25] As the fresh clot starts to retract after 24-48 hours from onset, there is serum extrusion around its periphery, resulting in a ring of hypointensity that surrounds the haematoma . In the subacute stage, the haematoma maintains its mass effect but becomes progressively less dense, from the periphery toward the center, until reaching isointensity with the adjacent brain parenchyma. The infusion of intravenous contrast at this stage can demonstrate an area of ring enhancement at the periphery of the haematoma. In the chronic stage, the mass effect of the haematoma is no longer present, post-contrast enhancement has disappeared after about 6 weeks from onset , and the residual is a hypointense cavity, at times in the form of a slit that can be indistinguishable from an area of old cavitated infarction. [25]  More detailed description of the CT scan appearance of brain hemorrhage The CT appearance of hemorrhage is determined by the degree of attenuation of the x-ray beam, which is proportional to the density of hemoglobin protein (relative to plasma concentration) within the hematoma. [25] Immediately following vessel rupture, the hematoma consists of a collection of red blood cells, white blood cells, platelet clumps, and protein-rich serum that has a heterogeneous appearance on CT with attenuation in the range of 30–60 Hounsfield units (HU), depending on the degree of plasma extrusion. In this hyperacute phase, hemorrhage may be difficult to distinguish from normal cortex because of similar attenuation. Over minutes to hours, a fibrin clot forms with an increase in attenuation to 60–80 HU (Fig. 8). Clot retraction and extrusion of serum can further increase attenuation to as high as 80–100 HU in the center of the hematoma. The degree of attenuation may be reduced in patients with severe anemia, impaired clot formation due to coagulopathy, or volume averaging with adjacent tissue. Vasogenic edema evolves around the hematoma within hours and may continue to increase for up to 2 weeks after hemorrhage onset. [25]
  • 8. Figure 8. CT appearance of hemorrhage. Serial CT scans of right thalamic hematoma. (A) Acute ICH in the right thalamus with mean attenuation 65 HU. (B) CT performed 8 days later than (A); the periphery of the hematoma is now isodense to the brain while the center of the hematoma has mean attenuation 45 HU. (C) CT performed 13 days later than (A) shows continued evolution of the hematoma with decreasing attenuation. (D) CT performed 5 months later than (A) shows a small area of encephalomalacia in the location of the previous hemorrhage. Over the following days, cells and protein are broken down and scavenged by macrophages, leading to slowly decreasing attenuation, with the greatest decrease at the periphery of the hematoma and more gradual evolution toward the center (Fig. 9). Within 4 to 9 days, the hematoma attenuation decreases to that of normal cortex, and within 2 to 3 weeks to that of normal white matter. The CT recognition of subacute intracerebral hematoma can be challenging because the attenuation is similar to that of normal brain tissue, although mass effect may still be present. MR imaging can confirm subacute hematoma. As time goes on, attenuation continues to decrease to levels below that of the normal brain. Eventually, the hematoma resolves into a fluid-filled or slit-like cavity that may be difficult to visualize on CT (Fig. 9). Contrast enhancement is not present in the initial days following ICH but may develop at the periphery in weeks to months, sometimes leading to diagnostic confusion with brain tumor or abscess. A blood-fluid level may be seen in medium to large ICH within the first hours after onset; the dependent portion displays higher attenuation due to sedimentation of cellular elements. This finding may be more common in ICH caused by anticoagulation, but it is not specific and has also been described in ICH due to hypertension, trauma, tumor, or arterial-venous malformation. The association with shorter time interval from ICH onset, and in some cases with anticoagulation, has led to speculation that incomplete clotting is required for blood-fluid level formation. Figure 9. CT with blood-fluid level. A 77-year-old woman was admitted with coma of 4 hours' duration. CT scan shows massive left hemispheric hematoma with blood-fluid level. No history of anticoagulation or coagulopathy.     Box 1. As the hemorrhage evolves, different characteristic appearances can be identified on CT, depending on the age of the bleed. CT findings over time are as follows:
  • 9. After 7-10 days, the high density of blood begins to decrease, starting from the periphery of the lesion.  From 1-6 weeks, peripheral enhancement can be seen, mimicking the appearance of an abscess, possibly related to hypervascularity at the periphery of a resolving hematoma or disruption of the blood-brain barrier.  By 2-4 months, decreased density indicates cavity formation. A residual cavity is the final stage, which is reached after complete absorption of necrotic and hemorrhagic tissue.  MR imaging of cerebral hematoma  Physical Factors The appearance of intracranial hemorrhage on MR imaging is influenced by intrinsic factors, such as age, location, and cause of the hemorrhage, as well as extrinsic factors, which include the strength of the magnetic field and the pulse sequence parameters used for imaging. For the purposes of this discussion, the appearance of hemorrhage is examined in five time frames: hyperacute (O to 12 hours), acute (12 hours to 3 days), early subacute (3 days to 1 week), late subacute (1 week to months), and chronic (months to years). Magnetic susceptibility refers to the ability of tissues within a magnetic field to generate their own local magnetic field. When a substance generates a local magnetic field that augments the main magnetic field, it is termed paramagnetic. The number of unpaired electrons within the outer shell of atoms or molecules is responsible for the paramagnetic effect. The greater the number of unpaired electrons, the larger the effect. In the normal afferent cerebral circulation, oxyhemoglobin, which is non paramagnetic (diamagnetic), predominates. When oxyhemoglobin is isolated from an oxygen-rich environment, progressive changes occur that yield three paramagnetic products of hemoglobin: deoxyhemoglobin, followed by methemoglobin, and then hemosiderin. The paramagnetic effects of these three hemoglobin byproducts are in large part responsible for the distinctive MR imaging appearance of the various stages of intracranial hemorrhage, particularly at high field strength (1.5 T). Paramagnetic substances alter the local magnetic environment experienced by individual hydrogen nuclei. When placed within an external magnetic field (the MR scanner), paramagnetic substances generate their own local magnetic field, which is additive to the externally applied field. This situation induces magnetic field inhomogeneity, which affects MR relaxation processes, causing accelerated signal loss because of spin dephasing and loss of transverse coherence (enhanced T2 relaxation). This accelerated signal loss results in decreased signal intensity on T2-weighted images roughly proportional to the square of the field strength of the MR scanner. Therefore, high field MR scanners (1.5 T) are more sensitive for the detection of hemorrhage than low field scanners  MR appearance of intracerebral hemorrhage The physics of MR imaging of hemorrhage is complex; multiple reviews have covered this topic in detail [1,2]. A brief explanation is warranted here, however, because an understanding of the signal characteristics of hemorrhage, as well as their evolution over time, is essential for radiologic interpretation. The MR signal intensity of hemorrhage is dependent on both the chemical state of the iron atoms within the hemoglobin molecule and the integrity of the red blood cell membrane [3]. Iron can be either diamagnetic or paramagnetic, depending on the state of its outer electron orbitals. In the paramagnetic state, it alters the T1 and T2 relaxation times of water protons through magnetic dipole–dipole interactions and susceptibility effects. Dipole– dipole interactions shorten both the T1 and T2 relaxation times but have a greater effect on T1. Susceptibility effect is present when iron atoms are compartmentalized within the red cell membrane, causing magnetic field inhomogeneity, with resulting loss of phase coherence and selective shortening of the T2 relaxation time. After degradation of red cell membranes, the iron becomes more homogenously distributed, and this effect is nullified. Other factors that influence signal characteristics to a lesser extent include protein content, brain edema, oxygen tension, blood–brain barrier breakdown, thrombus formation, and clot retraction [2]. Both the chemical environment surrounding the hemoglobin iron atom and red cell membrane integrity undergo relatively predictable changes after ICH. The following section enumerates these changes in MR signal characteristics during the different phases of ICH evolution (Fig. 10 and Table 1).
  • 10. Figure 10. MR imaging appearance of hemorrhage on T1-weighted (left column) and T2-weighted (right column) sequences for the different stages of hematoma (rows). Examples are selected from various patients. Hyperacute: There is relative isointensity on the T1-weighted and hyperintensity on the T2-weighted sequence of this right occipital hematoma. A small degree of vasogenic edema surrounds the hematoma. On the T2-weighted sequence there is a thin rim of hypointensity that is barely detectable in the periphery; this is caused by susceptibility effect from deoxy-hemoglobin. Acute: The marked hypointensity on the T2-weighted sequence of this left frontal hematoma is caused by susceptibility effect from deoxy-hemoglobin. Early subacute: The hyperintensity on the T1- weighted sequence of this right occipital hematoma is caused by the oxidation of deoxy-hemoglobin to met- hemoglobin. Late subacute: The hyperintensity on the T2-weighted sequence of this large left frontal hematoma results from the loss of susceptibility effect caused by degradation of the red cell membranes. The degree of vasogenic edema is lesser compared with earlier phases. Chronic: A former large right frontal hematoma has resolved into a slit-like cavity with a rim of hypointensity on the T2-weighted sequence caused by hemosiderin deposition.     Table 2. Evolution of MR imaging signal characteristics with time
  • 11. Iron Iron-containing Red cell Phase Time oxidation T1 T2 T2* molecule membranes state Hyperacute Hours Oxyhemoglobin Fe 2+ Intact Hypointense Hyperintense Acute Hours to Deoxyhemoglobin Fe 2+ Intact iso/ Hypointense Hypointense days Hypointense Early Days to 1 Methemoglobin Fe 2+ Intact Hyperintense Hypointense subacute week Late 1 week to Methemoglobin Fe 2+ Degraded Hyperintense Hyperintense subacute months Chronic >months Hemosiderin Fe 2+ Degraded iso/ Hypointense Hypointense Hypointense Abbreviations: Fe, iron; iso, isointense relative to normal brain..  Effect of hematoma evolution on MR imaging appearance of intracerebral hemorrhage  Hyperacute phase The hyperacute phase of the hematoma is seen immediately following extravasation of blood into the brain parenchyma. At this stage the red cell membrane is intact, and the hemoglobin molecule is normally saturated with oxygen (oxy-hemoglobin). Specifically, the iron atoms contained within the heme portions of the hemoglobin molecule are bound to oxygen. This is the only phase of hematoma in which the iron atoms have no unpaired electrons in their outer orbitals and are therefore “diamagnetic,” without exaggerated T1 relaxation or susceptibility effects. The ICH signal characteristics are thus not primarily attributable to iron but instead to the increased spin density of the hematoma relative to uninvolved brain tissue. Hyperacute hematoma appears slightly hypointense or iso-intense on T1-weighted images and slightly hyperintense on T2-weighted images (see Fig. 10); this pattern resembles that of many other pathologic conditions of the brain. Even early in the hyperacute phase, however, there is often deoxy-hemoglobin at the periphery of the hematoma, which appears as a thin rim of T2 hypointensity. This pattern can help differentiate hyperacute hematoma from other brain pathologies [4–5].  Acute phase The acute phase, which begins within hours of ICH, is characterized by deoxy-hemoglobin. Deoxygenation occurs first at the periphery of the hematoma and progresses toward the center. This pattern appears because intrahematoma oxygen tension is lowest in the periphery, where red cells are adjacent to oxygen-starved tissue, and highest in the center, because red cells do not use oxygen for their metabolism. The iron atoms of deoxy-hemoglobin have five ligands and four unpaired electrons and hence are paramagnetic. Susceptibility effect is present because the iron is compartmentalized within intact red cell membranes, resulting in hypointensity on T2-weighted images that is due to increased T2* relaxation (see Fig. 10). Magnetic dipole–dipole interactions are prevented by the three- dimensional atomic structure of deoxy-hemoglobin, which blocks access of water protons to iron atoms. T1 relaxation times are therefore not shortened, and there is iso- or slight hypointensity on T1-weighted images (see Fig. 10). Sometimes a thin rim of T1 hyperintensity can be seen in the periphery of the hematoma, caused by early oxidation of intracellular deoxy-hemoglobin to intracellular met-hemoglobin.  Early subacute phase After several days, the early subacute phase begins. The production of reducing substances declines with failure of red cell metabolism, and the iron atoms are oxidized to the ferric state, Fe3+, to produce met-hemoglobin. Magnetic dipole–dipole interactions can occur because the three-dimensional structure of met-hemoglobin exposes the iron atoms to water protons. This pattern leads to decreased T1 relaxation times and marked hyperintensity on T1- weighted images. Susceptibility effect is present because the red cell membranes remain intact, and hence there is continued hypointensity on T2-weighted images (see Fig. 10).  Late subacute phase Over several days to weeks, the red cell membranes are degraded, and the late subacute phase begins. Susceptibility effect is lost because met-hemoglobin is no longer locally sequestered within red cell membranes; it freely diffuses within the hematoma cavity, resulting in a locally homogeneous magnetic field. This pattern leads to T2*
  • 12. lengthening, and hence to increased hyperintensity, on T2-weighted images (see Fig. 10).  Chronic phase Over the ensuing months, the hematoma enters the chronic phase. The degree of hyperintensity on T1- and T2- weighted images lessens as the concentration of met-hemoglobin decreases with protein breakdown. The center of the hematoma may evolve into a fluid-filled cavity with signal characteristics identical to cerebrospinal fluid, or the walls of the cavity may collapse, leaving only a thin slit (see Fig. 10). As proteins are degraded, the iron atoms become liberated from the heme molecules, scavenged by macrophages, and converted into ferritin, which can be recycled. In most cases, however, the degree of iron deposition overwhelms the recycling capacity, with the excess being locally concentrated in hemosiderin molecules. The iron in hemosiderin does not have access to water protons and therefore exerts only susceptibility effect without significant dipole–dipole interactions, leading to marked hypointensity on T2-weighted images. This hypointensity is seen at the rim of the hematoma cavity and may persist indefinitely. In practice, there is considerable variability in the orderly progression of hematoma signal change over time. The evolution of these signal characteristics may be influenced by a number of factors, including ICH size, oxygen tension, integrity of the blood–brain barrier, the presence of rebleeding, the efficiency of the patient's intrinsic repair processes, and the presence of an underlying lesion such as an arteriovenous malformation or tumor [2]. It is common to see different stages appear simultaneously. For these reasons, “dating” of bleed onset using MR imaging data alone is intrinsically imprecise. SUMMARY SUMMARY Hyperacute Hyperacute hemorrhage refers to a collection of blood in which oxyhemoglobin predominates. Hemorrhage (0 This type of hemorrhage is rarely encountered in the clinical setting because several hours TO 12 Hours) commonly elapse between the onset of hemorrhage and a patient being referred for MR imaging. A hyperacute hematoma may have a nonspecific appearance on MR imaging because oxyhemoglobin is not paramagnetic. Hyperacute hemorrhages can behave similar to other lesions with increased water content and are typically isointense or low signal on Tl-weighted images and high signal on T2- weighted images.With clot retraction in the hyperacute phase, the increased protein content of the hemorrhage results in the lesion being isointense to hyperintense on Tl- weighted images, which can facilitate differentiation from other mass lesions.A hypointense rim along the periphery of a hyperacute hemorrhage was noted ,and this may provide an additional clue to the diagnosis. Hyperacute hemorrhage, however, is more readily identified on CT, which remains the initial examination of choice for its evaluation. Acute In the acute setting, there is clot retraction and resorption of serum. As the hematoma Hemorrhage (12 becomes isolated from the normal cerebral circulation, oxyhemoglobin rapidly deoxygenates Hours to 3 Days) to yield deoxyhemoglobin. The increased protein content of the retracted clot, which is responsible for the high attenuation noted on noncontrast CT, causes the hematoma to be slightly hyperintense relative to low-intensity cerebrospinal fluid (CSF) and slightly hypointense to brain parenchyma on Tl-weighted images. In contrast to CT in the acute setting, which reliably demonstrates high attenuation characteristic of acute hemorrhage, MR imaging findings on Tl-weighted images are relatively nonspecific. T2-weighted images demonstrate a marked decrease in signal intensity because of magnetic susceptibility effects. The signal loss is due to local field inhomogeneity related to paramagnetic deoxyhemoglobin within intact red blood cells.Gradient echo images exaggerate this effect and are often useful for the diagnosis of acute hemorrhage Subacute In the early subacute stage, oxidation of deoxyhemoglobin to methemoglobin occurs within Hemorrhage: intact red blood cells. Methemoglobin is paramagnetic, which results in marked increased Early (3 Days to I signal intensity on Tl-weighted images.Typically the increased signal begins at the periphery of
  • 13. Week) the clot and progresses inward. The differential diagnosis of lesions that demonstrate increased signal intensity on noncontrast TI-weighted images is relatively limited. Fat; substances with elevated protein content (mucus or fluid within certain intracranial tumors, i.e., craniopharyngioma); and paramagnetic moieties, such as melanin, free radicals (within the wall of parenchymal abscesses), and ions including calcium, manganese, and copper, can exhibit high signal intensity on Tl-weighted images. Correlation with the clinical history, morphology, and location of the lesion as well as appearance on other imaging sequences (i.e., T2, gradient echo, and fat suppression) typically allows differentiation from subacute hemorrhage. On T2-weighted images, paramagnetic methemoglobin in intact red blood cells results in low signal intensity similar to that of deoxyhemoglobin. The combination of bright signal intensity on Tl and markedly decreased signal intensity on T2 is relatively specific for paramagnetic substances and, with the appropriate morphology, is highly suggestive of intracranial hemorrhage Subacute The late subacute stage is characterized by lysis of the blood cells. Concurrently, there is Hemorrhage: Late dilution of extracellular methemoglobin and breakdown of the proteinaceous clot. High signal (1 Week to intensity persists on TI-weighted images because of methemoglobin; however, lysis of the red Months) blood cells and the decrease in protein content result in increased signal intensity on T2- weighted images.Bright signal intensity on both Tl-weighted and T2- weighted images is highly specific for hemorrhage . Furthermore, at the periphery of the hemorrhage, early accumulation of hemosiderin and ferritin within macrophages causes a low signal intensity ring, most prominent on T2-weighted images. Chronic stage The hallmark of chronic hemorrhage is low signal intensity on T2-weighted images because of (Months to Years) ferritin and hemosiderin within macrophages, which are the final breakdown products of hemoglobin. The resulting low intensity first appears during the late subacute stage of hematoma evolution at the margin of the lesion. With time, the rim thickens. A collapsed cavity with peripheral areas of low signal intensity on T2-weighted images is the residuum of an uncomplicated intraparenchymal hemorrhage. This appearance can persist indefinitely .  Addendum  A new version of this software is uploaded in my web site every week (every Saturday and remains available till Friday.)  To download the current version follow the link quot;http://neurology.yassermetwally.com/crow.zipquot;.  You can also download the current version from within the publication or go to my web site at quot;http://yassermetwally.comquot; to download it.  At the end of each year, all the publications are compiled on a single CD-ROM, please contact the author to know more details.  Screen resolution is better set at 1024*768 pixel screen area for optimum display REFERENCES References 1. Bradley WG. MR appearance of hemorrhage in the brain. Radiology. 1993;189(1):15–26. 2. Atlas SW, Thulborn KR. Intracranial hemorrhage. In: Atlas SW editors. Magnetic resonance imaging of the brain and spine. 3rd edition. Philadelphia: Lippincott Williams & Wilkins; 2002;. 3. Gomori JM, Grossman RI, Goldberg HI, et al.. Intracranial hematomas: imaging by high-field MR. Radiology. 1985;157(1):87–93. 4. Linfante I, Llinas RH, Caplan LR, et al.. MRI features of intracerebral hemorrhage within 2 hours from symptom onset. Stroke. 1999;30(11):2263–2267.
  • 14. 5. Wintermark M, Maeder P, Reichhart M, et al.. MR pattern of hyperacute cerebral hemorrhage. J Magn Reson Imaging. 2002;15(6):705–709. 6. New PF, Aronow S. Attenuation measurements of whole blood and blood fractions in computed tomography. Radiology 1976;121:635-40. 7. Atlas SW, Thulbom KR. MR detection of hyperacute parenchymal hemorrhage of the brain. Am J Neuroradiol 1998;19:1471-507. 8. Gomori JM, Grossman RI, Goldberg HI, et al. Intracranial hematomas: imaging by high-field MR. Radiology 1985;157:87-93. 9. Wilberger JE, Rothfus WE, Tabas J, et al. Acute tissue tear hemorrhages of the brain: computed tomography and clinicopathological correlations. Neurosurgery 1990;27:208-13. 10. Barnett HJM, Yatsu FM, Mohr JP, Stein BM, eds.: Stroke: Pathophysiology, Diagnosis, and Management. 3rd ed. Churchill Livingstone; 1998. 11. Bradley WG Jr: MR appearance of hemorrhage in the brain. Radiology 1993 Oct; 189(1): 15-26. 12. Broderick JP, Brott T, Tomsick T: Intracerebral hemorrhage more than twice as common as subarachnoid hemorrhage. J Neurosurg 1993 Feb; 78(2): 188-91. 13. roderick JP, Brott TG, Duldner JE: Volume of intracerebral hemorrhage. A powerful and easy-to-use predictor of 30-day mortality. Stroke 1993 Jul; 24(7): 987-93. 14. Challa VR, Moody DM, Bell MA: The Charcot-Bouchard aneurysm controversy: impact of a new histologic technique. J Neuropathol Exp Neurol 1992 May; 51(3): 264-71. 15. Chan S, Kartha K, Yoon SS: Multifocal hypointense cerebral lesions on gradient-echo MR are associated with chronic hypertension. AJNR Am J Neuroradiol 1996 Nov-Dec; 17(10): 1821-7. 16. Fazekas F, Kleinert R, Roob G: Histopathologic analysis of foci of signal loss on gradient-echo T2*- weighted MR images in patients with spontaneous intracerebral hemorrhage: evidence of microangiopathy-related microbleeds. AJNR Am J Neuroradiol 1999 Apr; 20(4): 637-42. 17. Gokaslan ZL, Narayan RK: Intracranial Hemorrhage in the Hypertensive Patient. Neuroimaging Clinics of North America 1992; 2: 171-86. 18. Gomori JM, Grossman RI: Mechanisms responsible for the MR appearance and evolution of intracranial hemorrhage. Radiographics 1988 May; 8(3): 427-40. 19. Nelson JS, Parisi JE, Schochet SS Jr: Principles and Practise of Neuropathology. Mosby - Year Book, Inc. St. Louis, MO; 1993. 20. Robertson CS, Contant CF, Gokaslan ZL: Cerebral blood flow, arteriovenous oxygen difference, and outcome in head injured patients. J Neurol Neurosurg Psychiatry 1992 Jul; 55(7): 594-603. 21. Ruscalleda J, Peiro A: Prognostic factors in intraparenchymatous hematoma with ventricular hemorrhage. Neuroradiology 1986; 28(1): 34-7. 22. Spangler KM, Challa VR, Moody DM: Arteriolar tortuosity of the white matter in aging and hypertension. A microradiographic study. J Neuropathol Exp Neurol 1994 Jan; 53(1): 22-6. 23. Taveras JM, Pile-Spellman J: Neuroradiology. 3rd ed. Williams & Wilkins; 1996. 24. Welch KMA, Caplan LR, Reis DJ, Weir B, Siesjo BK, eds.: Primer on Cerebrovascular Diseases. Morgan Kaufmann; 1997.
  • 15. 25. Metwally, MYM: Textbook of neurimaging, A CD-ROM publication, (Metwally, MYM editor) WEB-CD agency for electronic publication, version 8.4a october 2007