1. Review
Ambient nano and ultrafine particles from motor vehicle emissions:
Characteristics, ambient processing and implications
on human exposure
L. Morawska*, Z. Ristovski, E.R. Jayaratne, D.U. Keogh, X. Ling
International Laboratory for Air Quality and Health, Queensland University of Technology, 2 George Street, Qld 4001, Australia
a r t i c l e i n f o
Article history:
Received 2 June 2008
Accepted 29 July 2008
Keywords:
Ultrafine particles
Vehicle emissions
Environmental pollution
a b s t r a c t
The aim of this work was to review and synthesize the existing knowledge on ultrafine
particles in the air with a specific focus on those originating due to vehicles emissions.
As the first step, the review considered instrumental approaches used for UF particle
monitoring and the differences in the outcomes they provide. This was followed by
a discussion on the emission levels of UF particles and their characteristics as
a function of vehicle technology, fuel used and after-treatment devices applied.
Specific focus was devoted to secondary particle formation in urban environments
resulting from semi volatile precursors emitted by the vehicles. The review discussed
temporal and spatial variation in UF particle concentrations, as well as particle
chemical composition and relation with gaseous pollutants. Finally, the review
attempted to quantify the differences between UF particle concentrations in different
environments. These, as well as other aspects of UF characteristics and dynamics in
the air, were discussed in the context of human exposure and epidemiological studies
as well as in relation to management and control of the particles in vehicle-affected
environments.
Ó 2008 Elsevier Ltd. All rights reserved.
1. Introduction
Ultrafine and nanoparticles present in the air due to
natural sources and processes, as well as those resulting
from anthropogenic activities have attracted an increasing
level of interest in the last decade. Ultrafine particles (UF)
are defined as those with diameters smaller than 0.1 mm,
and their subset, nanoparticles as smaller than 0.05 mm.
Both these terms constitute a somewhat arbitrary classi-
fication of particles in terms of their size, indicating the
significant role of this physical characteristic on particle
fate in the air. Also health and environmental effects of
particles are strongly linked to particle size, as it is the size
which is a determinant (in a probabilistic sense) of the
region in the lung where the particles would deposit or
the outdoor and indoor locations, to which the particles
can penetrate or be transported. In addition, sampling of
particles and choice of an appropriate instrumentation
and methodology is primarily based on particle size.
Airborne concentration of UF and nanoparticles is most
commonly measured and expressed in terms of number
concentrations of particles per unit volume of air, in
contrast to larger particles, which are measured in terms
of mass concentration.
The size of particles, however, depends on the multi-
plicity of sources and processes which lead to their
formation, and therefore, on the material from which the
particles were formed, with the complex scientific knowl-
edge behind these processes still containing many signifi-
cant gaps. The recent interest in UF particles is to a large
extent due to the impact of anthropogenic processes,
* Corresponding author.
E-mail address: l.morawska@qut.edu.au (L. Morawska).
Contents lists available at ScienceDirect
Atmospheric Environment
journal homepage: www.elsevier.com/locate/atmosenv
1352-2310/$ – see front matter Ó 2008 Elsevier Ltd. All rights reserved.
doi:10.1016/j.atmosenv.2008.07.050
Atmospheric Environment 42 (2008) 8113–8138
2. resulting in unprecedented increases in particle concen-
tration, often by one or two orders of magnitude above
their natural concentrations. The most significant are the
various outdoor anthropogenic combustion sources,
including vehicles (and other forms of transport), as well as
industrial and power plants, all utilising fossil fuels.
Another significant combustion source is biomass burning,
including controlled and uncontrolled forest and savannah
fires. There are also indoor combustion sources such as
stoves and heaters utilising fossil fuels and biomass, as well
as tobacco smoking.
The interest in UF particles has resulted in a large body
of literature published in recent years, reporting on various
aspects and characteristics of these particles. Therefore, the
aim of this work was to review and synthesize the existing
knowledge and to draw conclusions as to the picture
emerging with regard to these particles in atmospheric
systems. Out of the two main outdoor anthropogenic
sources, this paper is focused on vehicle emissions, while
the companion paper targets industrial and power plants as
sources of UF particles. Not included in this review is the
contribution of biomass burning (controlled and uncon-
trolled fires), and incineration of refuse to local or global UF
particle concentrations. Both are topics for independent
reviews.
2. Capabilities and limitations of particle
number measurement methods
A full review of the instrumental methods for measuring
of UF particle properties is outside the scope of this review
paper and the reader is directed to several recent publica-
tions addressing this topic, e.g. (McMurry, 2000). However,
it is important to consider the existing methods for particle
number and size distribution measurements, since it is the
very nature of the instrumental method which determines
the measurement outputs and in turn their compatibility
with those obtained utilising different methods. The
majority of the published studies reporting on particle
number and number size distribution applied electrostatic
classifiers (EC) and condensation particle counters
(CPC) manufactured by TSI Incorporated (www.tsi.com),
with a much smaller number using other instruments,
for example GRIMM (www.dustmonitor.com), or air ion
mobility spectrometers, which have enabled measure-
ments down to 0.4 nm (Mirme et al., 2007). The latter
measures only naturally charged particles, and have been
used only in a handful of studies.
When referring to UF or nanoparticles, an unspoken
assumption is made that the instrumental methods used
provide information on particles in the two specific size
ranges (<0.05 and <0.1 mm, respectively). This is possible if
the instrumental method enables measurements of particle
number size distribution, usually in a broader range, from
which the sections of data encompassing UF or nano-
particles is extracted. Such methods are most commonly
based on electrostatic classifiers operating in combination
with particle counters as differential/scanning mobility
particle sizers (DMPS or SMPS, respectively) (Baron and
Willeke, 2001). The lower end of the size window is
determined both by instrumental factors and operator
decisions. In the first instance, the lower size limit is
determined by the capability of the CPC and ranges from 2
to 10 nm. However, most commonly the DMPS/SMPS lower
end of the window is set to a value above this, in the range
from 10 to 20 nm. The reason for setting it up to 10 nm
higher than the achievable lower limit is that this provides
a compromise as to the overall size of the window. Losing
the few nanometres at the lower end enables a significant
extension of the window at the upper end, which in most
cases is a preferable option, unless a study specifically
focuses on the nucleation mode.
If, rather than employing instrumentation for particle
size distribution measurement, only a particle counter is
used, the outcome of the measurement is the total particle
number concentration in the detection size range of the
instrument. There are two important implications of this to
the interpretation of this value as a measure of UF particles.
Firstly, this means that the outcomes of the measurements
are not specifically UF or nanoparticle concentrations,
unless specific inlets are used which restrict the range of
particles entering the detecting arm of the instrument.
While it is true that in most typical environments particle
number concentration is dominated by UF particles, which
is, thus, usually a good approximation of the total particle
number concentration, it is important to keep in mind that
these are not the same, that there are environments where
there are significant particle modes outside the UF range
(see Section 5.1) and therefore the two concentrations
(UF and total number) differ significantly. Secondly, and
even more significantly, the condensation particle counters
often detect particles in the range extending to lower sizes
than the window set by the DMPS/SMPS. This means that
the counters are capable of detecting particles in the earlier
stages of nucleation, and the presence of the nucleation
mode which is below the size detection limit set by the
DMPS/SMPS. Therefore in most situations, the counters
would detect more particles than the DMPS/SMPS, and
significantly more in the environments where a nucleation
mode is frequently present.
The above points are important when comparing particle
number concentrations reported in different papers and
when specifically considering UF or nanoparticles. Since
different studies use different sets of instrumentation and
investigate a different size range window, comparison of the
total particle number concentrations reported should be
conducted with caution. In order to develop at least a broad
understanding of the impact which these differences have
on the measured particle concentrations, data from 52
studies reporting total particle number concentrations for
a range of different environments was compiled and then
the results grouped according to the measurement tech-
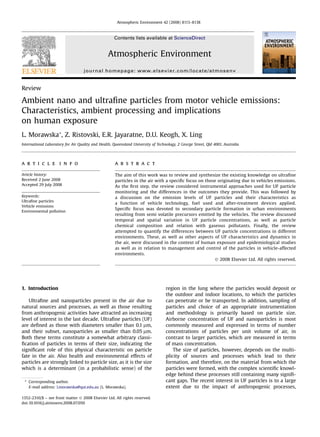
nique used: CPC or DMPS/SMPS (Fig. 1).
The mean concentrations measured by the CPC’s and
DMPS/SMPS’s are 36.8 Â 103
/cm3
and 30.6 Â 103
/cm3
,
respectively, and the median concentrations are 24.9 Â 103
/
cm3
and13.5 Â103
/cm3
, respectively. In other words, the
mean and the median CPC measurements are 32% and 56%,
higher than DMPS/SMPS’s measurements, respectively. The
difference in the means was tested using a Student’s t-test
and found to be statistically significant at a confidence level
of over 99%.
L. Morawska et al. / Atmospheric Environment 42 (2008) 8113–81388114
3. The overall comparison of the differences between the
total particle concentration values measured by CPCs and
DMPS/SMPSs has some shortcomings. In particular, the
differences for specific environments could vary, where
larger differences are expected for environments where
a nucleation mode is present and smaller where aged
aerosol dominates. Moreover, corrections for particle losses
within the two instruments may play a significant role.
Nevertheless, the comparison shows what overall magni-
tude of differences can be expected when comparing
results using these different measuring techniques. It is
important to keep these differences in mind when
attempting to establish quantitative understanding of
variation in particle concentrations between different
environments, which is of significance for human exposure
and epidemiological studies.
It is worth mentioning that large discrepancies have also
been observed when comparing the results of particle
number concentrations measured directly from vehicle
exhaust. While particle volume/mass showed reasonable
reproducibility in between different studies, results of
particle number measurements were difficult to reproduce,
even in the same study. Some artefacts and poor repro-
ducibility in vehicle emission measurements were due not
only to the different instruments used but also to the fact
that the majority of particles (in terms of number) belonged
to the nucleation mode and were formed in the process of
dilution. The number of particles formed in the nucleation
mode is very sensitive to the dilution conditions and any
slight changes (of the dilution temperature, for example)
can result in a significant change in particle number
concentration. A detailed discussion on the effects of
dilution conditions on sampling and measurements of
particle numbers in vehicle emissions can be found in
Kasper (2005). In order to develop a method that could
be used in a reproducible and comparable manner in
laboratories around the world, the UNECE-GRPE Particulate
Measurement Program (PMP) was formed. This program
focused on future regulation of nanoparticle emissions
from light duty vehicles and heavy duty engines with the
goal to amend existing approval legislation to stipulate an
extensive reduction of particle emissions from mobile
sources (Mohr and Lehmann, 2003). Based upon the
recommendation of the PMP, the European Commission
has added a particle number limit to its Euro 5/6 proposed
emission standards for light duty vehicles. Only solid
particles are counted, as volatile material is removed from
the sample, according to the PMP procedure.
3. Sources of particles in natural environment
While the main focus of this review is on the impact of
vehicle emissions on ambient characteristics of UF and
nanoparticles, for completeness, and in order to fully
understand this impact, firstly natural sources and their
contributions are discussed, as they result in the natural
background of the particles in ambient air. Vehicle emis-
sions increase particle concentrations over this background
and result in an overall change of particle characteristics.
Of particular importance in natural environments is the
formation of new particles, of which the main mechanism
is nucleation of low-volatile gas-phase compounds, fol-
lowed by their growth into small particles. It is not the
intention of this review to go into great detail about the
mechanisms of particle formation (both natural and
anthropogenic). For more details on this topic, the reader is
referred to several recent literature reviews (Kulmala et al.,
2004; Holmes, 2007). There were a number of observations
of new particle formation in natural environments ranging
from very clean environments such as the arctic (Birmili
and Wiedensohler, 2000), boreal forests in the northern
hemisphere (O’Dowd et al., 2002; Tunved et al., 2006),
eucalypt forests of Australia (Suni et al., 2007) and a large
number of studies in the coastal areas (see for example
a review by Kulmala et al., 2004). In general, there are
a much larger number of observations from the northern
hemisphere than from the southern hemisphere. Obser-
vations were also made from a variety of platforms ranging
from ground based to ships and aeroplanes. In most of
these observations the measurements were made such that
the platform was not moving along with the same air
parcel. Therefore observations of new particle formation
may be biased by spatial variations of constituents in
different air parcels (Kulmala et al., 2004).
In remote environments particle formation events are
preceded by an increase in the atmospheric concentration
of sulphuric acid, with the increase in the particle number
1
10
100
CPC SMPS
Instrument
103
Particles/cm3
mean
median
Fig. 1. Comparison of reported particle number concentrations measured by
CPC or DMPS/SMPS These CPC and SMPS results were extracted from the
following papers: Aalto et al. (2001), Harrison et al. (1999), Kittelson et al.
(2004) and Shi et al. (2001a) who used both the CPC and SMPS; Vakeva et al.
(1999), Zhu et al. (2004), Imhof et al. (2005a), Paatero et al. (2005) and
Westerdahl et al. (2005) who used only the CPC and McMurry and Woo
(2002), Tuch et al. (1997), Morawska et al. (1999a), Hitchins et al. (2000),
Junker et al. (2000), Jamriska and Morawska (2001), Pitz et al. (2001),
Ruuskanen et al. (2001), Cheng and Tanner (2002), Molnar et al. (2002),
Morawska et al. (2002), Thomas and Morawska (2002), Wehner et al. (2002),
Zhu et al. (2002a,b); Ketzel et al. (2003), Longley et al. (2003), Tunved et al.
(2003), Wehner and Wiedensohler (2003), Gidhagen et al. (2004), Gram-
otnev and Ristovski (2004), Gramotnev et al. (2004), Hussein et al. (2004),
Jamriska et al. (2004), Janhall et al. (2004), Jeong et al. (2004), Ketzel et al.
(2004), Morawska et al. (2004), Stanier et al. (2004a), Gidhagen et al. (2005),
Holmes et al. (2005), Imhof et al. (2005b), Rodriguez et al. (2005), Janhall
et al. (2006), Virtanen et al. (2006), Wahlin et al. (2001), Woo et al. (2001b),
Abu-Allaban et al. (2002), Laakso et al. (2003), Hussein et al. (2005a) and
Mejia et al. (2007a) who used only the SMPS. Other studies, such as (Hameri
et al., 1996; Kaur et al., 2006), which measured particle concentration
without using a CPC or SMPS (e.g. P-trak etc.) were not included in Fig. 1, nor
were the four tunnel studies (Abu-Allaban et al., 2002; Gouriou et al., 2004;
Jamriska et al., 2004; Imhof et al., 2005b) (see comments in relation to
tunnels in Section 8.4 ).
L. Morawska et al. / Atmospheric Environment 42 (2008) 8113–8138 8115
4. occurring about 1–2 h after an increase in sulphuric acid
was measured (Weber et al., 1997). This is followed by
a relatively small particle growth rate between 1 and
2 nm hÀ1
(Weber et al., 1996; Marti and Weber, 1997;
Weber et al., 1997; Birmili and Wiedensohler, 2000). These
events showed a linear relationship between the number
of newly formed particles and the production rate of
sulphuric acid indicating the importance of sulphuric acid.
The question still remains: Is the binary nucleation solely
responsible for the formation of these particles or is a third
species such as ammonia or an organic involved? Birmili
and Wiedensohler (2000) estimated that the concentration
of sulphuric acid needed to achieve the same nucleation
rates through binary nucleation was over two orders of
magnitudes higher than that measured. Napari and Noppel
(2002) using their observations and parameterisation of
the ternary nucleation rate with an atmospheric ammonia
concentration of 20 pptv and the measured sulphuric acid
concentration obtained good agreement with the observed
nucleation rates.
In forests the sources of new particle formation are
different. The mechanisms responsible for the formation
and growth of these particles are still uncertain. Although
sulphuric acid is one of the most likely candidates thought
to be responsible for the formation of the initial nano-
meter-sized particles (Riipinen et al., 2007), sulphur
chemistry does not sustain enough sulphuric acid in
the atmosphere to explain more than a small fraction of the
observed particle size growth rate. To explain the observed
growth, which is up to a diameter of 50–100 nm, other
compounds are required. O’Dowd et al. (2002) showed that
particle formation can commonly occur from biogenic
precursors. A recent study by Tunved et al. (2006) showed
a direct relation between emissions of monoterpenes and
gas-to-particle formation over these regions which were
substantially lacking in anthropogenic aerosol sources.
Therefore, secondary organic aerosol formation from
monoterpenes is an important source in these environ-
ments. Further, the authors show that the forest provides
an aerosol population of 1–2 Â 103
cmÀ3
of climatically
active particles during the late spring to early fall period,
presenting a substantial source of global importance.
Proposed particle production mechanisms in the marine
environment include the seawater bubble-burst process
(O’Dowd et al., 2004), ternary nucleation producing a reser-
voir of undetectable particles upon which vapours can
condense (Kulmala et al., 2000), free tropospheric produc-
tion with mixing down to the boundary layer (Raes, 1995),
and the generation of coastal iodine particles from macro-
algal iodocarbon emissions (Raes,1995; Kulmala et al., 2000;
O’Dowd et al., 2004; O’Dowd and Hoffmann, 2005). While
iodine-containing particles were found in large numbers at
Mace Head research station in Ireland, they are not likely to
play an important role globally (McFiggans, 2005). Wind-
produced bubble-burst particles containing salt are ubiqui-
tous in the marine environment (Ayers and Gras, 1991), but
these represent less than 10% of particle numbers. The
majority of particles are much smaller than these salt
particles and their origins remain only partially explained.
Several conclusions can be derived from this brief
review. Firstly, particles are formed in the environment due
to natural processes and therefore are always present at
some background concentration levels. Therefore, when
considering particle concentrations in urban environments
it is important to compare them to the background levels in
order to assess the magnitude of the anthropogenic
impacts (see Section 8.2). Secondly, the mechanisms of new
particle formation exhibit similar complexities in both
types of environments (natural and vehicle affected),
strongly depend on local meteorological factors, and
therefore a complete picture of the dynamics of particle
formation in urban environments must include all factors
involved. These issues are further discussed in Section 5.2.
4. Vehicle emissions as a source of ultrafine particles
4.1. Introduction
As discussed previously, many studies have conclusively
shown that motor vehicle emissions constitute the major
source of ultrafine particle pollution in urban environments
(Harrison et al., 1999; Shi and Harrison, 1999; Shi et al.,
1999; Shi et al., 2001a; Wahlin et al., 2001). Particles
emitted from diesel engines are in the size range
20–130 nm (Kittelson, 1998; Morawska et al., 1998a; Harris
and Maricq, 2001; Ristovski et al., 2006) and from petrol
engines in the range 20–60 nm (Harris and Maricq, 2001;
Ristovski et al., 2006). Therefore, it is not surprising that
a large fraction of the particle number concentration in
urban air is found in the UF size range (Morawska et al.,
1998b). Overall, it has been shown that in urban environ-
ments the smallest particles make the highest contribution
to the total particle number concentrations, while only
a small contribution to particle volume or mass. A US study
by Stanier et al. (2004a) showed that 25% of the aerosol
number is less than 10 nm and 75% of the aerosol number is
less than 50 nm. Similarly Woo et al. (2001b) showed that
26% of particle number is smaller than 10 nm and 89%
smaller than 100 nm. Zhang et al. (2004b) showed that the
number concentrations of particles the size ranges of
0.011–0.050 mm and 0.011–0.1 mm accounted for approxi-
mately 71% and 90%, respectively, of the total number
concentration. However, particles smaller than 0.050 mm
contributed only 3% to the total volume concentration,
while the largest contribution of 87% was from particles
larger than 0.1 mm. In Europe Junker et al. (2000) found that
the highest in terms of number were concentrations of
particle <0.1 mm, averaging between 82 and 87% of the total
particle numbers <0.421 mm while the accumulation mode
(0.1–2.8 mm) made up for most of the particle mass
(mean > 82%). Shi et al. (2001a) showed that particles
smaller than 10 nm contributed more than 36–44% of the
total particle number concentration in an urban roadside
location and particles within the size range 3–7 nm
accounted for 37% of total measured particles. Charron and
Harrison (2003) showed that particles ranging from 11 to
100 nm represent from 71% to 95% (median 88.7%) of the
particle number between 11 and 450 nm. Pirjola et al.
(2006) reported that in winter in Helsinki, Finland, 90–95%,
and in summer, 86–90% of particles were smaller than
50 nm, while Virtanen et al. (2006) estimated for the same
data set that particles smaller than 63 nm made up w90%
L. Morawska et al. / Atmospheric Environment 42 (2008) 8113–81388116
5. of particles in the winter and w80% of particles in summer.
Peak concentrations often exceeded 2 Â 105
cmÀ3
and
sometimes reached 1 Â106
cmÀ3
. In Australia, Mejia et al.
(2007a) showed that UF contributed to 82–90% of the
particle number and nanoparticles to around 60–70%,
except at a site mainly influenced by heavy duty diesel
vehicles, where the nanoparticle contribution dropped to
50%.
A large fraction of these ultrafine particles come from
heavy duty diesel vehicles. Kirchstetter et al. (1999)
measured particle emissions from light and heavy duty
vehicles in a roadway tunnel and showed that heavy
duty diesel trucks emitted 24, 37 and 21 times more fine
particles, black carbon and sulphate mass per unit fuel
mass burned than light duty vehicles. Heavy duty vehicles
also emitted 15–20 times the number of particles per unit
mass of fuel burned compared to light duty vehicles. In
general, a heavy duty diesel truck or bus exhibits particle
number emission factors that are one to two orders of
magnitude larger than a typical petrol car (Morawska et al.,
2005; Ristovski et al., 2005; Ristovski et al., 2006). The only
exception was observed by Graskow et al. (1998) who
found that when petrol vehicles were driven at higher
velocities (w120 km hÀ1
) or with higher loads, i.e. during
acceleration, the particle number emissions from petrol
vehicles came close to that observed from diesel vehicles.
In general, particles from vehicle emissions can be divided
into two broad categories, depending on the location of their
formation. They can be formed in the engine or tailpipe
(primary particles) or they can be formed in the atmosphere
after emission from the tailpipe (secondary particles).
4.2. Primary particles
Primary particles are generated directly from the engine
and are mostly submicrometer agglomerates of solid phase
carbonaceous material ranging in size from 30 to 500 nm
and residing mainly in the accumulation mode. They
may also contain metallic ash and adsorbed or condensed
hydrocarbons and sulphur compounds. Metallic ash is
generally derived from lubricating oil additives and from
engine wear. The size distribution of particles in the accu-
mulation mode are very well represented by lognormal
distributions, with an almost constant standard deviation
of 1.8–1.9 (Harris and Maricq, 2001), and it does not vary
significantly between measurements from a given vehicle
under different operating conditions. Repeated measure-
ments from a diesel engine, in particular, can be very
consistent (Kasper, 2005; Ristovski et al., 2006). For this
reason, the primary solid particle number limit has been
added to the European Commissions proposed Euro 5/6
emission standards for light duty vehicles.
4.3. Secondary particles
As the hot exhaust gases are expelled from the tailpipe of
a vehicle, they cool and condense to form large numbers of
very small particles in the air. They are volatile and consist
mainly of hydrocarbons and hydrated sulphuric acid. These,
so-called secondary particles, are generally in the nano-
particle size range below 30 nm and compose the nucleation
mode, which have been commonly observed near busy
freeways, especially carrying a large fraction of heavy duty
diesel vehicles (Harrison et al., 1999; Kittelson et al., 2002;
Charron and Harrison, 2003; Sturm et al., 2003; Gramotnev
and Ristovski, 2004; Zhu et al., 2004; Rosenbohm et al., 2005;
Westerdahl et al., 2005; Ntziachristos et al., 2007). They have
also been observed in on-road studies, such as when avehicle
is being followed by a mobile laboratory (Vogt et al., 2003;
Kittelson et al., 2004, 2006a; Pirjola et al., 2004; Gieshaskiel
et al., 2005; Ronkko et al., 2006; Casati et al., 2007). However,
while sometimes present, they are not commonly observed
in dynamometer measurements where dilution tunnels are
used to cool and dilute the exhaust gases (Rickeard et al.,
1996; Khalek et al., 1999, 2000; Kittelson et al., 2006a;
Ristovski et al., 2006).
It has been shown that the conditions necessary for the
production of these volatile nanoparticles are strongly
affected by the dilution conditions such as the dilution rate,
dilution ratio, temperature and residence time (Khalek
et al., 1998, 1999; Shi and Harrison, 1999; Khalek et al.,
2000; Kawai et al., 2004; Mathis et al., 2004; Kasper, 2005).
Lyyranen et al. (2004) investigated particle number
distributions obtained from a turbo-charged diesel off-road
engine using several different dilution systems and
concluded that nucleation modes were observed when the
dilution process involved rapid cooling and mixing of the
exhaust. Casati et al. (2007) measured particle emissions
from a diesel passenger car in field and laboratory
conditions and concluded that the nucleation mode was
strongly affected by dilution conditions and decreased
when the exhaust was more diluted.
Similarly, on-road dilution of the exhaust plume is very
important in the generation of secondary particles in the
exhaust plume. Ronkko et al. (2006) studied particle size
distributions in emissions from an on-road heavy duty
diesel vehicle and demonstrated that the formation of the
nucleation mode 5 m behind the vehicle was favoured by
low ambient temperatures and high relative humidity. For
smaller distances no nucleation modes were observed
neither by Ronkko et al. (2006) or Morawska et al. (2007b)
for a diesel vehicle. During on-road measurements using
light duty spark ignition (SI) vehicles, Kittelson et al.
(2006b) did not observe a significant particle signature
above background under highway cruise conditions. Much
higher number emissions were observed during accelera-
tion, at high-speed cruise, and during cold starts.
In addition to the dilution and cooling effects, there is
another factor that plays an important role in determining
the concentration of secondary particles. The gaseous
precursors condense or adsorb on to the surface of carbon
particles in the accumulation mode. If the concentration of
carbon particles is low, the gases will nucleate homoge-
neously, giving rise to large concentrations of volatile
nanoparticles. This has been clearly observed with diesel
vehicles equipped with particle filters (Burtscher, 2001),
where the accumulation mode has been removed by the
particle filter leading to large nucleation modes. The
presence of a large accumulation mode will act to suppress
the formation of the nuclei mode because the carbonaceous
agglomerates scavenge volatile material reducing the
likelihood of nucleation. Older vehicles with excess soot
L. Morawska et al. / Atmospheric Environment 42 (2008) 8113–8138 8117
6. emissions are less likely to exhibit nucleation modes.
Therefore, the number concentration of the nucleation
mode particles, unlike the accumulation mode particles, is
highly unstable and unpredictable. Further, as in some
instances, as many as 90% of the total particle number may
occur in the nucleation mode, total particle number
emissions from similar types of motor vehicles may vary by
over an order of magnitude (Ristovski et al., 2004).
4.4. Role of fuels
Particle emissions from motor vehicles are significantly
affected by the nature of the fuel used and thus a consid-
erable effort is being devoted to investigations of fuel
properties and their impacts on particle emissions.
Sulphur in diesel fuel: The main source of chemically
bound sulphur in diesel fuel is that which occurs naturally in
crude oil and is in a volatility range which leads to its
incorporation in the diesel fuel fraction. The presence of
sulphur is useful as it increases the lubricating properties of
the fuel. During combustion, a fraction of this sulphur is
oxidised to sulphur trioxide which binds with water to form
sulphuric acid that contributes to total particle emissions.
However, the presence of sulphur in diesel has several other
adverse effects such as the corrosion of the exhaust system
and increased wear and tear on engine parts. For these
reasons, measures have been taken to progressively reduce
the sulphur content in diesel fuel worldwide. Currently,
most industrialised countries use diesel fuel with a sulphur
level of 5–50 ppm. In addition, it should be noted that
sulphur compounds are also present in lubricating oils.
Several studies were conducted to investigate the effect
of reducing the sulphur content in diesel on particle
number emissions. Bagley et al. (1996) found a significant
reduction of the number of nuclei mode particles from
a heavy duty engine when the sulphur levels were reduced
from 3200 ppm to 100 ppm. Andersson et al. (2001)
investigated three heavy duty vehicles using diesel fuel of
three sulphur levels: 340 ppm, 53 ppm, and less than
10 ppm, and showed that, while changes in accumulation
mode particles could be attributed to changes in engine
technology, the variation in nanoparticle number was more
likely influenced by fuel properties. The fuel containing the
highest sulphur content (340 ppm) showed the highest
nanoparticle emissions for the ‘weighted cycle’ (where
each stage of the cycle was weighted according to the time
it contributed to the overall cycle), while the fuel with the
lowest sulphur content (<10 ppm) shared the lowest. They
also concluded that the influence of the fuel sulphur
content could not be fully decoupled from other chemical
and physical effects within the tested fuels, such as the total
aromatic content which varied between the fuels.
Ristovski et al. (2006) reported particle emissions from
a fleet of twelve in-service buses fuelled by 50 and
500 ppm sulphur diesel at four driving modes on a chassis
dynamometer and showed that particle number emission
rates were 30–60% higher with the 500 ppm over the
50 ppm fuel. Most of the excess particles were smaller than
50 nm and resided in the nucleation mode.
Kittelson et al. (2002) measured nanoparticle emissions
from a diesel engine on a dynamometer using fuels with
three different levels of sulphur (1, 49 and 325 ppm) and two
different lubricating oils (4000 ppm and 385 ppm sulphur).
They observed that for conventional lubricating oil (385
ppm) and both 1 ppm and 49 ppm sulphur fuel, there was no
significant formation of a nucleation mode. Increasing fuel
sulphur to 325 ppm increased nanoparticle emissions,
especially at high engine load. Sulphate particles are formed
at high temperature conditions, such as at full engine load
when more of the fuel sulphur is converted to sulphuric acid.
When present, most of the nucleation mode particles were
removed when passed through a thermodenuder, suggesting
that they were highly volatile. Other researchers have
observed nucleation mode particles even with very low
sulphur levels (<10 ppm) (Vaaraslahti et al., 2004) suggest-
ing that other components, such as unburned hydrocarbons,
can have an important role. At the low levels of sulphur in the
fuel the amount of sulphur in the lubricating oil can have
a major influence. The most surprising result was the large
influence of specially formulated lubricating oil (Kittelson
et al., 2002). Contrary to expectations, low sulphur oil led to
an increase in nanoparticle formation in nearly all cases. It is
possible that the increase in nanoparticle formation when
using low sulphur oil was related to the formulation of the oil
necessary to compensate for the removal of sulphur. It could
also be due, in part, to the release of volatile components
from the oil, related to the lack of oil break-in. Lubricating oil,
unburned hydrocarbons from the fuel, as well as PAH’s, could
also play critical role in the formation of the nucleation mode
(Kittelson et al., 2002; Sakurai et al., 2003; Vaaraslahti et al.,
2005; Ristovski et al., 2006). On the other hand, Vaaraslahti
et al. (2005) have observed clear correlation between the
lubricating oil sulphur content and nanoparticle formation
only when the engine was equipped with a continuously
regenerating diesel particulate filter (CRDPF).
Alternative fuels: Liquefied petroleum gas (LPG) is
generally perceived to be a cleaner fuel than unleaded petrol
(Gamas et al., 1999). Ristovski et al. (2005) found that
particle number emissions from LPG cars were up to 70% less
than from similar unleaded petrol cars. Compressed natural
gas (CNG) vehicles are known to emit considerably lower
particle mass than equivalent diesel vehicles. However,
there is considerable disagreement as to particle number
emission levels. This is due to the small number of
measurements reported and the difficulties in quantifying
the effects of engine operating and testing conditions and
fuel and lubricating oil composition on secondary particle
production. In relation to buses, it has been shown that, in
general, particle number emissions from CNG buses are
smaller than from diesel buses, but there are some excep-
tions, particularly related to high engine load conditions
where large nuclei modes (<10 nm) and ultrafine particle
number concentrations have been observed (Holmen and
Ayala, 2002). In addition, the nuclei mode particles observed
at high loads are highly volatile (Meyer et al., 2006).
4.5. Role of after-treatment devices
There are two main particulate matter control technol-
ogies in use today. They are oxidation catalysts and particle
traps.
L. Morawska et al. / Atmospheric Environment 42 (2008) 8113–81388118
7. Oxidation catalysts: While oxidation catalysts reduce
the soluble organic fraction (SOF), they have little effect
on the soot or black carbon in the exhaust. Still, some
reduction in particle mass emissions is achieved through
the removal of the SOF. The maximum total particle mass
reduction is dependent on the magnitude of the SOF
compared to the carbonaceous portion in the engine-out
exhaust, and is usually between 20% and 30% (Harayama,
1992). The sulphate fraction of diesel particles (SO4) is
increased in the diesel oxidation catalyst, due to the
oxidation of SO2 with subsequent formation of sulphuric
acid. Under certain conditions, however, the SOF
decrease can be more than off-set by an increase of
sulphate particle mass, leading to an overall increase in
total particle mass emission. In general, the effect of
oxidation catalysts on particle number emissions is often
unpredictable. Total particle number concentrations,
especially in diesel emissions, are attributed primarily to
nucleation mode particles which are composed mostly of
hydrocarbon and sulphuric acid condensates. If the
catalyst removes hydrocarbons (gas phase and SOF), it
will prevent their subsequent nucleation, thus reducing
the particle number concentrations. If, however, the
catalyst produces sulphates, an effect more prominent
with high sulphur fuels, and more active noble metal
catalysts, the observed particle number concentrations
may be higher than with no catalyst due to sulphuric
acid nucleation (Vogt et al., 2003).
Particle traps: Particle traps are very effective in
controlling the solid fraction of exhaust particles,
including elemental carbon (soot) and the related black
smoke emissions. The filtration efficiencies of some
commercially available diesel particle traps frequently
exceed 90%. In light duty vehicles, Mohr et al. (2006)
showed a high efficiency of diesel particle filters (DPFs) in
curtailing non-volatile particle emissions over the entire
size range. High emissions were observed only during
short periods of DPF regeneration and immediately
afterwards. However, they have limited effectiveness in
controlling the non-solid fractions of particle mass, such
as the SOF or sulphate particles that occur mainly in the
liquid phase within the hot and humid emissions. For
this reason, trap systems designed to control the total
particle mass emission are likely to incorporate additional
functional components targeting the SOF emission (e.g.
oxidation catalysts). More recently, the introduction of
ultra low sulphur diesel has helped to improve the effi-
ciency of abatement devices, many of which are poisoned
by sulphur. Emissions from diesel fuels containing sulphur
levels of less than about 12 ppm will not poison these
devices. Very often, volatile material pass through particle
traps and nucleate to form nanoparticles that increase the
total particle number. To make matters worse, by retain-
ing carbon particles, the trap removes the material, which
otherwise acts as a ‘‘sponge’’ for condensates formed in
the sampling system. Therefore there is a possibility that
in some cases particle traps can increase the formation of
nanoparticles through nucleation. In effect, particle traps
reduce the numbers of solid agglomeration mode parti-
cles by replacing them with liquid nucleation mode
nanoparticles (Burtscher, 2001).
Vaaraslahti et al. (2004) have observed that in heavy duty
vehicles at high loads nucleation mode particles form only
when the engine is equipped with a continuously regener-
ating diesel particulate filter (CRDPF). The tests were
conducted with two fuels of 2 and 40 ppm sulphur content
and the nucleation mode correlated with the sulphur level in
the diesel fuel. In a later publication, Vaaraslahti et al. (2006)
show that the formation of nucleation modes in heavy duty
engines with CRDPF is positively correlated not only with
the fuel sulphur level but also with the lubricant sulphur
level, suggesting that sulphuric compounds are the main
nucleating species in this situation. Formation of nucleation
mode particles was also observed on a heavy duty vehicle
equipped with a continuously regenerating trap (CRT)
during on-road highway cruise conditions (Kittelson et al.,
2006). The CRT has reduced the concentrations of accumu-
lation mode particles to levels indistinguishable from
background while increasing the emissions of particles in
the nucleation mode. Similar to the observation by
Vaaraslahti et al. (2004) the increased emissions of nano-
particles was observed at higher engine loads when
the exhaust temperature increased above about 300
C
therefore increasing the conversion of SO2 emitted by the
engine to SO3.
However, the toxicity of these particles has recently been
brought into question. Grose et al. (2006) showed that
nucleation mode particles emitted by a heavy duty diesel
engine equipped with a catalytic trap are composed mainly
of sulphates. This provides support for the argument that
particulate emissions from diesel vehicles equipped with
advanced particulate control devices might be less toxic
than typical uncontrolled diesel emissions, which contain
high concentrations of organic compounds. However, due to
the complexity of diesel exhaust and the fact that sulphuric
acid enhances polymerisation of organic compounds, as well
as solubilises metals, further toxicology studies are required
to evaluate the toxicity of these particles.
4.6. Role of ions
The mechanisms behind particle nucleation in the
atmosphere have been discussed in Section 3, and in
particular the role of binary homogeneous nucleation of
sulphuric acid and water or ternary homogeneous nucle-
ation involving sulphuric acid, water and ammonia.
Theoretical models and experimental observations show
that binary homogeneous nucleation alone cannot explain
the observed formation and growth rates of particles in the
environment and, while ternary nucleation can explain
observed nucleation rates in urban areas, it does not assist
in explaining the rates observed in other environments that
do not contain sufficiently high concentrations of sulphuric
acid (Weber et al., 1996; Clarke et al., 1998; Yu, 2001;
Kulmala, 2003; Alam et al., 2003). However, neither
mechanism is capable of explaining the observed growth
rates of ultrafine particles to cloud condensation nuclei
(CCN) sizes. For example, Weber et al. (1997) demonstrated
that growth rates of nanoparticles driven by binary and
ternary nucleation is an order of magnitude too low to
explain the rapid appearance of fresh ultrafine aerosols
during midday. Alam et al. (2003), while noting similar
L. Morawska et al. / Atmospheric Environment 42 (2008) 8113–8138 8119
8. observations at urban sites showed that particle formation
by homogeneous nucleation occurred on approximately 5%
of the days studied and required condensable materials
apart from sulphuric acid and water, together with
a relatively low pre-existing particle surface area.
An alternative mechanism of particle formation is ion-
induced nucleation. It has been shown that ion-induced
nucleation occurs at a lower saturation ratio than homo-
geneous nucleation (Hara et al. 1997, 1998). Homogeneous
nucleation can only occur spontaneously in highly super-
saturated air. These conditions do not occur naturally in the
atmosphere. However, homogeneous nucleation is aided
by ions as gas molecules tend to condense and cluster
around them. Yu and Turco (2000, 2001) showed that
charged molecular clusters can grow significantly faster
than neutral clusters and achieve stable observable sizes.
Thus, this mechanism can operate under conditions that
are unfavourable for binary or ternary nucleation. However,
in a recent paper based on results from a study conducted
in Hyytiala, Southern Finland, Kulmala et al., (2007) has
argued that ion-induced nucleation cannot explain the
large number of neutral clusters that were observed, sug-
gesting that ternary, and not ion-induced, nucleation was
probably the dominant process taking place in this Boreal
forest environment. On the other hand, Yu and Turco
(2008) used a global chemical transport model to show that
ion-induced nucleation was an important global source of
tropospheric aerosols. From these studies, it is clear that
the relative importance of ion-induced nucleation and
neutral nucleation under varying atmospheric conditions
remains largely unresolved.
Environmental ions are formed naturally by cosmic rays
at a rate of about 2 ion pairs cmÀ3
sÀ1
, while the main
anthropogenic source of ions is combustion. The ion
concentration falls off rapidly with distance from the source
due to recombination. Ions generated from hydrocarbon
flames play an important role in the formation of
nanoparticles (Yu, 2001). Positively charged ions have been
detected in concentrations of up to 1.6 Â 108
cmÀ3
in jet
engine plumes (Arnold et al., 2000) and these might play
a key role in the formation of volatile particles in the aircraft
wake (Yu and Turco, 1997). Also motor vehicle combustion
is a significant source of ions that may play an important
role in the formation of nanoparticles via ion-induced
nucleation during the dilution and cooling of the hot
emissions in air, especially in urban environments.
Kittleson et al. (1986) monitored electric charges present on
diesel emission particles and they showed approximately
equal numbers of positively and negatively charged
particles with 1–5 units of elementary charge per particle.
The charge distribution with respect to size followed
a Boltzmann equilibrium relationship equivalent to 1500 K.
Yu et al. (2004) measured the ionic emissions from
a petrol car and a diesel generator engine. They found that
the total ion concentrations from the two engines were
about 3.3 Â 106
cmÀ3
and greater than 2.7 Â 108
cmÀ3
,
respectively. Maricq (2006) studied the electric charge of
particles in petrol and diesel vehicle exhaust using single
and tandem differential mobility analysis. This method
provided the means to sort the particles according to both
their size and charge. About 60–80% of the particles were
charged but with nearly equal numbers of positive and
negative charge, leaving the exhaust electrically neutral.
Charge increased with particle size, up to about Æ4 units of
charge per particle. At a fixed particle size, charge per
particle followed a Boltzmann distribution with tempera-
ture range 800–1100 K. Jung and Kittleson (2005) used an
electrostatic filter and an SMPS to examine the charged
fraction of diesel particles as a function of their size. They
showed that the diesel nanoparticles carried very little
charge, while there was a large charged fraction of 60–80%,
in the accumulation mode. In summary, these results show
that vehicles emit ions of both signs, with the majority of
the charges being carried on the larger particles.
4.7. Road-tyre interface
So far, tyre wear on the road has been considered to
contribute mainly larger size particles (10 mm) in the air
(Pierson and Brachaczek,1974). A recent study by Dahl et al.
(2006) showed, however, that road–tire interface can also
be a source of submicrometer particles. The study
conducted in a road simulator showed that the mean
particle number diameters were between 15 and 50 nm.
The emission factor increased with increasing vehicle
speed, and varied between 3.7 Â 1011
and 3.2 Â 1012
parti-
cles vehicleÀ1
kmÀ1
at speeds of 50 and 70 km hÀ1
, which
corresponds to between 0.1 and 1% of tail-pipe emissions in
real-world emission studies. The authors hypothesised that
the particles may originate from three components of the
tires: (i) the carbon black reinforcing filler, (ii) small
inclusions of excess ZnO or ZnS (ZnO is an activator for
organic accelerators that are used to speed up the vulca-
nization process), (iii) the oils used as softening fillers. The
authors suggested that since speed determines the amount
of mechanical stress in the tire material it also determines
the temperature in the tire, and increased temperature in
turn leads to increased emissions of loosely bound rein-
forcing filler material and evaporation of semi-volatile
softening oils. Clearly more research is needed on this topic.
4.8. Emission factors and emission inventories
Emission factors: An emission factor is the amount of
pollutant emitted either when an activity is performed, for
example, a vehicle drives a kilometre; or the amount of
pollutant emitted per unit of fuel burned. Emission factor
values are used for developing inventories for gaseous or
particulate motor vehicle emissions, however in order to
derive them many issues need to be considered and
resolved. In particular, they depend on motor vehicle type,
fuel used, engine load, after-treatment devices fitted, road
type, travel speed, road grade and local meteorological
conditions. Current methods for deriving emission factor
values range from measurement of single vehicles, to
vehicle fleets using direct methods, such as measurements
on a dynamometer, on or near roadways or in tunnels, or
indirect methods such as estimates based on remote
sensing or fuel consumption, particularly in relation to UF
particles. In addition, a wide range of different instru-
mentation are used that measure different size ranges
(as discussed in Section 2). As a result, there are a lot of
L. Morawska et al. / Atmospheric Environment 42 (2008) 8113–81388120
9. different values of emission factors published, on different
types of measurements, in different parts of the world. This
leads to the question as to which values should be used in
quantifying and modelling traffic emissions.
Statistical analysis of particle number emission factors
around the world: A detailed analysis by Keogh et al.
(submitted for publication) that included statistical anal-
ysis of more than 160 particle number emission factors
relating to motor vehicle tailpipe emissions revealed that
emission factor values estimated from CPC measurements
produced the highest mean values for Fleet, Heavy Duty
Vehicle (HDV) and Light Duty Vehicles (LDV) of 7.26, 65 and
3.63 Â 1014
particles per vehicle per kilometre, respectively.
The mean Diesel Bus emission factor value relating to
measurements using the SMPS was found to be 3.08 Â 1014
particles per vehicle per kilometre.
The review found that there is a significant difference
between the means for measured particle number for CPC
and SMPS instrumentation (23 and 2 Â 1014
particles per
vehicle per kilometre, respectively); but no significant
difference between the means of particle number emission
factors for studies conducted in different countries
(Australia, Austria, Germany, Sweden, Switzerland, United
Kingdom, USA), nor between those for studies conducted
on a dynamometer, or near roadways. Particle number
emission factors for HDV were found to be significantly
higher than the corresponding values from Fleet and LDV.
The range of particle number emission factors reported
in four studies, that measured nanoparticle and ultrafine
subclasses using the SMPS and DMPS (Gidhagen et al.,
2003; Imhof et al., 2005a,b; Jones and Harrison, 2006), are
summarised in Table 1, where the range given represents
the sum of the ranges taken from the four studies. Exami-
nation of this table highlights the importance of measuring
size ranges 18 nm, where particle numbers tend to be
more prolific, and in which the emission factor values are
generally larger than those estimated for 18–50 nm and
18–100 nm.
Inventories of motor vehicle particle emissions: Estimates
of emission inventories for particle number concentration
are not available (Jones and Harrison, 2006); nor does there
exist a comprehensive inventory of vehicle particle emis-
sions covering the full size range emitted by motor vehicles.
The one reported inventory is the assessment conducted by
Airborne Particles Expert Group (1999). For this assessment
emission trends for the years 1970–1996 including inven-
tories for PM2.5, PM1 and PM0.1 were estimated based on
PM10 UK monitoring data, using mass fractions in this size
range available for different emission sources and fuel
types and 33 particle number size distribution spectra. It
was shown that in all size fractions, vehicle emissions are
the major contributor, compared with all other combustion
and non-combustion sources in urban areas. With
decreasing particle size, the contribution of road transport
to the total emissions increases and for PM0.1 reaches 60%.
Contributions from other combustion sources tend to
decrease with decreasing particle size. One of the conclu-
sions from the data presented in the report is that there
was a significant decrease in emissions in the PM10 and
PM2.5 ranges during the investigated period of time, less in
the PM1 range and very little in the PM0.1 range. This could
be related to the lack of strategies for decreasing emissions
of the UF particles. More effort is needed towards compi-
lation of vehicle emission inventories for UF particles.
5. Transport of particles within urban scale
and ambient processing
Vehicle emissions are highly dynamic and consist of
reactive mixtures of hot gases and particles. The main
factor determining the speed and direction of the pollutant
plume away from the emission site is generally the preva-
lent wind. Other contributing factors include the initial
speed of the pollutants emitted from vehicles, turbulence
caused by vehicle motion, location of the exhaust, precip-
itation and the topography of the area. The pollutant plume
undergoes dilution with ambient air and is subject to
a range of physical and chemical processes, which change
its chemical composition, physical characteristics and
concentration in the air during the transport process. Also,
soon after emission, when the pollutant plume is still
concentrated, is the most likely period for secondary
particle formation by nucleation involving precursors
present in the emission plume, as discussed in Section 4.4.
Therefore particles measured away from the emission site,
and some time after emission, have different characteristics
to those measured immediately after formation.
5.1. Role of meteorological factors on particle concentration
The most important factors to consider include wind
speed, precipitation, relative humidity and temperature.
Wind speed: Wind speed affects dispersion and dilution
and thus atmospheric mixing, but also resuspention of
particles. Several studies shown that UF particle concentra-
tion decreases, while concentrations of larger particles
display a ‘‘U-shape’’ relationship with wind speed (Harrison
et al., 2001; Ruuskanen et al., 2001; Molnar et al., 2002;
Charron and Harrison, 2003). Hussein et al. (2005a) showed
that UF particle number concentrations are best represented
by a decreasing exponential function, with the minimum
observed during wind speeds 5m sÀ1
, as a result of a higher
Table 1
The range of particle number emission factors reported for nano and ultrafine size ranges
Particle size
classification
Size range
measured, nm
Fleet, 1014
particles
per vehicle per km
Heavy duty vehicles, 1014
particles per vehicle per km
Light duty vehicles, 1014
particles per vehicle per km
Nanoparticles 10 – 14.5 0.63–4.14
10–30 – 2.14–37.8 0.067–4.87
18–50 0.59–1.31 1.55–8.2 0.13–0.56
Ultrafin 18–100 0.84–1.55 1.7–10.5 0.37–0.81
30–100 – 3.19 0.284
L. Morawska et al. / Atmospheric Environment 42 (2008) 8113–8138 8121
10. coagulation rate, better air mixing, and more particle losses
due to deposition and scavenging at these wind speeds.
Particles larger than 100 nm showed a ‘‘U-shape’’ relation-
ship, best represented by a second-order polynomial, with
the minimum during wind speeds between 5 and 10 m sÀ1
.
Similar results were found by Charron and Harrison (2003) as
to the trends for particles ranging from 30 to 100 nm and
from 100 to 450 nm, as well as a twofold decrease from the
weaker to the stronger winds. A decrease of about 10,000
normalised counts per cm3
was seen for particles in the range
from 30 to 100 nm and modal shift toward smaller values
with increasing wind speed. However, no obvious relation-
ship with the wind speed was seen for the particles ranging
from 11 to 30 nm, and thus no dilution effect was evident for
this particle range, which could be explained as characteristic
of new particle formation. A study by Hussein et al. (2005a)
showed another trend, namely that at some sites, particle
number concentrations displayed a linear decrease with
wind speed. This was explained by higher summer temper-
atures, which are accompanied by a high boundary layer and
thus mixing of aerosol particles within a bigger volume.
Under such conditions, the relative changes of particle
concentration with wind speed are smaller compared to
a shallow boundary layer and thus smaller volume of air
mixing.
Precipitation: In general, precipitation has been shown
to have a washout effect, which means removing particles
from the atmosphere e.g. (Garcia-Nieto et al., 1994;
Morawska et al., 2004) (Jamriska et al., 2008). However,
a study by Charron and Harrison (2003) showed an oppo-
site effect in relation to particles below 150 nm, namely an
increase of particle numbers during rain, with larger rain
drops (more than 0.4 mm) leading to higher particle
numbers than smaller ones (0.2 mm). In addition, the
highest particle numbers were measured just after a rain
event (1 h after). The possible explanation for this
phenomenon is an effect of reduced temperatures during
precipitation events and thus higher saturation ratio of
semi volatile species combined with low pre-existing
surface area of particles, both favouring new particle
formation, and thus a significant increase of particle
number concentration.
Relative humidity and temperature: These two parame-
ters commonly display diurnal anti-correlation, with the
increased temperature during the day accompanied by
a decreased relative humidity. In general, both temperature
and relative humidity play a role in UF particle number
concentration (Charron and Harrison, 2003; Ruuskanen
et al., 2001; Jamriska et al., 2008). Kim et al. (2002) showed
that during the warmer months, there was some increase in
particles smaller than 100 nm, in the afternoon, linked to an
increase in temperature. Charron and Harrison (2003)
showed that particles in the size range 11–30 nm in
a roadside environment peaked during the early morning
showing an inverse association with air temperature. Oli-
vares et al. (2007) found a distinctive dependence of particle
number concentration with ambient temperature in a street
canyon in Sweden. They found that the total particle
number more than doubled when the temperature
decreased from 15
C to À15
C. The variation was most
pronounced for particles smaller than 40 nm. Modelling
results predicted that the changes in the particle sizes
observed were consistent with the condensation of volatile
compounds onto pre-existing aerosols. They also showed
that nucleation mode particles were largely influenced by
relative humidity with high concentrations during high
humidity periods. Hussein et al. (2005a) found that the high
number concentration of particles larger than 100 nm
during the higher summer temperatures was partly due to
the growth of aerosol particles in the presence of
condensable vapours emitted from the surrounding boreal
forest in southern Finland. In general, higher atmospheric
water content is expected to favour homogeneous binary
nucleation of sulphuric acid and water (Easter and Peters,
1994), while ternary nucleation involving ammonia
(Korhonen et al.,1999), similarly to nucleation from organic
compounds, is expected to be independent of relative
humidity Therefore, in the study by Charron and Harrison
(2003) for example, the lack of a dependence on the relative
humidity during the daytime was considered indicative that
the binary nucleation from sulphuric acid and water was
not a major factor in particle production.
Temperature inversion: Under such conditions, there is
little vertical mixing, wind speeds are lower and thus
pollution concentration in general is expected to increase.
For example, Janhall et al. (2006) showed that morning
temperature inversion in Go¨teborg, Sweden, resulted in
significantly elevated concentrations of traffic-related
pollutants, including UF particles. Mean particle number
concentrations on the days with and without morning
inversions were 6500 Æ 4800 and 2800 Æ 1900 particles
cmÀ3
, respectively. However, there was no impact of
inversion on PM10 concentrations.
5.2. Relative role of various processes
The processes that dominate particle dynamics shortly
after emissions by vehicles (i.e. when the concentration of
the emission plume, while decreasing due to dilution and
mixing, is still high) include: condensation/evaporation,
coagulation and new particle formation. Several studies
investigated the relative importance of these processes
under various meteorological and pollution concentration
conditions. During the dilution, when the initially hot
mixture of pollutants is cooled down, the saturation ratio
of gaseous compounds of low volatility reaches
a maximum. This is when two of the above processes are
possible: new particles formation by nucleation of
vapours, and vapour condensation onto existing particles.
The availability of pre-existing particle surface area for the
condensation of the semi-volatile vapours along with the
dilution rate, since it governs the cooling rate, will deter-
mine which of the two processes dominates. Small aerosol
concentrations favour new particles formation and their
growth to larger sizes (Kulmala et al., 2000), while high
concentrations promote the condensation of the vapours
on the existing particles and disfavour new particle
formation (Kerminen et al., 2001). This is the reason why
cleaner air resulting from stronger winds and rain, as
discussed above, favour the occurrence of high numbers of
UF particles. For example, Charron and Harrison (2003)
showed that large amounts of semi-volatile vapours from
L. Morawska et al. / Atmospheric Environment 42 (2008) 8113–81388122
11. vehicle exhausts in the early morning, associated with low
pre-existing particle surface area at that time (from about
300 to 500 mm2
cmÀ3
) favour production of new particles
and their growth to detectable sizes (11 nm). However,
during daytime, when the particle surface area ranges
from 800 to 1100 mm2
cmÀ3
, condensation of the
condensable gases onto existing particles is likely to
dominate. In comparison to the processes discussed above,
coagulation appears to be overall a less important process,
due to short time available for it to be effective before the
high initial concentrations at the road are diluted. Analysis
conducted by Shi et al. (1999) to estimate the expected
effect of coagulation on the decrease of particle number
concentration showed that the concentrations between
the road and a site 100 m away from the road would
decrease by less than 11% due to coagulation, compared to
a 72% decrease in measured concentrations, implying that
dilution with background air is the main mechanism for
the rapid decrease in particle number concentration.
However, Zhu et al. (2002a) concluded that both atmo-
spheric dilution and coagulation play important roles in
the rapid decrease of particle number concentration and
the change in particle size distribution with distance away
from a freeway. The study by Zhu et al. (2002b) suggested
that coagulation is more important than atmospheric
dilution for ultrafine particles and the reverse is true for
large particles. This contradicts some earlier studies which
concluded that the rapid dilution of the exhaust plume
made coagulation insignificant (Vignati et al., 1999; Shi
et al., 2001a), with the possible reason for this being that
the earlier studies assumed a much lower particle number
concentration for particles smaller than 15 nm, while this
study accurately measured freshly emitted particles down
to 6 nm.
Zhang and Wexler (2004a) identified two distinct
dilution stages after emission. The first stage, termed tail-
pipe-to-road, was induced by traffic-generated turbulence
and occurred soon after emission, lasting about 1–3 s,
when the dilution ratio reached up to 1000. The second
stage was mainly dependent on atmospheric turbulence
and lasted 3–10 min, with an additional dilution ratio of
about 10. In the first stage, aerosol dynamic processes such
as nucleation, condensation and coagulation played major
roles. In the second stage, condensation was the dominant
mechanism in altering the aerosol size distribution, with
coagulation and deposition playing minor roles. Exhaust
plumes emitted by different types of engines maintained
their characteristics in the first stage but generally mixed
with each other in the second stage. A similar conclusion
was reached by Pohjola et al. (2003) based on the
application of a aerosol process model MONO32. The effect
of coagulation was substantial only if the dilution of the
exhaust plume was neglected, which is not realistic under
most conditions (unless during temperature inversions or
a very stable atmosphere). Condensation of an insoluble
organic vapor was shown to be important if its concen-
tration exceeds a threshold value of 1010
or 1011
cmÀ3
for
the Aitken (w50 nm) and accumulation (100 nm) mode
particles, respectively. The importance of condensation or
evaporation of water was shown to be strongly dependent
on the hygroscopicity of particles. The modeling showed
that after a time of 25 s, most of the particulate matter
transformation processes have already taken place.
It has been suggested that sulphuric acid induced
nucleation was the dominant secondary particle produc-
tion mechanism in the first stage, followed by the
condensation of organic compounds (Kittelson, 1998;
Maricq et al., 2002; Zhang and Wexler, 2004a). Schneider
et al. (2005) showed that nucleation was mainly due to
sulphuric acid and water and low volatile organic species
condensed only on pre-existing sulphuric acid/water
clusters. However, other studies have suggested that the
volatile component of total diesel emission particles was
comprised mainly of unburned lubricating oil (Tobias et al.,
2001; Sakurai et al., 2003). Recently, Meyer and Ristovski
(2007) have shown that ternary nucleation involving
ammonia as the third species, is the main nucleating
mechanism, followed by the condensation of volatile
organic components. Zhang and Wexler (2004a) showed
that the first stage of dilution was crucial for the activation
of nuclei mode particles due to the high concentration of
condensable material during this time.
A deeper insight into the role of the key process was
provided by Zhang and Wexler (2004b) whose modelling
showed that for particles larger than 0.05 mm, coagulation
is too slow to influence number distributions and
condensation is the leading process. However, for particles
smaller than this, under typical urban conditions,
condensation and evaporation, coagulation, nucleation and
emissions interact with each other and the Kelvin effect
must be considered in modelling. Gravitational settling was
shown to significantly affect particle dry deposition, but
negligible for vertical turbulent transport; chemical
reactions are negligible. It was noted that the relative
importance of different mechanisms remains about the
same during the day and night time. During the night time,
with photochemistry cut off and significantly decreased
emissions, concentrations of both volatile or condensable
gases and particles is lower leading to the increased time
scales for the process, but thus maintaining their relative
importance.
In addition to particle growth and dilution, Jacobson
et al. (2005) showed that that small (15 nm) liquid
nanoparticles emit semi volatile organics (C-24) almost
immediately upon emission and that the shrinking of these
particles enhances their rates of coagulation by over an
order of magnitude. Enhanced coagulation in isolated
emission plumes may also affect evolution of particle size
distribution. Importantly, they concluded that neither
condensation, complete evaporation, coagulation alone,
nor preferential small particle dilution appears to explain
the evolution of particle sizes in the vicinity of busy roads.
5.3. Particle size distributions and modal location
in urban environments
Particle number size distributions in vehicle emissions
often show a characteristic bi-modal distribution (Kittelson,
1998; Kwon et al., 2003; Vogt et al., 2003; Ristovski et al.,
2006). Most of the particulate mass is generally found in the
accumulation mode (50 nm) while a considerable number
fraction of the particles may occur in the nucleation mode
L. Morawska et al. / Atmospheric Environment 42 (2008) 8113–8138 8123
12. (30 nm). Bi-modal size distributions have also been
observed near busy roads (Pirjola et al., 2006). Distinct
ultrafine modes in the particle number distributions have
been found in the size range 10–20 nm on the downwind
side but not on the upwind side of busy freeways (Zhu et al.,
2002a; Rosenbohm et al., 2005).
A recent literature review of modal locations identified
in ambient particle size distributions in a range of world-
wide environments (34 studies) found that for particle
number modal location values spanned 0.006–30 mm, with
approximately 98% of these values being 1 mm (Morawska
et al., 2008). Anthropogenic-influenced environments
included those in suburban environments in Australia and
Finland (Morawska et al., 1999c; Hussein et al., 2005b),
urban in Australia, Finland, Germany, Hungary, India and
the USA (Morawska et al.,1999c; Salma et al., 2002; Wehner
et al., 2002; Wiedensohler et al., 2002; Fine et al., 2004;
Hussein et al., 2004, 2005b; Monkkonen et al., 2005); and
traffic-influenced environments in Australia, Finland and
Germany and the US (Morawska et al., 1999c; Zhu et al.
2002a,b, 2004, 2006; Pirjola et al., 2004; Rosenbohm et al.,
2005).
When considering modes identified in these studies in
the 50 nm size range it was found that in anthropogenic-
influenced environments they ranged from 8.2 to 50 nm for
suburban and urban, and included modes at 7,10, 13, 15, 16,
19, 20, 27 and 30 nm in traffic influenced, likely reflecting
the influence of motor vehicle emissions. Modes identified
in the 50 100 nm size range in the anthropogenic-
influenced environments were in the range 50.2–65 nm in
suburban, traffic and urban; and at around 80 nm in urban
and traffic. Additional modes were found in suburban in
the range 92–100 nm.
6. Chemical composition of ultrafine particles
in different environments
There have been relatively few studies reported, which
investigated any aspects of chemical composition of UF
particles in ambient air. Moreover, each study was con-
ducted in a different way, sampled particles in a different
size range, and focused on different aspects of particle
chemical composition. Therefore, at present a comprehen-
sive knowledge on UF particle composition in different
environments is not available. This review summarises the
results of the few studies reporting UF particle chemical
composition.
As discussed earlier, engine emissions include SO2 or
SO3 and NO (later converted to NO2). Transformations in
the air of SO2, NO2 and NH3 from vehicle emissions into
SO4
2À
, NO3
À
, and NH4
þ
are important for increasing secondary
aerosol formation near traffic sites. Three studies investi-
gated these aspects of UF particle chemistry in urban
environments. (Kuhn et al., 2005) investigated particle
chemical composition in a park 5 km downwind of down-
town Pittsburgh. The study showed that UF mass was about
0.6 mg mÀ3
and its summer composition was 45% organic
matter and 40% salts of ammonium and sulphate,
compared to 55% organic matter and 35% of the sum of
ammonium and sulphate during winter. This shift was
explained as being likely due to higher summertime levels
of photochemical activity for oxidation of SO2, and
increased wood burning and vehicular organic contribu-
tions in wintertime. UF chemical composition was also
studied by Sardar et al. (2005) and showed a significant
seasonal change from summer to winter. Lin et al. (2007)
investigated water-soluble ions in nano (PM0.01–0.056) and
ultrafine (PM0.01–0.1) size ranges in samples collected near
a busy road and at a rural site. Several conclusions were
derived from this study. It was shown that the primary,
secondary and tertiary peaks of SO4
2À
and NH4
þ
were in
the fine (0.56–1.0 mm), coarse (3.2–5.6 mm), and nano
(0.032–0.056 mm) size ranges, respectively. The second and
third peaks of NO3
À
were in the same sizes ranges as those
for SO4
2À
and NH4
þ
; however, the primary peak for NO3
À
was
in the size range of 1–1.8 mm and slightly larger than that of
SO4
2À
and NH4
þ
. Nano (PM0.01–0.056) and coarse (PM2.5–10)
particles exhibited the highest (16.3%) and lowest (8.37%)
ratio of nitrate mass to total particle mass, respectively. The
mass ratio of NO3
À
was higher than that of SO4
2À
(contrary to
the trend commonly observed for urban atmospheric
particles) and also more variation existed in NO3
À
concen-
trations for different size range particles at the roadside site
than at the rural site. For both sites, NO3
À
concentrations in
nano and UF particles were about two times higher than
that for coarse particles and the nano NO3
À
concentration at
the roadside site was 1.34 times that at the rural site. The
peak of NO3
À
in the ultrafine size range in this study was
attributed mainly to vehicle engines, while the peaks of
SO4
2À
and NH4
þ
in the nano size range to (NH4)2SO4 aerosols
formed via the interaction of NH4
þ
and SO4
2À
. At the two
sites, no significant difference in NH4
þ
concentration was
found in each of the different size ranges investigated.
However, at the rural site, NH4
þ
was highly correlated with
SO4
2À
in each of the three particle size ranges – nano,
ultrafine, and coarse, with R values of 0.89, 0.60, and 0.86,
respectively.
Somewhat different aspects of UF particle chemistry
were studies by Woo et al. (2001a) who investigated
evaluation of outdoor and indoor particle volatility near
a freeway by heating particles and detecting changes in
their diameters and number concentrations. The study
showed that aerosol volatility decreases with increasing
distance from the source (in this case the differences
between outdoor and indoor particles). Monodisperse
distribution was observed for 18 and 27 nm particles with
the mode diameter decreasing with increasing heater
temperature (thus suggesting that all of these particles are
composed mostly of volatile material), and also broadening
because not all particles shrink to the same degree due to
differences in their chemical composition. Bi-modal
distributions were observed for outdoor 45 and 90 nm
particles heated to 110
C. In particular the 90 nm mode
split into two at heater temperatures of 90
C, with one
mode remaining close to the monodisperse mode of the
unheated aerosol, while the other shifting to a lower
diameter. This bi-modal distribution indicates that a frac-
tion of the 90 nm aerosol consists of particles that are
composed of almost entirely non-volatile material and
therefore does not change size upon heating, and the
remaining fraction contains mostly volatile material and
continue to shrink in size with increasing temperature. For
L. Morawska et al. / Atmospheric Environment 42 (2008) 8113–81388124
13. temperatures of up to 130
C the diameter of the volatile
particles in the whole range investigating (18–90 nm) was
still shrinking (at this temperature decreased to about half
the diameter compared to the original size at ambient
temperature) without a clear evidence of a plateau which
would indicating the presence of a non-volatile core; thus if
a non-volatile core exists, its diameter will be smaller than
that reached by particles at 130
C.
Elemental Carbon (EC) is usually considered a marker of
the combustion process; with diesel engines as predomi-
nant sources of EC to the urban atmosphere. Sardar et al.
(2005) investigated chemical composition of UF particles at
two sites (urban and inland). The study showed that
organic carbon (OC) ranged from 32 to 69%, EC from 1 to
34%, sulphate from 0 to 24% and nitrate from 0 to 4%. This
was somewhat different to the findings from the study by
Kim et al. (2002) who showed that OC and EC contribute
35%, sulphate 33%, and nitrate and ammonium 6% and 14%,
respectively, with other unknown substances contributing
12%. Kim et al. (2002) also showed that in all cases,
a greater fraction of the total mass consists of OC in the UF
mode than in the corresponding accumulation mode.
Similar conclusions can also be drawn for EC. A distinct OC
mode was observed between 18 and 56 nm in the summer
and not present in the other seasons, indicating photo-
chemical secondary organic aerosol formation. The EC
levels were higher in winter at the source sites and in
summer at the receptor sites due to lower inversion heights
and increased long-range transport from upwind source
areas, respectively. Nitrate was more prevalent in the
accumulation mode and almost not measurable in the UF
particles. This was related to the process of formation of
ammonium nitrate when the nitric acid in photochemical
smog in air parcels originating near downtown Los
Angeles Basin encounters ammonia. Higher summertime
temperatures and lower relative humidity favour the
dissociation of particulate ammonium nitrate, which is
more pronounced for UF particles due to the Kelvin effect.
Sulphate, which similar to nitrate, was only detectable in
the size ranges above 56 nm made up greater percentage of
the total mass in the accumulation than the UF mode in fall
and winter, however a higher proportion in both modes
during the summer, likely due to its photochemical origin.
It was suggested that the absence of sulphate in the smaller
particles indicted that the majority of the particulate
sulphate is formed on pre-existing particle surfaces or by
liquid-phase reactions of sulphuric acid. The study by Kim
et al. (2002) also supported the general findings from an
earlier study conducted in the same area by Turpin and
Hutzincker (1995), who also investigated the significance of
secondary organic aerosol formation by plotting OC against
the EC concentrations. The average ratio of OC to EC at a site
affected directly by traffic and at a site downwind from that
one estimated from slope of the linear regression, were 3.5
and 8.6, respectively implying the existence of secondary
organic aerosols in UF particles at second site.
UF chemistry, including elemental composition was
investigated by Pakkanen et al. (2001), including over 40
chemical components of samples from an urban and rural
site in the Helsinki area. While the average UF particle mass
concentration was higher at the rural (520 ng mÀ3
) than at
the urban site (490 ng mÀ3
), the average chemical compo-
sition of UF particles was similar at the two sites. The most
abundant of the measured components were sulphate (32
and 40 ng mÀ3
for the urban and rural sites, respectively),
ammonium (22 and 25 ng mÀ3
), nitrate (4 and 11 ng mÀ3
)
and the Ca2þ
ion (5 and 7 ng mÀ3
). The most important
metals at both sites were Ca, Na, Fe, K and Zn with
concentrations between 0.7 and 5 ng mÀ3
. Of the heavy
metals, Ni, V, Cu, and Pb were important with average
ultrafine concentrations between about 0.1 and 0.2 ng mÀ3
.
Also the organic anions oxalate (urban 2.1 ng mÀ3
and rural
1.9 ng mÀ3
) and methanesulphonate (1.3 and 1.7 ng mÀ3
)
contributed similarly at both sites. The measured species
accounted for only about 15–20% of the total UF mass.
While not measured, it was estimated that the amount of
water was about 10% (50 ng mÀ3
) and that of carbonaceous
material about 70% (350 ng mÀ3
) at both sites. At both sites
the contribution of UF to fine was especially high for Se, Ag,
B, and Ni (10–20%) and at the rural site also for Co (20%),
Ca2þ
(16%) and Mo (11%). Enrichment in the UF particles
suggests that local sources may exist for these elements.
Aitken modes turned out to be useful indicators of local
sources for several components. The Aitken modes of Ba,
Ca, Mg and Sr were similar in several samples, suggesting
a common local combustion source for these elements,
possibly traffic exhaust. Co, Fe, Mo and Ni formed another
group of elements often having similar Aitken modes, the
likely source being combustion of heavy fuel oil.
In summary, it can be concluded from the review of the
studies which analyse UF particle composition that almost
all the studies focused on different aspects of particle
chemistry, with some of them targeting ion or elemental
composition, other studies particle volatility, and yet others
investigating elemental and organic carbon fractions. It is
therefore important that more studies are conducted on
particle chemical composition, which would investigate in
parallel a range of different aspects to provide a more
complete understanding on the chemistry of UF particles
and its local variation.
7. Temporal variation of particle characteristics
7.1. Diurnal variation
In urban environments, strong diurnal variation of
particle concentration has been reported by many studies
and shown to closely follow the temporal variation in traffic
density, with the highest levels observed on weekdays
during rush hours (Ruuskanen et al., 2001; McMurry and
Woo, 2002; Charron and Harrison, 2003; Paatero et al.,
2005; Morawska et al., 2007a). It has been reported that
there are differences in the pattern for different weekdays,
with for example Friday having higher concentrations, and
also between Saturday and Sunday, reflecting different
traffic flow rate patterns on different days (Hussein et al.,
2004). As shown by many studies (e.g. (Morawska et al.,
2002; Hussein et al., 2004)), the daily pattern of aerosols on
weekdays is characterized by two peaks coinciding with
the traffic rush hours, while on weekends, by a wide peak
in the middle of the day. It is, however, the concentration of
the nucleation and Aitken modes particles which follows
L. Morawska et al. / Atmospheric Environment 42 (2008) 8113–8138 8125
14. this trend, with far fewer particles in the accumulation
mode, indicating exhaust as a major source of UF, but not of
larger particles in urban air (Hussein et al., 2004, 2005a).
Stanier et al. (2004a) showed that strong diurnal trends
were most apparent in the aerosol number, in contrast to
aerosol volume distribution, for which seasonal trends
were the strongest. In addition to the impact of traffic
emissions, the process of secondary particle formation
contributes to the variation in daily pattern of aerosol
concentration, with the impact varying during different
seasons.
7.2. Seasonal variation
There are several factors contributing to seasonal vari-
ation in particle concentration, including those leading to
an increase, such as: lower mixing layer height and greater
atmospheric stability in winter (due to less dispersion),
lower winter temperature (increased nucleation events of
combustion exhaust emitted from motor vehicles particu-
larly during morning rush), and increased photochemical
particle formation during summer; as well as those leading
to a decrease, such as: lower traffic flow rate during
summer holiday periods. All the studies investigating
seasonal variation in particle concentration in the Northern
hemisphere showed that there are clear seasonal trends
(Zhang et al., 2004a,b; Paatero et al., 2005; Pirjola et al.,
2006; Virtanen et al., 2006), contrary to a study conducted
in the Southern Chemosphere, in Brisbane, Australia, which
did not show a trend (Mejia et al., 2007b). While the studies
conducted in the Northern Chemosphere were in areas
where there are significant meteorological differences
between the seasons, and thus seasonal variations in
human activities, in subtropical Brisbane there are much
smaller differences between the seasons.
With the number of factors affecting particle concen-
trations it is not surprising that there are differences in the
magnitude and time of occurrence of peaks and troughs in
the concentrations between different geographical loca-
tions. Most of the studies reported the lowest total number
concentrations in summer with the highest in winter but
sometimes also in other seasons. Pirjola et al. (2006) and
Virtanen et al. (2006) showed that the average concentra-
tions in winter in Finland were 2–3 times higher, with the
highest of 183,000 cmÀ3
observed in February. Similar
results were reported by Wehner and Wiedensohler (2003)
in Leipzig, Germany. Zhang et al. (2004b) found the highest
monthly mean for N11–50 particles for Pittsburgh, USA, in
December, with a mean of 7630 Æ 3710 cmÀ3
while lowest
of 4280 Æ 2250 cmÀ3
in July. In winter most of the factors
leading to the increase in particle concentration tend to
occur at the same time: morning traffic rush, when the
mixing height is the lowest, coinciding with the lowest
wind speed and temperature. However, Hussein et al.
(2004) and Laakso et al. (2003) showed that while the
lowest total and nucleation mode particle number
concentrations were observed in Helsinki and in northern
Finland during summer, the highest were during spring
and autumn, and the cleaner the air, the stronger the cycle
was. Summer minima were associated with higher
temperatures (which limit the nucleation due to
temperature dependence of saturation vapour pressures)
and better mixing, and in Helsinki, with less traffic in July.
Springtime maximum was associated with nucleation of
exhaust gases (favoured by low temperatures combined
with the low boundary layer height and high radiation) and
transport of new particles from cleaner areas.
In general, seasonal daily variation in the accumulation
mode particles is less or not significant, while the variation
was larger in the UF particles; especially nucleation mode
particles (Hussein et al., 2004). Wehner and Wiedensohler
(2003) showed that the maximum concentration for both
summer and winter occurred for a particle size between 10
and 20 nm. McMurry and Woo (2002) studied ambient
aerosols in urban Atlanta, Georgia, and found that for
particles between 10 and 100 nm, average concentrations
tended to be highest during winter, while concentrations of
particles in the 3–10 nm range increased in the summer
due to photochemical nucleation, which depends strongly
on the intensity of solar radiation. Evidence of summer
nucleation was also found by Sardar et al. (2005) and Geller
et al. (2002), who showed elevated levels in the mass
concentrations in the 32–56 nm size range. Summer
nucleation events lead to rapid changes in particle
concentrations and as Zhang et al. (2004b) showed, the
highest variation was found in July.
7.3. Long term variation
The number of studies investigating long term trends
in particle concentrations is limited. Some insight into
particle number concentration trends was provided by
the studies conducted at different locations in former
East Germany, including the city of Erfurt and the
counties of Bitterfeld, Hettstedt and Zerbst, during two
different campaigns, the first one in the early and the
second one in the late 1990s, which found that UF
particle number increased between 38.1% (Pitz et al.,
2001) and 115% (Ebelt et al., 2001). Wahlin et al. (2001)
measured particle number concentration and size distri-
butions in a street canyon in Copenhagen over two 2-
month campaigns during January–March 1999 and
January–March 2000 and found a significant decrease in
ultrafine particle concentration. This observation was
attributed to a 56% fall in the average particle emission
from diesel vehicles due to the reduction of the sulphur
content in the fuel from approximately 0.05% to less than
0.005% implemented in Denmark in July 1999. A handful
of investigations have continuously monitored sub-
micrometer particles for periods of at least one year but
no evidence on the long term trends was reported
(Morawska et al., 1998b; Woo et al., 2001a; Wehner and
Wiedensohler, 2003; Cabada et al., 2004; Paatero et al.,
2005; Watson et al., 2005). Exceptions to this are two
studies conducted in Finland and in Australia. Hussein
et al. (2004), who measured particle number for over
a six-year period in Helsinki, found that annual geometric
mean particle number concentration increased by 3.2% in
1999, followed by a decrease of 6.7% in 2000, and 17.6% in
2002. Although the monitoring site was moved after the
first three years 3 km from its original location, thereby
influencing the results, their main conclusion was that
L. Morawska et al. / Atmospheric Environment 42 (2008) 8113–81388126
15. the annual variation in total particle number was associated
with traffic density and the predominance of new vehicles in
the Helsinki area. Long trends were investigated over a five-
year period in Brisbane, Australia. Particle size distribution
was summarized by total number concentration and
number median diameter (NMD) as well as the number
concentration of the 0.015–0.030 (N15–30), 0.030–0.050
(N30–50), 0.050–0.100 (N50–100), 0.100–0.300 (N100–300) and
0.300–0.630 (N300–630) mm size classes. Morning and
afternoon measurements, the former representing fresh
traffic emissions from a nearby freeway (based on the local
meteorological conditions) and the latter well-mixed
emissions from the central business district, during week-
days were extracted for time series analysis. Only the
morning measurements exhibited significant trends. During
this time of the day, total particle number increased by
105.7% over the period of five years and the increase was
greater for larger particles, resulting in a shift in NMD by
7.9%. There was no evidence to suggest that traffic flow in the
freeway has increased to cause the increase in particle
concentration, and it was suggested that the increase was
likely due to changes in the composition of the freeway
traffic, however, this hypothesis could not be verified. More
studies on long term trends are critically needed.
8. Spatial distribution of particle concentrations
within urban environment
The three most common approaches to experimental
studies concerned with small-scale (urban scale) spatial
variation in particle concentration, have generally
included: (i) measurements as a function of the distance
from a major road; (ii) measurements at a major road or in
its immediate vicinity, as well as at side streets; and (iii)
measurements at several locations within the city. This
section discusses separately the outcomes of each of these
types of studies, and concludes with an overall comparison
of ultrafine particle number concentration in different
environments. Not discussed here are vertical profiles of
particle concentrations, of particular importance in relation
to urban canyon effects, which are discussed elsewhere
(Hitchins et al., 2002; Longley et al., 2003; Vardoulakis
et al., 2003; Imhof et al., 2005b).
8.1. Particle concentration as a function
of the distance from the road
These studies are ideally conducted in areas where
airflow between the road and the monitoring site is
undisturbed by buildings or other barriers. As an outcome,
such studies provide information about small-scale particle
dispersion, where the shape of the dispersion function is
similar between the studies, and thus of general applica-
bility to other sites of similar topography. The studies
investigated changes to the total particle number concen-
tration as well as to the size distribution, and some of them
also compared changes to particle concentrations with the
concentrations of gaseous pollutants emitted by vehicles.
In general, all such studies showed, as expected, a decrease
in particle concentration with distance from the road, up to
about 300 m, beyond which particle concentration levels
and size distributions approach the local urban background
(Morawska et al., 1999b; Shi et al., 1999; Hitchins et al.,
2000; Zhu et al., 2002a).
At the road, particle concentrations range between 104
and 106
particles cmÀ3
, and show association with vehicle
flow characteristics (higher the speed, the greater the
particle concentration, and the smaller the particle size),
with less variation observed in particle volume compared
to particle number size distributions (Kittelson et al., 2004).
Virtanen et al. (2006) showed that the total concentrations
at roadside were dominated by nucleation mode particles,
were increasing with increasing traffic rate and the effect of
traffic rate were stronger on particles smaller than 63 nm
than on the larger particles. Harrison et al. (1999) reported
that at the road significant numbers of particles are in the
3–7 nm size range, with a mode below 10 nm, attributable
to homogeneous nucleation processes. The roadside
measurements show rapid variation, with two modes at 10
and 30 nm, and other modes present at a number of
different particle sizes (between 20 and 50 nm and 100 and
200 nm), and changing very quickly between measure-
ments (Harrison et al., 1999; Morawska et al., 2004).
Studies investigating total particle concentration levels
showed the decrease with the distance from the road to be
exponential or according to the power law. This is similar to
the studies investigating gradients of NO2 concentrations in
the vicinity of roads (e.g. (Nitta et al., 1993; Kuhler et al.,
1994; Roorda-Knape et al., 1998)), which found them to be
curvilinear. Shi et al. (1999) showed that total particle
number concentration in the size range from 9.6 to 352 nm
at the busy road site was 3.6 and 3 times higher, compared
to two sites at a distances of 30 and 100 m from the road,
respectively. A study by Hitchins et al. (2000) conducted for
total particle number concentration in the size range from
15 to 697 nm showed that for conditions where the wind
was blowing directly from the road, at a distance of
approximately 100–150 m from the road, the concentration
decayed to about half that of the maximum occurring at
15 m from the road (the nearest measuring point to the
road), which reduced to 50–100 m for wind blowing
parallel to the road. Zhu et al. (2002a) showed that particle
number concentration in the size range from 6 to 220 nm
as a function of distance from a road ranging from 17 to
300 m displayed an exponential decreasing trend, similarly
to the concentrations of CO and black carbon. Pirjola et al.
(2006) showed that at a distance of 65 m from the roadside,
the average concentration reduced to 39% in winter and to
35% in summer with the wind perpendicular to the road
whilst for wind blowing along the road in it decreased to
19% in summer.
Gramotnev et al. (2003) modelled particle dispersion
using a scaling procedure for CALINE4 developed for this
purpose, and compared the results with measured total
particle concentration in the size range of 0.015–0.700 mm
at distances between 15 and 265 m from the road. The
authors concluded that particle concentration reduces as
a power law with the distance from the road, with the
typical difference between the theory and average
measured concentration being of the order of 10%, which
was likely due to processes not included in the modelling,
in particular coagulation.
L. Morawska et al. / Atmospheric Environment 42 (2008) 8113–8138 8127