VMware 2011 – Strategické smerovanie a úspechy
•
0 j'aime•487 vues

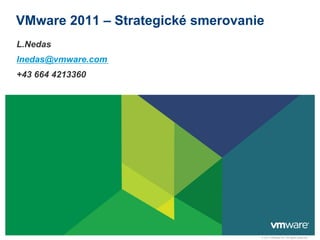
VMware had a strong leadership position in virtualization in 2010 according to various surveys and awards. Trends showed virtual machine densities nearly tripling from 2005 to 2010, with larger enterprises having on average 8-10 VMs per physical machine. VMware released new versions of its virtualization, desktop virtualization, and collaboration products which improved scalability, simplified administration, and broke the $250 per-user acquisition cost barrier. The company's roadmap focused on projects for unified user management across legacy and cloud applications, collaborative workspaces, and enterprise data synchronization across devices.
![VMware Leadership in 2010
“Survey results show that VMware is Awards
the most trusted virtualization vendor”
“VMware comesis the sole leader in
VMware out much stronger InfoWorld 2011
Technology of the Year
Gartner’s first ever still theQuadrant
“VMware is Magic
than we had anticipated” leader…” Best Virtualization Platform:
for x86 Server Virtualization vSphere 4.1
“Hyper-V is underperforming”
“
“… the Group, between [VMware and
The 451 gap Jan 2010
Microsoft] actually widened.” much of a
Hyper-V vs. VMware not
May 2010 Windows IT Pro
Best of TechEd
“Hyper-V hasfight grabbed as much
not these days”
Attendee Pick for Best of
market share as I was 2010
SearchServerVirtualization, Oct predicting” Show: vSphere
“VMware still has at least a ‘five-year,
“VMware is the king of virtualization…
4 of the 5 leaders, in
Gartner blog, Oct 2010 lead’ on both
pure-technology CRN Virtualization
Microsoft actually lost ground in its for
Gartner’s Magic Quadrant
XenServer and Hyper-V” at the
71% of respondents Product of the Year:
battle for virtualization supremacy”
Cloud Infrastructure as a Service vSphere 4.1, vCenter 4.1
Gartner Datacenter Conference said
Taneja Group, Oct Hosting,
and Web 2010
VMware wouldVMware primary
are based on be their
TechTarget, Oct 2010 Network World
Best of the Tests 2010
virtualization solution for x86 servers
Server Virtualization:
Dec by 2015
2010 vSphere 4
Live Audience Poll, Dec 2010 eWeek
2010 Product of the Year:
VMware View 4.5](data:image/gif;base64,R0lGODlhAQABAIAAAAAAAP///yH5BAEAAAAALAAAAAABAAEAAAIBRAA7)
Recommandé
Recommandé
Contenu connexe
Tendances
Tendances (6)
En vedette
Similaire à VMware 2011 – Strategické smerovanie a úspechy
Similaire à VMware 2011 – Strategické smerovanie a úspechy (20)
Plus de ASBIS SK
Plus de ASBIS SK (20)
Dernier
Dernier (20)
VMware 2011 – Strategické smerovanie a úspechy
- 1. VMware 2011 – Strategické smerovanie L.Nedas lnedas@vmware.com +43 664 4213360 © 2011 VMware Inc. All rights reserved
- 2. VMware Leadership in 2010 “Survey results show that VMware is Awards the most trusted virtualization vendor” “VMware comesis the sole leader in VMware out much stronger InfoWorld 2011 Technology of the Year Gartner’s first ever still theQuadrant “VMware is Magic than we had anticipated” leader…” Best Virtualization Platform: for x86 Server Virtualization vSphere 4.1 “Hyper-V is underperforming” “ “… the Group, between [VMware and The 451 gap Jan 2010 Microsoft] actually widened.” much of a Hyper-V vs. VMware not May 2010 Windows IT Pro Best of TechEd “Hyper-V hasfight grabbed as much not these days” Attendee Pick for Best of market share as I was 2010 SearchServerVirtualization, Oct predicting” Show: vSphere “VMware still has at least a ‘five-year, “VMware is the king of virtualization… 4 of the 5 leaders, in Gartner blog, Oct 2010 lead’ on both pure-technology CRN Virtualization Microsoft actually lost ground in its for Gartner’s Magic Quadrant XenServer and Hyper-V” at the 71% of respondents Product of the Year: battle for virtualization supremacy” Cloud Infrastructure as a Service vSphere 4.1, vCenter 4.1 Gartner Datacenter Conference said Taneja Group, Oct Hosting, and Web 2010 VMware wouldVMware primary are based on be their TechTarget, Oct 2010 Network World Best of the Tests 2010 virtualization solution for x86 servers Server Virtualization: Dec by 2015 2010 vSphere 4 Live Audience Poll, Dec 2010 eWeek 2010 Product of the Year: VMware View 4.5
- 3. 2010 Milestone: Virtualization is Now De Facto Model § VM Cross Over 17,500,000 Physical Servers Virtual machines 15,000,000 12,500,000 10,000,000 7,500,000 5,000,000 2,500,000 0 2005 2006 2007 2008 2009 2010 2011 2012 2013 We are past a virtual tipping point! Source: IDC
- 4. Trends in VM Density 17.500.000 Source: IDC WW Server 8.4 15.000.000 Virtualization Shipment Forecast, 2005-2013 8.2 7.7 12.500.000 7.1 10.000.000 5.4 6.1 3.3 4.3 7.500.000 3.0 5.000.000 2.500.000 0 2005 2006 2007 2008 2009 2010 2011 2012 2013 Physical Hosts Stand Alone Servers Virtual Machines VM Densities Nearly Triple
- 5. Larger Enterprises Tend Towards Higher VM Densities Question: How many x86 virtual machines does your organization have on average per physical machine? 1 to Less Than 5 4 5 to Less Than 8 17 8 to Less Than 10 15 10 to Less Than 12 15 12 to Less Than 15 14 15 to Less Than 20 12 20 or More 23 0 5 10 15 20 25 Percentage of Respondents N = 51 Source: Gartner, Inc., “Survey Analysis: 2009 Data Center Conference, x86 Virtualization Savings and Consolidation Promises Yet to Be Fulfilled”, Feb 2010
- 6. Greater Pooling to Deliver Ultimate Efficiency From…. To…. Inefficient Islands of IT Efficiently Pooled IT Org #1 Org #2 Org #3 Internal Org #1 Org #2 Org #3 Utilization ~60% Utilization ~90%
- 7. Increased Scalability, Simplified Administration § Scalable & Robust Management Interface § Simplifies Virtual Desktop Administration § Role Based Administration View 4.5 is THE Easiest and Most Powerful VDI Solution on the Marketupport vSphere and vCenter 4.1 § S Today § Broker scalability up to 10,000 VM pods § Tiered Storage Support
- 8. View 4.5 – Now for Mobile Users Too § View Client with Local Mode (BYOPC) § Check out Virtual Desktop from Data Center § Take it on the road while kept in Synch View 4.5 is the first § Mobile Users, Knowledge Workers, Contractors integrated online and offline solution View Manager Native Mac Client
- 9. $250 Per-Seat Datacenter Infrastructure Cost Infrastructure Cost Datacenter Hardware acquisition cost per user The View 4.5 new $1200 $1000 $800 Architecture Delivers $600 sub $500 Virtual Average Corporate PC $400 Desktop sub-$500 $200 $250 Time 2010
- 10. Breaking the Acquisition Cost Barrier with Partners • Sub $40 Enterprise Storage for Dell Virtual Remote Desktop View Featuring VMware View, • Largest Windows 7 Migration Solution Cost Reference Architecture Brief Practice • 60% increase in desktop performance • Sub $40 Enterprise Storage for HP Reference Architecture for View VMware View, Reference • 50.000 seat View Deployment Architecture Brief Architecture
- 11. View 4.5 in Action at VMworld 2010 60,000 – 70,000 desktops being provisioned 480 concurrent VMs in the hybrid cloud (Miami, Ashburn, VA and San Francisco) Type of Desktop: Knowledge Worker, Dual Monitor, Kiosk Mode PCoIP bandwidth consumption: 150K/session with 130 ms latency
- 12. 2010 Releases: Zimbra Innovative Zimbra: Cloud UI, Cloud Customer Momentum § Cross platform online, offline and mobile access Scale, Install to Inbox in § Zimbra Briefcase for enterprise data storage and sharing • Over 150,000 Organizations • 60 Million Paid Mailboxes Open 10 Minutes § seamless and secure access to corporate & personal • 110 Countries application Open Source Community • 1+ Million Server Downloads § Zimlets for rapid application integration • 3+ Million Client Downloads Simplify • 33K+ community members § Application portability across public and private clouds § Zimbra Appliance - install to inbox in 10 minutes
- 13. Roadmap: Project Horizon Industry First: Unified user management of legacy and cloud applications § User Experience Project Horizon: Policy- • Single sign on • Self Service based Delivery of • Cross Platform Support • Scalable VoIP Support Diverse Apps and Data • Offline Mac § Cloud Ready Identity • Legacy, SaaS, Published apps under unified management • Extend enterprise policy to the cloud • Secure identity management across hybrid cloud § ThinApp Factory • Automated packaging and updating of native applications
- 14. Roadmap: User Data and Collaboration § Collaborative Team Workspaces • Document Sharing Team Collaborative • Team Calendar management • Application Catalog Workspaces § Enterprise Data Synchronization • Across multiple devices • Broad Synch Support § Improved productivity • Integrated Social Communication
- 15. VMware View Client for iPad Overview § Native VMware View client for iPad § First and only iPad client with support for PCoIP § Access View desktop from iPad on LAN or WAN, WiFi or 3G § Integration with View 4.6 Security Server for simple and secure access
- 16. VMware View Client for iPad - Gestures Gestures for quick and easy desktop navigation
- 17. VMware View Client for iPad - Keyboard Pop-up keyboard for efficient text input
- 18. VMware View Client for iPad – Track Pad Track pad for precise mouse targeting
- 19. VMware View Linked Centralized Virtual Clones Desktops Platform VMware vSphere For Desktops Management VMware View Manager, VMware View Composer, VMware ThinApp VMWARE Parent VIEW MANAGER Image Thin Client/ Zero Client VMWARE Desktop VIEW COMPOSER User Experience Local PCoIP, Print, Mode VMWARE Multi-Monitor Display, iPad THINAPP Multimedia, USB Redirection, Local Mode, View Client for iPad
- 20. Why vCenter Operations Standard? 80% of VMware admin time spent isolating performance problems • “1st generation” green-yellow-red static threshold reporting insufficient and too complex to use • Point solutions only address a subset of issues VMware administrators have two conflicting goals • Maximize ROI by increasing VM density • Ensure required capacity for business growth and other changes in real-time • Ensure that virtual component performance supports required application performance
- 21. Performance dashboard based on self-learning analytics Visualize environment performance in three unique dimensions Simple, actionable scores that indicate overall performance Highlights resources that are deviating from “normal” behaviour
- 22. Get “At-a-glance” insights into performance issues Performance scores “Details” for further analysis Visualize impact
- 23. Drill down into problem source Key metrics of interest based on continuous learning of “normal” behavior Stress caused by net I/O Quickly identify problem source
- 24. Correlate cause-and-effect of the problem Check health of related objects in the hierarchy Correlate events that occurred at the same time
- 25. VMware Solutions for IT as a Service The New IT Stack for Hybrid Cloud Computing: Secure, Manageable, Open VMware’s Secure Private Cloud VMware Enabled Independent Differentiation Public Clouds Public Clouds 1. Provides a VMware End-User Computing complete solution SaaS Other SaaS View Thin App Zimbra Applications Providers 2. Supports an evolutionary approach 3. Supports a broad VMware Cloud Application Platform Google App ecosystem VMforce Engine including vFabric Spring Services Hyperic Oher PaaS Other cloud infrastructure multiple cloud Partners providers service providers 4. Provides an open platform for new vCloud applications VMware Cloud Infrastructure and Management Datacenter vCenter vShield vCloud Director vCloud Express VMware vSphere: Foundation for Cloud Computing
- 26. 2011 – Year of Innovations ! J 56 beers poured in 1 minute !
- 27. The end Ďakujem! Confidential