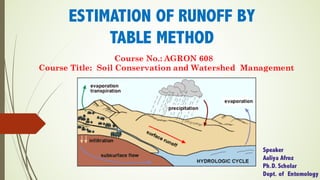
1. ESTIMATION OF RUNOFF BY
TABLE METHOD
Speaker
Aaliya Afroz
Ph.D. Scholar
Dept. of Entomology
Course No.: AGRON 608
Course Title: Soil Conservation and Watershed Management
2. Runoff
´ It is defined as the portion of the precipitation that makes its
way towards streams, channels, lakes or oceans as surface or
subsurface runoff.
Runoff (R) = Precipitation (P) – Losses (L)
Runoff (R) = Surface runoff + Subsurface runoff
3. Estimation of runoff-
Definition-
´ It is defined as the process of determining the volume or peak
rate of runoff from a given watershed.
Requirement?
´ It is required for the design of soil and water conservation
structures like spillways and outlets or waterways.
´ Quantitave estimation of runoff is the prerequisite of any design.
5. Table Method
´ There are wide variations in the annual rainfall amount.
´ Even in low rainfall areas, there are many severe storms.
´ The differences in run-off are far more influenced by variations
in the surface conditions than by variations in rainfall intensity.
´ For determining the peak rate of runoff, it was found that a
single set of tables could be used for the whole country.
6. Contd.
´ On the other hand, the high rates of runoff made it advisable to
introduce another factor - the shape of watershed.
´ Separate tables are used for each of three watershed shapes:
1. Square
2. Broad and short
3. Long and narrow
´ For estimation of runoff select the table for the shape which is
nearest to that of watershed.
7. Peak Discharge
´ The peak discharge for any watershed up to 500 acres may be
obtained using the following tables.
´ A field investigation of the watershed is made to determine its
characteristics ( vegetative cover, topography and soil types) and
obtain its dimensions.
´ The peak discharge is obtained by summing up the watershed
characteristics from Table 1; then the proper table for shape of
watershed ( Table 1.1, 1.2, 1.3) is referred to ; the cubic feet per
second (cfs) is read in the proper column across from watershed
area under the sum of watershed characteristics.
8. Table 1: Watershed Characteristics (C)
Cover Score Soil type and drainage Score Slope Score
Heavy grass 10 Deep, well drained soils 10 Very flat to gentle 5
Scrub and
medium
grass
15 Deep, moderately
pervious soil
20 Moderate 10
Cultivated
lands
20 Soils of fair
permeability and depth
25 Rolling 15
Bare or
eroded
25 Shallow soils with
impeded drainage
30 Hilly or steep 20
Medium heavy clays or
rocky surfaces
40 Mountainous 25
Impervious surfaces
and waterlogged soils
50
9. Table 1.1: Runoff (cfs) from a square watershed
(C: watershed characteristic number, from Table 1)
30
60
76
12. Example: 1
A square watershed is covering an area of 30 acre with bare
(eroded) soil of fair permeability and depth, with a moderate slope.
Calculate the peak rate of runoff.
Solution: The peak rate of runoff will be the sum of watershed
characteristics.
= Bare soil + Soils of fair permeability and depth + Moderate slope
= 25 + 25 + 10
= 60
Answer : The peak rate of runoff is 76 cfs found in Table 1.1 across
from 30 acre area in the column under watershed characteristic 60.
13. Example: 2
If you wish to shape a vegetate a drain from a cultivated field. The
5 acre watershed area has flat to gentle slopes and has a crop of
groundnut growing on it. It is long and narrow with deep well-
drained soil, then calculate the peak rate of runoff.
Solution: The sum of watershed characteristics is-
= Cultivated land + Deep, well drained soils + Flat to gentle slopes
= 20 + 10 + 5
= 35
Answer : The peak rate of runoff is 5 cfs found in Table 1.3 across
from 5 acre area in the column under watershed characteristic 35.