SlideShare une entreprise Scribd logo
1  sur  4
Télécharger pour lire hors ligne
© 2018 Jones Lang LaSalle IP, Inc. All rights reserved. All information contained herein is from sources deemed reliable; however, no representation or warranty is made to the accuracy thereof.
Market uncertainty in light of COVID-19 pandemic
Insight
Summer 2020
Dayton Office Insight
The Dayton office market started the year with moderate activity both in
sales and leasing. Like years past, the South and East submarkets continue
to draw most of the activity given their proximity to the Wright Patterson
Airforce Base. The largest lease thus far in the year is Wilmer Hale for
48,887 square feet at 3050 Newmark Dr, followed by Kettering Health
Network at 2000 E Dorothy Ln for 25,459 square feet, and DCS Corp for
23,298 square feet at 3745 Pentagon Blvd. In addition to moderate leasing
activity, sales activity has followed suit with the largest sale of the quarter
being the four-building portfolio at Miami Valley Research Park that was
purchased by ICP from PNC Financial Services for $5.2 million or $22.67-
per-square-foot.
While sales and leasing activity remains stable, construction in the Dayton
office market is quiet. Speculative construction has been very minimal over
the last several years with most construction being driven by build-to-suit
projects. The most notable projects include the new CareSource
headquarters and Radiance Technologies headquarters that both
delivered in 2019.
Outlook
While sales and leasing activity fared moderately in the beginning of 2020,
like most markets across the United States, activity in Dayton has stalled
due to the COVID-19 pandemic. With many office users re-evaluating their
spaces needs, leasing activity has slowed into the second and third
quarters. This is likely to remain the case throughout the end of 2020. As we
head further into the second half of the year, we may see companies
beginning to give back space as they evaluate giving employees more
flexibility for remote work in the future.
Top trends:
• The South and East submarkets continue to drive activity in the
market given their proximity to the Wright-Patterson Air Force Base.
• Construction within the Dayton market remains minimal. The most
notable deliveries in the new CareSource and Radiance Technologies
build-to-suits.
• Vacancy and rental rates have remained fairly stable over the last
several years.
Fundamentals Forecast
Total inventory 12,554,373 s.f. ▶
Under construction 0 s.f. ▶
Total vacancy 18.8% ▼
Average asking rent (gross) $15.15 p.s.f. ▲
Concessions Stable ▶
-50,000
50,000
150,000
250,000
2017 2018 2019 2020
Supply and demand (s.f.)
Net absorption
17.7%
17.1%
16.7%
18.8%
2017 2018 2019 2020
Total vacancy
$0.00
$5.00
$10.00
$15.00
$20.00
2017 2018 2019 2020
Average asking rents ($/s.f.) Class A
Class B
The health, policy, economic and financialdisruption stemming from the COVID-19 pandemic continues to
create a fluid and evolving environment for the office market. Although data from Q2 is providing greater
clarity about conditions and the short-term real estate outlook, there remains significant uncertainty
surrounding market dynamics and long-term trajectories and, as a result, we will continue to monitor
fundamentalsclosely as the situation unfolds. Please feel free to contact us if we can assist.
© 2020 Jones Lang LaSalle IP, Inc. All rights reserved. All information contained herein is from sources deemed reliable; however, no representation or warranty is made to the accuracy thereof.
© 2018 Jones Lang LaSalle IP, Inc. All rights reserved. All information contained herein is from sources deemed reliable; however, no representation or warranty is made to the accuracy thereof.
Summer 2020
Dayton Office Market
Statistics
Methodology: JLL tracks office buildings ≥20,000 square feet. Government, medical and owner-occupied buildings are excluded.
Class Inventory (s.f.) Total Availability (s.f.) Total Availability (%)
Average direct
asking rent ($ p.s.f.)
CBD Totals 5,209,080 529,254 24.0% $14.41
East Totals 2,376,014 251,887 10.6% $18.89
North Totals 801,769 169,350 21.1% $14.31
South Totals 4,051,360 691,883 17.1% $15.70
Upper Valley Totals 74,138 13,403 18.1% $18.00
West Totals 116,150 - 0.0% $0.00
Suburbs Totals 7,345,293 1,113,120 15.2% $16.15
Dayton Totals 12,554,373 2,363,467 18.8% $15.15
CBD A 1,877,943 529,254 28.2% $16.84
East A 1,226,952 136,584 11.1% $23.94
North A 141,150 22,957 16.3% $17.50
Suburbs A 2,869,170 293,178 10.2% $20.76
Dayton A 4,747,113 822,432 17.3% $18.02
CBD B 3,331,137 721,093 21.6% $12.99
East B 1,149,062 115,303 10.0% $16.44
North B 660,619 146,393 22.2% $13.64
South B 2,550,292 558,246 21.9% $14.86
Upper Valley B 74,138 13,403 18.1% $18.00
West B 116,150 - 0.0% $0.00
Suburbs B 4,476,123 819,942 18.3% $14.88
Dayton B 7,807,260 1,541,035 19.7% $13.89
© 2020 Jones Lang LaSalle IP, Inc. All rights reserved. All information contained herein is from sources deemed reliable; however, no representation or warranty is made to the accuracy thereof.
© 2018 Jones Lang LaSalle IP, Inc. All rights reserved. All information contained herein is from sources deemed reliable; however, no representation or warranty is made to the accuracy thereof.
Summer 2020
Dayton Office Market
Market activity
3
Sale
Lease
1
2
6
4
Address: 2661 Commons Blvd
Lease Size: 14,900
Move Date: Q2 2020
Tenant: DeciBel Research
4
5
Address: 424 E First St
Lease Size: 5,500
Move Date: Q2 2020
Tenant: Brackett Builders Inc
1
Address: 1 S Main St
Square Feet: 343,236
Price: $7,444,947
Price/SF: $21.69
Buyer: R.L.R Investments, LLC
Seller: CWCapital Asset
Management, LLC
This dashboard analyzes a partial list of office market activity in the Dayton market YTD
5
2
Address: 3050 Newmark Dr
Lease Size: 48,887
Move Date: Q1 2020
Tenant: Wilmer Hale
3
Address: 3745 Pentagon Blvd
Lease Size: 23,298
Move Date: Q1 2020
Tenant: DCS Corp
6
Building Park: Miami Valley
Research Park
Square Feet: 229,366
Price: $2,224,363
Price/SF: $22.24
Buyer: ICP, LLC
Seller: PNC Financial Services
Group, Inc.
© 2020 Jones Lang LaSalle IP, Inc. All rights reserved. All information contained herein is from sources deemed reliable; however, no representation or warranty is made to the accuracy thereof.
© 2018 Jones Lang LaSalle IP, Inc. All rights reserved. All information contained herein is from sources deemed reliable; however, no representation or warranty is made to the accuracy thereof.
Andrew Batson
Vice President, Director of Research
+1 216 937 4374
andrew.batson@am.jll.com
Employment
Abby Armbruster
Senior Research Analyst
+1 513 252 2148
abby.armbruster@am.jll.com
Contact:
11.7%U.S. unemployment
-9.5%U.S. 12-month job growth
12.7%Dayton unemployment
-11.2%Dayton 12-month job growth
13.7%Ohio unemployment
-13.6%Ohio 12-month job growth
Summer 2020
Dayton Office Market
-18.0%
-15.0%
-12.0%
-9.0%
-6.0%
-3.0%
0.0%
3.0%
201
3
201
4
201
5
201
6
201
7
201
8
201
9
Dayton U.S.
Job growth*
Historical employment Office employment*
* Represents 12-month change in employment. All charts represent the latest economic data available from the Bureau of Labor Statistics as of May 2020.
© 2018 Jones Lang LaSalle IP, Inc. All rights reserved. All information contained herein is from sources deemed reliable; however, no representation or warranty is made to the accuracy thereof.
0%
4%
8%
12%
16%
100,000
200,000
300,000
400,000
500,000
2013 2014 2015 2016 2017 2018 2019 2020
Employment Unemployment
-5.0
-3.0
-1.0
1.0
3.0
5.0
7.0
2014 2015 2016 2017 2018 2019 2020
Professional & Business Services Information
Government Financial Activities
© 2020 Jones Lang LaSalle IP, Inc. All rights reserved. All information contained herein is from sources deemed reliable; however, no representation or warranty is made to the accuracy thereof.

Contenu connexe

Tendances

JLL Cleveland Office Outlook: Q2 2018
JLL Cleveland Office Outlook: Q2 2018JLL Cleveland Office Outlook: Q2 2018
JLL Cleveland Office Outlook: Q2 2018Andrew Batson
 
JLL Cleveland Office Outlook: Q3 2018
JLL Cleveland Office Outlook: Q3 2018JLL Cleveland Office Outlook: Q3 2018
JLL Cleveland Office Outlook: Q3 2018Andrew Batson
 
JLL Cincinnati Office Outlook Q4 2020
JLL Cincinnati Office Outlook Q4 2020JLL Cincinnati Office Outlook Q4 2020
JLL Cincinnati Office Outlook Q4 2020Abby Armbruster
 
Pittsburgh Office Insight & Stats Q1 2022
Pittsburgh Office Insight & Stats Q1 2022Pittsburgh Office Insight & Stats Q1 2022
Pittsburgh Office Insight & Stats Q1 2022Tobiah Bilski
 
JLL Cleveland Office Outlook: Q2 2018
JLL Cleveland Office Outlook: Q2 2018JLL Cleveland Office Outlook: Q2 2018
JLL Cleveland Office Outlook: Q2 2018Andrew Batson
 
St. Louis Office Outlook Q3 2016
St. Louis Office Outlook Q3 2016St. Louis Office Outlook Q3 2016
St. Louis Office Outlook Q3 2016Blaise Tomazic
 
JLL Detroit Office Insight & Statistics - Q1 2018
JLL Detroit Office Insight & Statistics - Q1 2018JLL Detroit Office Insight & Statistics - Q1 2018
JLL Detroit Office Insight & Statistics - Q1 2018Harrison West
 
JLL Grand Rapids Office Insight & Statistics - Q1 2019
JLL Grand Rapids Office Insight & Statistics - Q1 2019JLL Grand Rapids Office Insight & Statistics - Q1 2019
JLL Grand Rapids Office Insight & Statistics - Q1 2019Harrison West
 
JLL Cleveland Office Outlook: Q3 2019
JLL Cleveland Office Outlook: Q3 2019JLL Cleveland Office Outlook: Q3 2019
JLL Cleveland Office Outlook: Q3 2019Johnathan Miller
 
JLL Pittsburgh Office Insight & Statistics - Q4 2018
JLL Pittsburgh Office Insight & Statistics - Q4 2018JLL Pittsburgh Office Insight & Statistics - Q4 2018
JLL Pittsburgh Office Insight & Statistics - Q4 2018Tobiah Bilski
 
Net lease Research Report Q1 2019
Net lease Research Report Q1 2019Net lease Research Report Q1 2019
Net lease Research Report Q1 2019The Boulder Group
 
JLL Cleveland Office Outlook: Q1 2017
JLL Cleveland Office Outlook: Q1 2017JLL Cleveland Office Outlook: Q1 2017
JLL Cleveland Office Outlook: Q1 2017Andrew Batson
 
JLL Pittsburgh Office Insight & Statistics - Q2 2020
JLL Pittsburgh Office Insight & Statistics - Q2 2020JLL Pittsburgh Office Insight & Statistics - Q2 2020
JLL Pittsburgh Office Insight & Statistics - Q2 2020Tobiah Bilski
 
JLL Detroit Office Insight & Statistics - Q4 2018
JLL Detroit Office Insight & Statistics - Q4 2018JLL Detroit Office Insight & Statistics - Q4 2018
JLL Detroit Office Insight & Statistics - Q4 2018Harrison West
 
JLL Louisville Industrial Outlook - Q3 2019
JLL Louisville Industrial Outlook - Q3 2019JLL Louisville Industrial Outlook - Q3 2019
JLL Louisville Industrial Outlook - Q3 2019Alex Westcott
 
JLL Detroit Office Outlook: Q4 2015
JLL Detroit Office Outlook: Q4 2015JLL Detroit Office Outlook: Q4 2015
JLL Detroit Office Outlook: Q4 2015Aaron Moore
 
JLL Louisville Industrial Outlook - Q3 2019
JLL Louisville Industrial Outlook - Q3 2019JLL Louisville Industrial Outlook - Q3 2019
JLL Louisville Industrial Outlook - Q3 2019Alex Westcott
 
JLL Akron Office Outlook: Spring 2018
JLL Akron Office Outlook: Spring 2018JLL Akron Office Outlook: Spring 2018
JLL Akron Office Outlook: Spring 2018Andrew Batson
 
JLL Detroit Office Insight & Statistics – Q2 2016
JLL Detroit Office Insight & Statistics – Q2 2016JLL Detroit Office Insight & Statistics – Q2 2016
JLL Detroit Office Insight & Statistics – Q2 2016Aaron Moore
 

Tendances (20)

JLL Cleveland Office Outlook: Q2 2018
JLL Cleveland Office Outlook: Q2 2018JLL Cleveland Office Outlook: Q2 2018
JLL Cleveland Office Outlook: Q2 2018
 
JLL Cleveland Office Outlook: Q3 2018
JLL Cleveland Office Outlook: Q3 2018JLL Cleveland Office Outlook: Q3 2018
JLL Cleveland Office Outlook: Q3 2018
 
JLL Cincinnati Office Outlook Q4 2020
JLL Cincinnati Office Outlook Q4 2020JLL Cincinnati Office Outlook Q4 2020
JLL Cincinnati Office Outlook Q4 2020
 
Pittsburgh Office Insight & Stats Q1 2022
Pittsburgh Office Insight & Stats Q1 2022Pittsburgh Office Insight & Stats Q1 2022
Pittsburgh Office Insight & Stats Q1 2022
 
JLL Cleveland Office Outlook: Q2 2018
JLL Cleveland Office Outlook: Q2 2018JLL Cleveland Office Outlook: Q2 2018
JLL Cleveland Office Outlook: Q2 2018
 
St. Louis Office Outlook Q3 2016
St. Louis Office Outlook Q3 2016St. Louis Office Outlook Q3 2016
St. Louis Office Outlook Q3 2016
 
JLL Detroit Office Insight & Statistics - Q1 2018
JLL Detroit Office Insight & Statistics - Q1 2018JLL Detroit Office Insight & Statistics - Q1 2018
JLL Detroit Office Insight & Statistics - Q1 2018
 
JLL Grand Rapids Office Insight & Statistics - Q1 2019
JLL Grand Rapids Office Insight & Statistics - Q1 2019JLL Grand Rapids Office Insight & Statistics - Q1 2019
JLL Grand Rapids Office Insight & Statistics - Q1 2019
 
JLL Cleveland Office Outlook: Q3 2019
JLL Cleveland Office Outlook: Q3 2019JLL Cleveland Office Outlook: Q3 2019
JLL Cleveland Office Outlook: Q3 2019
 
JLL Pittsburgh Office Insight & Statistics - Q4 2018
JLL Pittsburgh Office Insight & Statistics - Q4 2018JLL Pittsburgh Office Insight & Statistics - Q4 2018
JLL Pittsburgh Office Insight & Statistics - Q4 2018
 
Net lease Research Report Q1 2019
Net lease Research Report Q1 2019Net lease Research Report Q1 2019
Net lease Research Report Q1 2019
 
JLL Cleveland Office Outlook: Q1 2017
JLL Cleveland Office Outlook: Q1 2017JLL Cleveland Office Outlook: Q1 2017
JLL Cleveland Office Outlook: Q1 2017
 
JLL Pittsburgh Office Insight & Statistics - Q2 2020
JLL Pittsburgh Office Insight & Statistics - Q2 2020JLL Pittsburgh Office Insight & Statistics - Q2 2020
JLL Pittsburgh Office Insight & Statistics - Q2 2020
 
Q1 2018 | Houston Office | Research & Forecast Report
Q1 2018 | Houston Office | Research & Forecast ReportQ1 2018 | Houston Office | Research & Forecast Report
Q1 2018 | Houston Office | Research & Forecast Report
 
JLL Detroit Office Insight & Statistics - Q4 2018
JLL Detroit Office Insight & Statistics - Q4 2018JLL Detroit Office Insight & Statistics - Q4 2018
JLL Detroit Office Insight & Statistics - Q4 2018
 
JLL Louisville Industrial Outlook - Q3 2019
JLL Louisville Industrial Outlook - Q3 2019JLL Louisville Industrial Outlook - Q3 2019
JLL Louisville Industrial Outlook - Q3 2019
 
JLL Detroit Office Outlook: Q4 2015
JLL Detroit Office Outlook: Q4 2015JLL Detroit Office Outlook: Q4 2015
JLL Detroit Office Outlook: Q4 2015
 
JLL Louisville Industrial Outlook - Q3 2019
JLL Louisville Industrial Outlook - Q3 2019JLL Louisville Industrial Outlook - Q3 2019
JLL Louisville Industrial Outlook - Q3 2019
 
JLL Akron Office Outlook: Spring 2018
JLL Akron Office Outlook: Spring 2018JLL Akron Office Outlook: Spring 2018
JLL Akron Office Outlook: Spring 2018
 
JLL Detroit Office Insight & Statistics – Q2 2016
JLL Detroit Office Insight & Statistics – Q2 2016JLL Detroit Office Insight & Statistics – Q2 2016
JLL Detroit Office Insight & Statistics – Q2 2016
 

Similaire à JLL Dayton Office Report Summer 2020

Broward County Office Outlook - Q4 2018
Broward County Office Outlook - Q4 2018Broward County Office Outlook - Q4 2018
Broward County Office Outlook - Q4 2018JLL Florida
 
JLL Cincinnati Office Outlook Q2 2020
JLL Cincinnati Office Outlook Q2 2020JLL Cincinnati Office Outlook Q2 2020
JLL Cincinnati Office Outlook Q2 2020Abby Armbruster
 
JLL Pittsburgh Industrial Insight & Statistics - Q2 2020
JLL Pittsburgh Industrial Insight & Statistics - Q2 2020JLL Pittsburgh Industrial Insight & Statistics - Q2 2020
JLL Pittsburgh Industrial Insight & Statistics - Q2 2020Tobiah Bilski
 
JLL Louisville Office Outlook - Q2 2018
JLL Louisville Office Outlook - Q2 2018JLL Louisville Office Outlook - Q2 2018
JLL Louisville Office Outlook - Q2 2018Alex Westcott
 
JLL Cincinnati Industrial Outlook Q4 2020
JLL Cincinnati Industrial Outlook Q4 2020JLL Cincinnati Industrial Outlook Q4 2020
JLL Cincinnati Industrial Outlook Q4 2020Abby Armbruster
 
JLL Grand Rapids Office Insight & Statistics - Q1 2018
JLL Grand Rapids Office Insight & Statistics - Q1 2018JLL Grand Rapids Office Insight & Statistics - Q1 2018
JLL Grand Rapids Office Insight & Statistics - Q1 2018Harrison West
 
JLL St. Louis Industrial Outlook Q3 2019
JLL St. Louis Industrial Outlook Q3 2019JLL St. Louis Industrial Outlook Q3 2019
JLL St. Louis Industrial Outlook Q3 2019AndrewThompson315
 
JLL Cincinnati Industrial Outlook Q3 2020
JLL Cincinnati Industrial Outlook Q3 2020JLL Cincinnati Industrial Outlook Q3 2020
JLL Cincinnati Industrial Outlook Q3 2020Abby Armbruster
 
Q42012 Cincinnati Market Tr
Q42012 Cincinnati Market TrQ42012 Cincinnati Market Tr
Q42012 Cincinnati Market Trcolliersohio
 
St. louis Q4 2019 Industrial Outlook
St. louis Q4 2019 Industrial OutlookSt. louis Q4 2019 Industrial Outlook
St. louis Q4 2019 Industrial OutlookAndrewThompson315
 
JLL Cincinnati Industrial Outlook Q4 2017
JLL Cincinnati Industrial Outlook Q4 2017JLL Cincinnati Industrial Outlook Q4 2017
JLL Cincinnati Industrial Outlook Q4 2017Abby Armbruster
 
JLL Cleveland Industrial Outlook: Q4 2020
JLL Cleveland Industrial Outlook: Q4 2020JLL Cleveland Industrial Outlook: Q4 2020
JLL Cleveland Industrial Outlook: Q4 2020Andrew Batson
 
JLL Grand Rapids Office Insight & Statistics - Q2 2018
JLL Grand Rapids Office Insight & Statistics - Q2 2018JLL Grand Rapids Office Insight & Statistics - Q2 2018
JLL Grand Rapids Office Insight & Statistics - Q2 2018Harrison West
 
JLL Grand Rapids Office Insight & Statistics - Q3 2018
JLL Grand Rapids Office Insight & Statistics - Q3 2018JLL Grand Rapids Office Insight & Statistics - Q3 2018
JLL Grand Rapids Office Insight & Statistics - Q3 2018Harrison West
 

Similaire à JLL Dayton Office Report Summer 2020 (20)

Broward County Office Outlook - Q4 2018
Broward County Office Outlook - Q4 2018Broward County Office Outlook - Q4 2018
Broward County Office Outlook - Q4 2018
 
JLL Cincinnati Office Outlook Q2 2020
JLL Cincinnati Office Outlook Q2 2020JLL Cincinnati Office Outlook Q2 2020
JLL Cincinnati Office Outlook Q2 2020
 
JLL Pittsburgh Industrial Insight & Statistics - Q2 2020
JLL Pittsburgh Industrial Insight & Statistics - Q2 2020JLL Pittsburgh Industrial Insight & Statistics - Q2 2020
JLL Pittsburgh Industrial Insight & Statistics - Q2 2020
 
JLL Louisville Office Outlook - Q2 2018
JLL Louisville Office Outlook - Q2 2018JLL Louisville Office Outlook - Q2 2018
JLL Louisville Office Outlook - Q2 2018
 
JLL Cincinnati Industrial Outlook Q4 2020
JLL Cincinnati Industrial Outlook Q4 2020JLL Cincinnati Industrial Outlook Q4 2020
JLL Cincinnati Industrial Outlook Q4 2020
 
JLL Grand Rapids Office Insight & Statistics - Q1 2018
JLL Grand Rapids Office Insight & Statistics - Q1 2018JLL Grand Rapids Office Insight & Statistics - Q1 2018
JLL Grand Rapids Office Insight & Statistics - Q1 2018
 
JLL St. Louis Industrial Outlook Q3 2019
JLL St. Louis Industrial Outlook Q3 2019JLL St. Louis Industrial Outlook Q3 2019
JLL St. Louis Industrial Outlook Q3 2019
 
Detroit JLL Office Employment update july 2015
Detroit JLL Office Employment update july 2015Detroit JLL Office Employment update july 2015
Detroit JLL Office Employment update july 2015
 
JLL Cincinnati Industrial Outlook Q3 2020
JLL Cincinnati Industrial Outlook Q3 2020JLL Cincinnati Industrial Outlook Q3 2020
JLL Cincinnati Industrial Outlook Q3 2020
 
Q1 2020 | Fort Bend Submarket Snapshot
Q1 2020 | Fort Bend Submarket SnapshotQ1 2020 | Fort Bend Submarket Snapshot
Q1 2020 | Fort Bend Submarket Snapshot
 
Houston industrial report suite q1 2018
Houston industrial report suite q1 2018Houston industrial report suite q1 2018
Houston industrial report suite q1 2018
 
Q42012 Cincinnati Market Tr
Q42012 Cincinnati Market TrQ42012 Cincinnati Market Tr
Q42012 Cincinnati Market Tr
 
St. louis Q4 2019 Industrial Outlook
St. louis Q4 2019 Industrial OutlookSt. louis Q4 2019 Industrial Outlook
St. louis Q4 2019 Industrial Outlook
 
JLL Cincinnati Industrial Outlook Q4 2017
JLL Cincinnati Industrial Outlook Q4 2017JLL Cincinnati Industrial Outlook Q4 2017
JLL Cincinnati Industrial Outlook Q4 2017
 
JLL Cleveland Industrial Outlook: Q4 2020
JLL Cleveland Industrial Outlook: Q4 2020JLL Cleveland Industrial Outlook: Q4 2020
JLL Cleveland Industrial Outlook: Q4 2020
 
Detroit JLL Industrial Employment Update May 2015
Detroit JLL Industrial Employment Update May 2015Detroit JLL Industrial Employment Update May 2015
Detroit JLL Industrial Employment Update May 2015
 
JLL Detroit Office Employment Update April 2015
JLL Detroit Office Employment Update April 2015JLL Detroit Office Employment Update April 2015
JLL Detroit Office Employment Update April 2015
 
JLL Grand Rapids Office Insight & Statistics - Q2 2018
JLL Grand Rapids Office Insight & Statistics - Q2 2018JLL Grand Rapids Office Insight & Statistics - Q2 2018
JLL Grand Rapids Office Insight & Statistics - Q2 2018
 
Q4 2020 Austin Office Report
Q4 2020 Austin Office ReportQ4 2020 Austin Office Report
Q4 2020 Austin Office Report
 
JLL Grand Rapids Office Insight & Statistics - Q3 2018
JLL Grand Rapids Office Insight & Statistics - Q3 2018JLL Grand Rapids Office Insight & Statistics - Q3 2018
JLL Grand Rapids Office Insight & Statistics - Q3 2018
 

Plus de Abby Armbruster

JLL Cincinnati Industrial Outlook Q1 2021
JLL Cincinnati Industrial Outlook Q1 2021JLL Cincinnati Industrial Outlook Q1 2021
JLL Cincinnati Industrial Outlook Q1 2021Abby Armbruster
 
JLL Cincinnati Industrial Outlook Q3 2017
JLL Cincinnati Industrial Outlook  Q3 2017JLL Cincinnati Industrial Outlook  Q3 2017
JLL Cincinnati Industrial Outlook Q3 2017Abby Armbruster
 
Jll cincinnati office outlook q2 2017
Jll cincinnati office outlook   q2 2017Jll cincinnati office outlook   q2 2017
Jll cincinnati office outlook q2 2017Abby Armbruster
 
Jll cincinnati industrial outlook q1 2017
Jll cincinnati industrial outlook   q1 2017Jll cincinnati industrial outlook   q1 2017
Jll cincinnati industrial outlook q1 2017Abby Armbruster
 
Jll cincinnati office outlook q1 2017
Jll cincinnati office outlook   q1 2017Jll cincinnati office outlook   q1 2017
Jll cincinnati office outlook q1 2017Abby Armbruster
 
JLL Great Lakes Full Circle Report 2017
JLL Great Lakes Full Circle Report 2017JLL Great Lakes Full Circle Report 2017
JLL Great Lakes Full Circle Report 2017Abby Armbruster
 

Plus de Abby Armbruster (6)

JLL Cincinnati Industrial Outlook Q1 2021
JLL Cincinnati Industrial Outlook Q1 2021JLL Cincinnati Industrial Outlook Q1 2021
JLL Cincinnati Industrial Outlook Q1 2021
 
JLL Cincinnati Industrial Outlook Q3 2017
JLL Cincinnati Industrial Outlook  Q3 2017JLL Cincinnati Industrial Outlook  Q3 2017
JLL Cincinnati Industrial Outlook Q3 2017
 
Jll cincinnati office outlook q2 2017
Jll cincinnati office outlook   q2 2017Jll cincinnati office outlook   q2 2017
Jll cincinnati office outlook q2 2017
 
Jll cincinnati industrial outlook q1 2017
Jll cincinnati industrial outlook   q1 2017Jll cincinnati industrial outlook   q1 2017
Jll cincinnati industrial outlook q1 2017
 
Jll cincinnati office outlook q1 2017
Jll cincinnati office outlook   q1 2017Jll cincinnati office outlook   q1 2017
Jll cincinnati office outlook q1 2017
 
JLL Great Lakes Full Circle Report 2017
JLL Great Lakes Full Circle Report 2017JLL Great Lakes Full Circle Report 2017
JLL Great Lakes Full Circle Report 2017
 

JLL Dayton Office Report Summer 2020

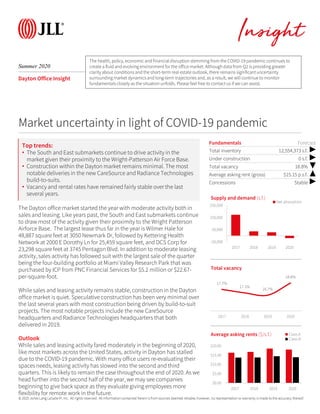
  • 1. © 2018 Jones Lang LaSalle IP, Inc. All rights reserved. All information contained herein is from sources deemed reliable; however, no representation or warranty is made to the accuracy thereof. Market uncertainty in light of COVID-19 pandemic Insight Summer 2020 Dayton Office Insight The Dayton office market started the year with moderate activity both in sales and leasing. Like years past, the South and East submarkets continue to draw most of the activity given their proximity to the Wright Patterson Airforce Base. The largest lease thus far in the year is Wilmer Hale for 48,887 square feet at 3050 Newmark Dr, followed by Kettering Health Network at 2000 E Dorothy Ln for 25,459 square feet, and DCS Corp for 23,298 square feet at 3745 Pentagon Blvd. In addition to moderate leasing activity, sales activity has followed suit with the largest sale of the quarter being the four-building portfolio at Miami Valley Research Park that was purchased by ICP from PNC Financial Services for $5.2 million or $22.67- per-square-foot. While sales and leasing activity remains stable, construction in the Dayton office market is quiet. Speculative construction has been very minimal over the last several years with most construction being driven by build-to-suit projects. The most notable projects include the new CareSource headquarters and Radiance Technologies headquarters that both delivered in 2019. Outlook While sales and leasing activity fared moderately in the beginning of 2020, like most markets across the United States, activity in Dayton has stalled due to the COVID-19 pandemic. With many office users re-evaluating their spaces needs, leasing activity has slowed into the second and third quarters. This is likely to remain the case throughout the end of 2020. As we head further into the second half of the year, we may see companies beginning to give back space as they evaluate giving employees more flexibility for remote work in the future. Top trends: • The South and East submarkets continue to drive activity in the market given their proximity to the Wright-Patterson Air Force Base. • Construction within the Dayton market remains minimal. The most notable deliveries in the new CareSource and Radiance Technologies build-to-suits. • Vacancy and rental rates have remained fairly stable over the last several years. Fundamentals Forecast Total inventory 12,554,373 s.f. ▶ Under construction 0 s.f. ▶ Total vacancy 18.8% ▼ Average asking rent (gross) $15.15 p.s.f. ▲ Concessions Stable ▶ -50,000 50,000 150,000 250,000 2017 2018 2019 2020 Supply and demand (s.f.) Net absorption 17.7% 17.1% 16.7% 18.8% 2017 2018 2019 2020 Total vacancy $0.00 $5.00 $10.00 $15.00 $20.00 2017 2018 2019 2020 Average asking rents ($/s.f.) Class A Class B The health, policy, economic and financialdisruption stemming from the COVID-19 pandemic continues to create a fluid and evolving environment for the office market. Although data from Q2 is providing greater clarity about conditions and the short-term real estate outlook, there remains significant uncertainty surrounding market dynamics and long-term trajectories and, as a result, we will continue to monitor fundamentalsclosely as the situation unfolds. Please feel free to contact us if we can assist. © 2020 Jones Lang LaSalle IP, Inc. All rights reserved. All information contained herein is from sources deemed reliable; however, no representation or warranty is made to the accuracy thereof.
  • 2. © 2018 Jones Lang LaSalle IP, Inc. All rights reserved. All information contained herein is from sources deemed reliable; however, no representation or warranty is made to the accuracy thereof. Summer 2020 Dayton Office Market Statistics Methodology: JLL tracks office buildings ≥20,000 square feet. Government, medical and owner-occupied buildings are excluded. Class Inventory (s.f.) Total Availability (s.f.) Total Availability (%) Average direct asking rent ($ p.s.f.) CBD Totals 5,209,080 529,254 24.0% $14.41 East Totals 2,376,014 251,887 10.6% $18.89 North Totals 801,769 169,350 21.1% $14.31 South Totals 4,051,360 691,883 17.1% $15.70 Upper Valley Totals 74,138 13,403 18.1% $18.00 West Totals 116,150 - 0.0% $0.00 Suburbs Totals 7,345,293 1,113,120 15.2% $16.15 Dayton Totals 12,554,373 2,363,467 18.8% $15.15 CBD A 1,877,943 529,254 28.2% $16.84 East A 1,226,952 136,584 11.1% $23.94 North A 141,150 22,957 16.3% $17.50 Suburbs A 2,869,170 293,178 10.2% $20.76 Dayton A 4,747,113 822,432 17.3% $18.02 CBD B 3,331,137 721,093 21.6% $12.99 East B 1,149,062 115,303 10.0% $16.44 North B 660,619 146,393 22.2% $13.64 South B 2,550,292 558,246 21.9% $14.86 Upper Valley B 74,138 13,403 18.1% $18.00 West B 116,150 - 0.0% $0.00 Suburbs B 4,476,123 819,942 18.3% $14.88 Dayton B 7,807,260 1,541,035 19.7% $13.89 © 2020 Jones Lang LaSalle IP, Inc. All rights reserved. All information contained herein is from sources deemed reliable; however, no representation or warranty is made to the accuracy thereof.
  • 3. © 2018 Jones Lang LaSalle IP, Inc. All rights reserved. All information contained herein is from sources deemed reliable; however, no representation or warranty is made to the accuracy thereof. Summer 2020 Dayton Office Market Market activity 3 Sale Lease 1 2 6 4 Address: 2661 Commons Blvd Lease Size: 14,900 Move Date: Q2 2020 Tenant: DeciBel Research 4 5 Address: 424 E First St Lease Size: 5,500 Move Date: Q2 2020 Tenant: Brackett Builders Inc 1 Address: 1 S Main St Square Feet: 343,236 Price: $7,444,947 Price/SF: $21.69 Buyer: R.L.R Investments, LLC Seller: CWCapital Asset Management, LLC This dashboard analyzes a partial list of office market activity in the Dayton market YTD 5 2 Address: 3050 Newmark Dr Lease Size: 48,887 Move Date: Q1 2020 Tenant: Wilmer Hale 3 Address: 3745 Pentagon Blvd Lease Size: 23,298 Move Date: Q1 2020 Tenant: DCS Corp 6 Building Park: Miami Valley Research Park Square Feet: 229,366 Price: $2,224,363 Price/SF: $22.24 Buyer: ICP, LLC Seller: PNC Financial Services Group, Inc. © 2020 Jones Lang LaSalle IP, Inc. All rights reserved. All information contained herein is from sources deemed reliable; however, no representation or warranty is made to the accuracy thereof.
  • 4. © 2018 Jones Lang LaSalle IP, Inc. All rights reserved. All information contained herein is from sources deemed reliable; however, no representation or warranty is made to the accuracy thereof. Andrew Batson Vice President, Director of Research +1 216 937 4374 andrew.batson@am.jll.com Employment Abby Armbruster Senior Research Analyst +1 513 252 2148 abby.armbruster@am.jll.com Contact: 11.7%U.S. unemployment -9.5%U.S. 12-month job growth 12.7%Dayton unemployment -11.2%Dayton 12-month job growth 13.7%Ohio unemployment -13.6%Ohio 12-month job growth Summer 2020 Dayton Office Market -18.0% -15.0% -12.0% -9.0% -6.0% -3.0% 0.0% 3.0% 201 3 201 4 201 5 201 6 201 7 201 8 201 9 Dayton U.S. Job growth* Historical employment Office employment* * Represents 12-month change in employment. All charts represent the latest economic data available from the Bureau of Labor Statistics as of May 2020. © 2018 Jones Lang LaSalle IP, Inc. All rights reserved. All information contained herein is from sources deemed reliable; however, no representation or warranty is made to the accuracy thereof. 0% 4% 8% 12% 16% 100,000 200,000 300,000 400,000 500,000 2013 2014 2015 2016 2017 2018 2019 2020 Employment Unemployment -5.0 -3.0 -1.0 1.0 3.0 5.0 7.0 2014 2015 2016 2017 2018 2019 2020 Professional & Business Services Information Government Financial Activities © 2020 Jones Lang LaSalle IP, Inc. All rights reserved. All information contained herein is from sources deemed reliable; however, no representation or warranty is made to the accuracy thereof.