1. Chapter 17
Prenatal Diagnosis of Congenital Disorders
Ronald J. Wapner, MD, Thomas M. Jenkins, MD, and Nahla Khalek, MD
Prenatal diagnosis, a term once considered synonymous with invasive the disease on the positive and negative predictive values is described
fetal testing and karyotype evaluation, now encompasses pedigree in Chapter 16 and is shown in Tables 16-6 and 16-7.
analysis, population screening, fetal risk assessment, genetic counsel- Use of screening tests requires that cutoff values for “positive” tests
ing, and fetal diagnostic testing. Although prenatal evaluation of the be set. Performance of the test depends on this cutoff; for example,
fetus for genetic disorders can have a huge impact on individual fami- increased detection rate can be obtained by lowering the cutoff thresh-
lies, most screening and testing is done for events that occur in less old, but the concomitant lowered specificity would result in more
than 1% of pregnancies. In this chapter, we describe different modali- false-positive results. Table 17-1 shows the performance of second-tri-
ties available for in utero fetal diagnosis of congenital disorders, the mester maternal serum screening for Down syndrome based on various
approach to screening ongoing pregnancies for genetic disease, and the cutoffs.1 A receiver operating curve can be used as a statistical method
counseling requirement for each. to find the “best” balance between sensitivity and specificity. A line
diagram is plotted with sensitivity on the vertical axis and the false-
positive rate plotted horizontally (Fig. 17-1). The greater the area
under the curve (toward the upper left corner), the better the test’s
Screening for Fetal performance is, with increasing sensitivity and a reduced false-positive
Genetic Disorders rate.
When screening for Down syndrome, cutoff values are important
Detecting or defining risk for disease in an asymptomatic low-risk for laboratories that provide the testing and for clinicians who inter-
population is the goal of screening. As opposed to diagnostic testing, pret the results. When viewed from the patient’s perspective, reporting
intended to identify or confirm an affected individual, screening is tests as positive or negative can be confusing. Receipt of a “positive”
intended to identify populations who have an increased risk for a spe- result of 1 in 250 may lead to a choice of a diagnostic test that carries
cific disorder, and for whom diagnostic testing may be warranted. An a risk of complications, whereas a “negative” result of 1 in 290 may
ideal perinatal genetic screening test should fulfill the following provide greater reassurance than intended, when in fact the actual risk
criteria: of Down syndrome is similar for both patients. Often, explaining the
significance of a positive or negative result before the screening test is
Identify common or important fetal disorders performed will assist patients in understanding their results. Many
Be cost-effective and easy to perform centers report the absolute risk to the patient to further help in inter-
Have a high detection rate and a low false-positive rate pretation. Regardless of the counseling approach, understanding the
Be reliable and reproducible concept of screening is difficult for many patients. From the perspec-
Test for disorders for which a diagnostic test exists tive of the laboratory or clinician, selection of a cutoff that is too high
Be positive early enough in gestation to permit safe and legal or too low will lead to overutilization or underutilization of diagnostic
options for pregnancy termination if desired tests and the consequent risk of procedure-related pregnancy loss or
false reassurance, respectively.
Sensitivity and specificity are two key concepts in screening test
performance (see Chapter 16). Sensitivity is the percentage of affected
pregnancies that are screen positive. Specificity is the percentage of Likelihood Ratios
individuals with unaffected pregnancies who screen negative. The The impact of a positive screening test depends on the pretest (a priori)
reciprocal of specificity is the false-positive rate. Sensitivity and speci- risk of an affected pregnancy. Likelihood ratios are statistical means
ficity are independent of disease frequency, and they describe the to modify an individual’s risk based on known data for a population.
anticipated performance of a screening test in the population. Alter- For binary risk factors that are either present or absent, likelihood
natively, positive and negative predictive values are dependent on ratios are determined by comparing the frequency of positive tests in
disease prevalence and are vital in the interpretation of the test result affected pregnancies to the frequency in normal pregnancies. This is
for an individual patient. These latter two values represent, respectively, calculated as the sensitivity of the test divided by its false-positive rate
the likelihood that a person with a positive or negative test does or (likelihood ratio = sensitivity/false-positive rate). For tests that use
does not have an affected pregnancy. The impact of the prevalence of continuous variables (such as serum marker measurements), likeli-
2. 222 CHAPTER 17 Prenatal Diagnosis of Congenital Disorders
TABLE 17-1 DOWN SYNDROME DETECTION: TABLE 17-2 ADJUSTING THE RISK FOR DOWN
FALSE-POSITIVE RATES (FPR) AT SYNDROME USING LIKELIHOOD
DIFFERENT CUTOFF VALUES RATIOS FOR BINARY
ULTRASOUND MARKERS
Triple Quadruple
Screen Detection Screen Detection A priori risk of Down syndrome (age or serum screen) 1 : 1000
Cutoff Rate FPR Cutoff Rate FPR Positive ultrasound marker for Down syndrome
Rate in Down syndrome population (sensitivity 10%
1 : 200 57 4.3 1 : 200 60 3.5
of marker)
1 : 250 61 5.6 1 : 250 64 4.5
Rate in general population (FPR of marker) 1.0%
1 : 300 64 6.8 1 : 300 67 5.5
Likelihood ratio (sens/FPR) 10.0
1 : 350 67 8.1 1 : 350 69 6.5
Adjusted risk for Down syndrome
1 : 400 69 9.3 1 : 400 72 7.6
(A priori risk × likelihood ratio) = 1/1000 × 10 1 : 100
Data from Huang T, Watt H, Wald N: The effect of differences in the
FPR, false-positive rate; sens, sensitivity.
distribution of maternal age in England and Wales on the performance
of prenatal screening for Down’s syndrome. Prenat Diagn 17:615, 1997.
level and subsequent public policy was determined more than 25 years
100
ago and was based on a maternal age risk of 35 years at delivery. The
Rate of detection of Down syndrome (%)
90 factors considered in determining this value included the prevalence
80 of disease, a perceived significant increase in the trisomy 21 risk after
this age, the risk of invasive testing, the availability of resources, and
70 a cost-to-benefit analysis. Since that time, a number of additional
60 screening tests for Down syndrome have become available that chal-
lenge the validity of maternal age as a single indication for invasive
50
testing.
40
30
Maternal Age as a Screening Test
20 The association of Down syndrome with advancing maternal age was
10 first reported in 1909.2 Fifty years later, karyotype analysis was devel-
oped and correlated the Down syndrome phenotype with an extra G
0
0 10 20 30 40 50 60 70 80 90 100 chromosome.3 This led to the development of genetic amniocentesis,
False-positive rate (%) through which the prenatal diagnosis of Down syndrome became fea-
sible. To standardize the use of this emerging technology, a consensus
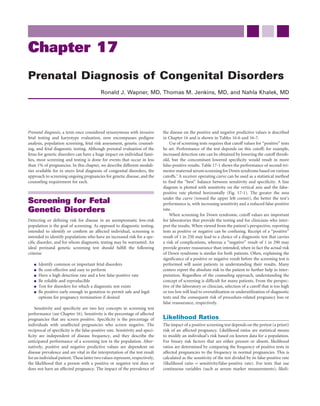
FIGURE 17-1 Receiver operating curve demonstrating sensitivity report from the National Institutes of Health in 1979 suggested that
for Down syndrome detection versus false-positive rate. Cutoff amniocentesis be routinely offered to women aged 35 years or older at
points for sensitivity versus false-positive rate are determined by delivery. At that time, maternal age risks of Down syndrome were
these curves. (From Haddow JE, Palomaki GE, Knight GJ, et al: available only in 5-year groupings. Using these data, the age of 35
Reducing the need for amniocentesis in women 35 years of age or seemed a natural cutoff, because women in the 30- to 34-year grouping
older with serum markers for screening. N Engl J Med 330:1114,
had a risk of 1 : 880, and the risk for women aged 35 to 40 was almost
1994.)
fourfold higher. This cutoff was based on a number of factors, includ-
ing the availability of experienced operators and cytogenetics labora-
tories, the cost-to-benefit ratio, and the balance between
hood ratios are calculated from the log gaussian distributions of procedure-related losses and the possibility of a positive finding. This
normal and affected pregnancies. Once a likelihood ratio is deter- cutoff continues to be used, and the second-trimester risk of 1 : 270 or
mined, it can be used to modify the a priori risk (Table 17-2). If more liveborn risk of 1 : 380 remains the standard value for offering women
than one likelihood ratio is available and is independent of other invasive testing.
parameters, it also can be used to modify risk. In this way, multiple The risk for Down syndrome is now recognized to be continuous,
factors (such as maternal age, serum analytes, and ultrasound findings) which emphasizes the arbitrary nature of an absolute age threshold of
can be simultaneously used to modify risk. 35. In addition to maternal age, the risk of trisomy 21 depends on the
gestational age at which testing is performed, because only 69% of
first-trimester and 76% of second-trimester Down syndrome pregnan-
cies are viable (Table 17-3).4 Currently, more than 80% of diagnostic
procedures to determine fetal karyotype performed in the United
Antenatal Screening for States are performed solely for “advanced maternal age,” yet 70% of
Down Syndrome affected pregnancies are born to women outside this group. With many
women delaying childbirth until later in life, more than 14% of preg-
There has been a general consensus in the United States that invasive nant women in the United States are being offered testing based on age
testing for Down syndrome should be offered to women with a second- alone. In Switzerland and the United Kingdom, almost 15% of births
trimester risk of 1 : 270 or higher (liveborn risk of 1 : 380). The cutoff now occur in women older than 35.
3. CHAPTER 17 Prenatal Diagnosis of Congenital Disorders 223
TABLE 17-3 RISK FOR DOWN SYNDROME are elevated in Down syndrome pregnancies (1.3 to 2.5 MoM) and do
BASED ON MATERNAL AND not vary with gestational age in the second trimester. There is, however,
a small correlation with hCG levels, making the added sensitivity for
GESTATIONAL AGES
Down syndrome detection less robust.19 Detection rates when a quad
Gestational Age screen of α-fetoprotein (AFP), hCG, unconjugated estriol, and inhibin
Maternal Age
A are used are about 75% (screen positive rate, 5%) in the population
(yr) 12 Wk 16 Wk 20 Wk Liveborn
under age 35 years.20 For women older than 35, the detection rate is
20 1/1068 1/1200 1/1295 1/1527 approximately 92% with a screen-positive rate of 13%.
25 1/946 1/1062 1/1147 1/1352 Other analytes or combinations of analytes have been tested to
30 1/626 1/703 1/759 1/895 further increase sensitivity. Hyperglycosylated hCG excreted in mater-
31 1/543 1/610 1/658 1/776 nal urine has been tested as a marker for Down syndrome. One study
32 1/461 1/518 1/559 1/659
of nearly 1500 women (1448 control subjects and 39 Down syndrome
33 1/383 1/430 1/464 1/547
34 1/312 1/350 1/378 1/446 pregnancies) reported a sensitivity of 96% of affected pregnancies with
35 1/249 1/280 1/302 1/356 a 5% false-positive rate and 71% detection with a 1% false-positive
36 1/196 1/220 1/238 1/280 rate when a combination of hyperglycosylated hCG, urine β-core hCG
37 1/152 1/171 1/185 1/218 fragment, MSAFP, and maternal age was used.21 This detection rate,
38 1/117 1/131 1/142 1/167 however, has not been duplicated by others.
39 1/89 1/100 1/108 1/128 With the addition of extra markers, the potential benefit must be
40 1/68 1/76 1/82 1/97 balanced against the cost. With each additional marker, costs to society
42 1/38 1/43 1/46 1/55 can balloon into the millions because of the number of pregnancies
44 1/21 1/24 1/26 1/30
tested each year with only a minimal improvement in detection. The
45 1/16 1/18 1/19 1/23
relative cost and value of raising the sensitivity or lowering the false-
Data from Hook EB: Rates of chromosome abnormalities at different positive rate a few percentage points is an ongoing debate.
maternal ages. Obstet Gynecol 58:282, 1981.
Abnormal Second Trimester Maternal
Serum Markers in Pregnancies with a
Second-Trimester Maternal Normal Karyotype
Serum Screening
Serum screening may be used to identify the 70% of Down syndrome Unexplained Elevated Maternal
pregnancies in women less than 35 years of age. This approach is Serum a-Fetoprotein
derived from a 1984 report of lower maternal serum α-fetoprotein When an elevated MSAFP is reported in pregnancies in which the ges-
(MSAFP) levels in women carrying a Down syndrome fetus. Women tational age is correctly assigned and the fetus is structurally normal,
with Down syndrome pregnancies had a median MSAFP value of 0.75 and the amniotic fluid AFP (AFAFP) is normal, the biologic explanation
multiples of the unaffected median (MoM).5,6 Using this deviation to is almost always a breach in the maternal-fetal interface. This leads to
calculate a likelihood ratio, the age-related risk for Down syndrome higher AFP levels in the maternal circulation. Not surprisingly, women
could be modified. When the standard 1 : 270 cutoff was used, approxi- with unexplained elevation in AFP levels have been found to have
mately 25% of Down syndrome pregnancies among women less than increased risk of obstetric complications, including fetal growth restric-
35 years of age were screen-positive.7-9 tion, fetal death, prematurity, oligohydramnios, abruptio placentae, and
Elevated human chorionic gonadotropin (hCG) (mean, 2.3 MoM) preeclampsia. Table 17-4 summarizes the numerous reports; the higher
and reduced levels of unconjugated estriol (mean, 0.7 MoM) were the MSAFP level is, the greater the risk. Crandall and colleagues22
subsequently linked to an increased risk of trisomy 21.6,10,11 hCG or studied 1002 women with MSAFP values greater than 2.5 MoM and
reduced levels of unconjugated estriol used alone to modify the mater- stratified them by the degree of elevation. In those with a normal ultra-
nal age risk has a Down syndrome detection rate of only 20% to 30%. sound and amniocentesis, the risk of adverse outcome was 27% overall
However, because they are independent variables, they can be analyzed but varied with the degree of elevation. Adverse outcome occurred in
simultaneously with maternal age and AFP to form a composite risk 16% when the MSAFP was 2.5 to 2.9 MoM, 29% when it was 3.0 to
calculation (frequently called a triple screen). 5.0 MoM, and 70% when it was greater than 5.0 MoM. Waller and
The sensitivity of the triple screen for Down syndrome detection coworkers23-25 investigated 51,008 women screened with MSAFP in
in women younger than 35 years ranges between 57% and 67% if the California to evaluate the predictive value of high MSAFP compared
false-positive rate is held constant at 5%.12-15 Overall, the odds of with low levels. The risk of delivery before 28 weeks was 0.4% with low
having an affected pregnancy with a positive screen are approximately values (<0.81 MoM) and 3.2% for those with high values (>2.5 MoM),
1 in 33 to 1 in 62, depending on the age range of the population an eightfold difference. The rates for delivery before 37 weeks were 2.6%
studied,16,17 an improvement over the 1 : 100 odds when maternal age for the low MSAFP group and 24.3% for the high MSAFP group.
is the sole screening parameter. Because of the impact of maternal age Notably, women with MSAFP values greater than 2.5 MoM had a 10.5-
on the risk analysis, screening women who will be 35 years of age or fold increase in preeclampsia and a 10-fold increased risk of placental
more increases the sensitivity using the same cutoffs to approximately complications, suggesting that an elevated value in the absence of an
87% but with a false-positive rate of nearly 25%.13,18 anomaly may derive from a fetal-maternal hemorrhage of sufficient
Inhibin A, a protein produced initially by the corpus luteum and volume to have clinical significance. This observation may explain the
later by the placenta, is now routinely included in second-trimester elevation in MSAFP, but to date no management protocol has been
Down syndrome screening resulting in a “quad screen.” Inhibin A levels demonstrated to improve outcome in these cases.
4. 224 CHAPTER 17 Prenatal Diagnosis of Congenital Disorders
TABLE 17-4 STUDIES EVALUATING THE RELATION OF UNEXPLAINED ELEVATIONS OF MSAFP
AND POOR PREGNANCY OUTCOME
Pregnancies MoM IUGR Premature Abruption IUFD Perinatal
Source Location (Year) Screened Cutoff LBW Risk Risk Delivery Risk Risk Risk Death
Brock et al (505, 506) Scotland (1977, 15,481 2.3 2.5× + +
1979)
Wald et al (507, 508) England (1977, 3,194 3.0 4.7× 5.8× 3.5×
1980)
4,198
Macri et al (509) New York (1978) 6,031 2.0 2.0×
Gordon et al (510) England (1978) 1,055 2.0 3.5× 4.5×
Smith (511) England (1980) 1,500 2.0 + + + +
Evans and Stokes Wales (1984) 2,913 2.0 3.0× + 8.0×
(512)
Burton et al (513, 514) North Carolina 42,037 2.5 2.0× 8.0× 10.0×
(1983, 1988)
Persson et al (515) Sweden (1983) 10,147 2.3 2.8× 2.0× 10.0× 3.0×
Haddow et al (516) Maine (1983) 3,636 2.0 3.6× 2.0×
Purdie et al (517) Scotland (1983) 7,223 2.5 2.5× 20.0×
Fuhrmann and Weitzel West Germany 50,000 2.5 3.5× 8.6×
(518) (1985)
Williamson et al (519) Iowa (1986) 1,161 Poor outcomes
Robinson et al (520) California (1989) 35,787 2.0 3.5×
Ghosh et al (521) Hong Kong (1986) 9,838 2.0 +
Schnittger and Kjessler Sweden (1984) 18,037 2.0 + +
(522)
Hamilton et al (523) Scotland (1985) 10,885 2.5 10.0× 2× >10.0× 3.0× 8.0×
Doran et al (524) Ontario (1987) 8,140 2.0 6.0× +
Milunsky et al (525) Massachusetts 13,486 2.0 4.0× 3.0× 8.0× +
(1989)
IUFD, intrauterine fetal demise; IUGR, intrauterine growth retardation; LBW, low birth weight; MoM, multiple of the median; MSAFP; maternal serum
a-fetoprotein; +, increased risk but unquantified.
Data from Milunsky A (ed): Genetic Disorders and the Fetus: Diagnosis, Prevention, and Treatment, 3rd ed. Baltimore, Johns Hopkins University Press,
1992, p 656.
0.0 to 0.15 MoM suggest biochemical abnormalities of the fetus
Unexplained Elevated Human Chorionic or placenta, including placental steroid sulfatase deficiency, Smith-
Gonadotropin Levels Lemli-Opitz syndrome, congenital adrenal hypoplasia, adrenocor-
The risk for adverse pregnancy outcome with elevated hCG levels ticotropin deficiency, hypothalamic corticotropin deficiency, and
appears to be independent of those associated with elevated AFP. anencephaly.
Studies have shown that unexplained elevated hCG (greater than Smith-Lemli-Opitz syndrome is an autosomal recessive disorder
2.0 MoM) is associated with an increased risk of preeclampsia, preterm resulting from a defect in 3αβ-hydroxysteroid-α7-reductase, altering
birth, low birth weight, fetal demise, and possibly hypertension.26 It cholesterol synthesis and resulting in low cholesterol levels and the
appears that the higher the hCG is, the greater the risk. accumulation of the cholesterol precursor 7-dehydrocholesterol in
blood and amniotic fluid. Because cholesterol is a precursor of estriol,
Elevated Human Chorionic Gonadotropin and the defect results in reduced or undetectable levels of estriol in mater-
Maternal Serum a-Fetoprotein nal serum and amniotic fluid. Smith-Lemli-Opitz syndrome is charac-
The combination of elevated MSAFP and hCG levels occurs rarely but terized by low birth weight, failure to thrive, and moderate to severe
may have an overall pregnancy complication rate exceeding 50%. A mental retardation. It is associated with multiple structural anomalies,
study of 66 singleton and 33 multiple pregnancies with an MSAFP of including syndactyly of the second and third toes, microcephaly, ptosis,
more than 2 MoM and an hCG of more than 3.0 MoM found that 60% and a typical-appearing facies.32-34 Undermasculinization of the gene-
of singletons and 81% of twins had at least one of several obstetric talia including complete sex reversal can be seen in male fetuses.
complications, including preeclampsia, preterm birth, growth restric- Bradley and colleagues35 summarized findings in 33 women who
tion, placental abnormalities, and fetal death.27 Confined placental delivered infants with Smith-Lemli-Opitz syndrome. Twenty-four of
mosaicism for chromosome 16 has been reported to be associated with 26 women who had second-trimester estriol values obtained had levels
extremely high levels of both analytes, as well as with similarly poor less than the 5th percentile (<0.5 MoM). The median level in this
outcomes.28,29 group was 0.23 MoM (below the first percentile). A risk assessment
based on low maternal serum unconjugated estriol levels has been
Low Second-Trimester Maternal Serum Estriol suggested but is not presently available.36 Reliable and inexpensive
Low maternal serum unconjugated estriol levels have been linked to prenatal testing for Smith-Lemli-Opitz syndrome based on amniotic
adverse pregnancy outcomes.30,31 Very low or absent estriol levels of fluid cholesterol or 7-dehydrocholesterol levels is available.37
5. CHAPTER 17 Prenatal Diagnosis of Congenital Disorders 225
Placental steroid sulfatase deficiency is an X-linked recessive disor- TABLE 17-5 SECOND-TRIMESTER
der resulting from deletion of Xp22.3. This enzyme deficiency prevents ULTRASOUND MARKERS
removal of the sulfate molecule from fetal estrogen precursors, pre-
ASSOCIATED WITH DOWN
venting conversion to estriol. The fetal phenotype depends on the
SYNDROME
extent of the deletion, with greater than 90% of cases presenting as X-
linked ichthyosis that can be treated with topical keratolytic agents. Brachycephaly
However, in about 5% of cases, there can be a deletion of contiguous Increased nuchal thickness
genes causing mental retardation. The deletion can, on occasion, Congenital heart defects
extend to cause Kallman syndrome or chondrodysplasia punctata. The Hyperechoic bowel
lack of estrogen biosynthesis may result in delayed onset of labor, Shortened femur
prolonged labor, or stillbirth. Shortened humerus
Renal pyelectasis
Prenatal diagnosis for the deletion leading to placental sulfatase
Duodenal atresia
deficiency and congenital ichthyosis can be performed by identifying Hypoplasia of the midphalanx of the fifth digit
the gene deletion by karyotype or fluorescence in situ hybridization.38-40 Echogenic intracardiac focus
Although very low estriol levels, usually below the level of detection, “Sandal gap” of the foot
can identify males at risk for this disorder, testing in these cases is not Widened ischial spine angle
routinely offered because the phenotype is usually mild. However, the Foot length
rarer, more serious cases of extensive deletions will be missed.41 Short or absent nasal bone
Second-Trimester Ultrasound Markers
of Down Syndrome pleted and the results of serum screening have been reported. Markers
The clinical suspicion of Down syndrome is suspected when an infant commonly sought to assess the risk of Down syndrome include the
is found to have specific physical findings that occur frequently in following:
Down syndrome infants but can also occur in normal individuals.
These include a simian crease in the fetal hand, a short femur or 1. An increased nuchal fold (>6 mm) in the second trimester is the
humerus, clinodactyly, and excessive nuchal skin. Similarly, the in utero most distinctive marker. The fetal head is imaged in a transverse
diagnosis of Down syndrome can be suspected when anomalies or plane similar to that for measuring the biparietal diameter. The
physical features that occur more frequently in Down syndrome than thalami and the upper portion of the cerebellum should be in the
in the general population are noted on an ultrasound examination. plane of the image. The distance between the external surface of
Certain of these congenital anomalies, such as atrioventricular canal the occipital bone and the external surface of the skin is then mea-
or duodenal atresia, strongly suggest the possibility of Down syndrome sured. About 35% of Down syndrome fetuses but only 0.7% of
and are independent indications to offer invasive testing. Although normal fetuses have a nuchal skin fold measurement greater than
when these anomalies are present there is a high risk of trisomy 21, 5 mm. This ratio yields a likelihood ratio of 50 but includes fetuses
these anomalies have low sensitivity and thus are not useful in screen- with more than one marker. When an increased nuchal fold is an
ing. For example, when duodenal atresia is identified, there is an isolated finding, the likelihood ratio is still strong at 20-fold. This
approximate 40% risk of Down syndrome, yet it is seen in only 8% of high likelihood ratio is obtained because of the rarity of an increased
affected fetuses. Physical characteristics that are not themselves anom- nuchal fold in an unaffected population (i.e., high specificity). For
alies but that occur more commonly in fetuses with Down syndrome women with an a priori risk of less than 1 : 1600 (age-related risk
are called markers. By comparing the prevalence of markers in Down for a 20-year-old), a 20-fold increase results in a risk estimate of at
syndrome fetuses to their prevalence in the normal population, a likeli- least 1 : 270. Thus, the presence of an increased nuchal fold alone is
hood ratio can be calculated that can be used to modify the a priori an indication to offer invasive testing.42-47
age or serum screening risk. This is the basis for ultrasound screening 2. The fetal nasal bone has been demonstrated to be hypoplastic or
for Down syndrome. absent in up to 60% of Down syndrome pregnancies imaged in the
For a marker to be useful for Down syndrome screening, it should second trimester and only about 1% to 2% of unaffected pregnan-
be sensitive (i.e., present in a high proportion of Down syndrome cies. Complete absence will occur in about 37% of affected cases
pregnancies), specific (i.e., rarely seen in normal fetuses), easily imaged with hypoplasia occuring in about half. In normal pregnancies,
in standard sonographic examination, and present early enough in the absence is seen in 0.9% of cases and hypoplasia in 2.4%. Nasal bone
second trimester that subsequent diagnostic testing by amniocentesis length can be converted to a likelihood ratio and used for Down
can be performed so that results are available when pregnancy termi- syndrome risk assessment. When performed by experienced opera-
nation remains an option. A list of available markers and their likeli- tors, nasal bone evaluation may be the best single ultrasound marker
hood ratios are seen in Tables 17-5 and 17-6, respectively. for second trimester risk assessment.48
Before considering each marker individually, it is important to 3. Down syndrome fetuses in the second trimester may have short
remember that the predictive value of any test (e.g., a marker) depends proximal extremities (humerus and femur) relative to the expected
on the prevalence in the population of the condition being tested for. length for their biparietal diameter. This can be used to identify
In the case of sonographic markers for trisomy 21, the clinical impor- at-risk pregnancies by calculating a ratio of observed to expected
tance of a marker, therefore, varies according to the a priori risk as femur length based on the fetus’s biparietal diameter. An observed-
determined by maternal age, the results of multiple serum markers, to-expected ratio of less than 0.91 or a biparietal diameter-to-femur
and the presence of any other sonographic markers detected at the ratio of more than 1.5 has a reported likelihood ratio of 1.5 to 2.7
same examination. It is wise, therefore, to defer discussion of the when present as an isolated finding. A short humerus is more
impact of markers until the ultrasound examination has been com- strongly related to Down syndrome, with reported likelihood ratios
6. 226 CHAPTER 17 Prenatal Diagnosis of Congenital Disorders
TABLE 17-6 LIKELIHOOD RATIOS (LR) FOR ISOLATED MARKERS
IN THREE STUDIES
AAURA Nyberg et al. Smith-Bindman et al.
LR* LR (95% CI)† LR (95% CI)‡
Sonographic Marker (N = 1042) (N = 8830) (N = meta-analysis of >131,000)
Nuchal thickening 18.6 11.0 (5.2-22) 17.0 (8.0-38)
Hyperechoic bowel 5.5 6.7 (2.7-16.8) 6.1 (3.0-12.6)
Short humerus 2.5 5.1 (1.6-16.5) 7.5 (4.7-12)
Short femur 2.2 1.5 (0.8-2.8) 2.7 (1.2-6)
Echogenic intracardiac focus 2.0 1.8 (1.0-3) 2.8 (1.5-5.5)
Pyelectasis 1.5 1.5 (0.6-3.6) 1.9 (0.7-5.1)
*LR assumed by the original age-adjusted ultrasound risk adjustment (AAURA) model by Nyberg
DA, Luthy DA, Resta RG, et al: Age-adjusted ultrasound risk assessment for fetal Down’s syndrome
during the second trimester: Description of the method and analysis of 142 cases. Ultrasound
Obstet Gynecol 12:8, 1998.
†Nyberg DA, Souter VL, El-Bastawissi A, et al: Isolated sonographic markers for detection of fetal
Down syndrome in the second trimester of pregnancy. J Ultrasound Med 20:1053, 2001.
‡LR of meta-analysis by Smith-Bindman R, Hosmer W, Feldstein VA, et al: Second-trimester
ultrasound to detect fetuses with Down syndrome: A meta-analysis. JAMA 285:1044, 2001.
CI, confidence interval.
ranging from 2.5 to 7.5. Bahado-Singh and coworkers49 combined calculate an age-adjusted ultrasound risk assessment for Down
humerus length with nuchal skin fold to estimate Down syndrome syndrome in 8914 pregnancies (186 fetuses with Down syndrome,
risk and calculated the likelihood ratios for various measurements 8728 control subjects). Some type of sonographic finding (major
to adjust estimated Down syndrome risk for each patient. abnormality, minor marker, or both) was observed in 68.8% of fetuses
4. Echogenic intracardiac foci occur in up to 5% of normal pregnan- with trisomy 21 compared with 13.6% of control fetuses (P < .001).
cies and in approximately 13% to 18% of Down syndrome gesta- The observation that about one third of fetuses with Down syndrome
tions.50 The likelihood ratio for Down syndrome when an echogenic have neither a marker nor an anomaly has been used to adjust
focus is present as an isolated marker has ranged from 1.8 to 2.8. the estimated risk of Down syndrome downward by approximately
The risk does not seem to vary if the focus is in the right or left 60% to 65% (likelihood ratio, 0.4) when the “genetic ultrasound”
ventricle or if it is unilateral or bilateral. is normal. This sensitivity was observed in a single experienced center.
5. Increased echogenicity of the fetal bowel, when brighter than the It is doubtful that the same sensitivity can be achieved in every
surrounding bone, has a Down syndrome likelihood ratio of 5.5 to center.61
6.7.51-53 This finding can also be seen with fetal cystic fibrosis (CF), A positive likelihood ratio can be used to estimate an increase in
congenital cytomegalovirus infection, swallowed bloody amniotic risk. The magnitude of the increase depends on the marker(s) or
fluid, and severe intrauterine growth restriction. Therefore, if anomalies seen. Nyberg and colleagues reviewed their own data60,62 and
amniocentesis is performed for this finding, testing for the other the data of others63 to estimate a likelihood ratio for each marker as an
potential etiologies should be considered. isolated finding (see Table 17-6). An isolated minor or “soft” marker
6. Mild fetal pyelectasis (a renal pelvis anterior-posterior diameter was the only sonographic finding in 42 (22.6%) of 186 fetuses with
greater than 4 mm) has been suggested as a potential marker for trisomy 21, compared with 987 (11.3%) of 8728 control fetuses (P <
Down syndrome. As an isolated marker, the likelihood ratio ranges .001). Nuchal thickening, nasal bone hypoplasia, and hyperechoic
from 1.5 to 1.9 (see Table 17-6). This has been found by Snijders bowel showed the strongest association with trisomy 21 as isolated
and coworkers54 not to be significantly more frequent in Down markers, followed by shortened humerus, echogenic intracardiac focus,
syndrome pregnancies than in normal pregnancies (i.e., low shortened femur, and pyelectasis. Echogenic intracardiac focus was the
specificity). single most common isolated marker in both affected fetuses (7.1%)
7. Other markers described include a hypoplastic fifth middle phalanx and control fetuses (3.9%) but carried a low risk.
of the hand,55 short ears, a sandal gap between the first and second
toes,56,57 an abnormal iliac wing angle,58 and an altered foot-to- Combined Ultrasound and Second-
femur ratio.59 These markers are inconsistently used because of the
time and expertise required to obtain them.
Trimester Maternal Serum Marker
Risk Assessment
Ultrasound markers can also be combined with serum markers if they
Use of Second-Trimester Ultrasound to are independent. Souter and coworkers64 demonstrated a relatively
Estimate the Risk of Down Syndrome small correlation that needs to be taken into consideration if a quan-
As with other screening modalities, second-trimester ultrasound can titative approach is used. Bahado-Singh and colleagues65 combined
be used to alter the a priori risk in either direction. A benign second- ultrasound markers with maternal analytes, including urinary hyper-
trimester scan having none of the known markers and no anomalies glycosylated hCG and urinary α-core fragment of hCG. In a sample of
has been suggested to have a likelihood ratio of 0.4, assuming the image 585 pregnancies, the sensitivity was 93.7%, with a false-positive rate of
quality is satisfactory. Nyberg and coworkers60 used this approach to 5%.
7. CHAPTER 17 Prenatal Diagnosis of Congenital Disorders 227
TABLE 17-7 ASSOCIATION OF ULTRASOUND MARKERS WITH ANEUPLOIDY
Isolated Multiple
Ultrasound Finding (%) (%) Trisomy 13 Trisomy 18 Trisomy 21 Other 45X
Holoprosencephaly 4 39 30 7 — 7 —
n = 132
Choroid plexus cysts 1 46 11 121 18 11 —
n = 1806
Facial cleft 0 51 25 16 — 6 —
n = 118
Cystic hygroma 52 71 — 13 26 11 163
n = 276
Nuchal skin fold 19 45 — 9 85 19 10
Diaphragmatic hernia 2 34 — 18 — 14 —
n = 173
Ventriculomegaly 2 17 10 23 13 14 —
n = 690
Posterior fossa cyst 0 52 10 22 — 8 —
n = 101
Major heart defects 16 66 30 82 68 31 30
n = 829
Duodenal atresia 38 64 — — 21 2 —
n = 44
Hyperechoic bowel 7 42 — — 22 17 —
n = 196
Omphalocele 13 46 28 108 — 31 —
n = 475
Renal anomalies 3 24 40 52 48 62 —
n = 1825
Mild hydronephrosis 2 33 8 6 27 9 —
n = 631
Intrauterine growth restriction (early) 4 38 11 47 — 18 36 (triploidy)
n = 621
Talipes 0 33 — — — — —
n = 127
Isolated, isolated finding; multiple, multiple findings on ultrasound.
Adapted from Snijders RJM, Nicolaides KH: Ultrasound Markers for Fetal Chromosomal Defects. New York, Parthenon, 1996.
Second-Trimester Ultrasound First-Trimester Ultrasound Screening
Screening for Other for Aneuploidy
Chromosomal Abnormalities In his initial description of the syndrome that bears his name, Langdon
Fetal aneuploidy other than Down syndrome can be suspected based Down described skin so deficient in elasticity that it appeared to be too
on ultrasound findings (Table 17-7). Choroid plexus cysts occur in 1% large for the body. This was particularly noticeable in the neck area.
of fetuses between 16 and 24 weeks’ gestation and have been associated The skin in the fetal neck can now be seen with ultrasound at as early
with trisomy 18. Thirty percent to 35% of fetuses with trisomy 18 have as 10 to 12 weeks of gestation and is known as a nuchal translucency
choroid plexus cysts. Among fetuses with a choroid plexus cyst, about (NT). The quantification of this additional “skin behind the neck” can
3% have trisomy 18, most (65% to 90%) of whom have other ultra- be used for first-trimester Down syndrome screening.72
sound findings (Table 17-8). Although an isolated choroid plexus cyst The NT is a fluid-filled space in the posterior fetal nuchal area. NT
was estimated to yield a probability of trisomy 18 of 1 of 150 in one is defined as a collection of fluid under the skin behind the neck in
review, many of the series reviewed contained a high proportion of fetuses between 11 and 14 weeks’ gestation. This can be successfully
older women, which would overstate the risk. Snijders and coworkers66 measured by transabdominal ultrasound examination in approxi-
calculated that an isolated choroid plexus cyst has a likelihood ratio mately 95% of cases.
for trisomy 18 of 1.5 and can be used to calculate an individual’s risk Studies conducted in women with increased risk of aneuploidy
for trisomy 18. The size, location, or persistence of the cyst does not demonstrated an association between increased NT and chromosomal
alter this risk.67-71 defects.73-90 Subsequent studies demonstrated that an NT thickness
Table 17-7 displays the magnitude of the associations between above the 95th percentile was present in approximately 80% of trisomy
various ultrasound findings and aneuploid conditions as estimated 21 fetuses.89 As with other serum and ultrasound markers, the signifi-
from a referral population. The rates noted may overestimate the cance of the NT thickness depends on the a priori risk for a chromo-
strength of the association when such findings are noted on a screening somal abnormality. NT thickness increases with gestational age or
examination. crown-rump length. Figure 17-2 illustrates the NT between 11 and 14
8. 228 CHAPTER 17 Prenatal Diagnosis of Congenital Disorders
TABLE 17-8 ULTRASOUND FINDINGS weeks’ gestation. These observations suggested that NT could be used
ASSOCIATED WITH TRISOMY 18 as a screening test for Down syndrome by converting the deviation
from the expected mean to a likelihood ratio.
Frequency NT combined with the maternal and gestational age to assess the
Finding (%) risk for Down syndrome was studied in more than 100,000 pregnan-
cies.91 NT was greater than the 95th percentile in more than 70% of
Growth restriction 46
Hand or foot abnormalities* 39 fetuses with trisomy 21. The risk of Down syndrome was calculated
Cardiac abnormality 31 by the maternal age and gestational age prevalence multiplied by the
CNS abnormality 29 likelihood ratio. A cutoff of 1 : 300 was used. The studied sample
Diaphragmatic hernia 13 included 326 fetuses with trisomy 21. Eighty-two percent of trisomy
Ventral wall defect 10 21 fetuses were identified, with a false-positive rate of 8.3%.91 When a
Facial abnormality 7 screen-positive rate of 5% was selected, the sensitivity was 77% (95%
At least one abnormality 90 confidence interval [CI], 72% to 82%). Subsequent studies have dem-
onstrated similar Down syndrome detection rates, between 70% and
*Including rocker bottom feet, overlapping fingers.
CNS, central nervous system. 75% (Table 17-9).
From Gupta JK, Cave M, Lilford RJ, et al: Clinical significance of fetal The screening paradigm using an ultrasound measurement to
choroid plexus cysts. Lancet 346:724, 1995. determine a likelihood ratio is reliable only if NT is measured in a
standard fashion. Standards for NT measurements include the
following:
1. The minimal crown length should be 45 mm and the maximal,
3.5 84 mm. The success rate for accomplishing a measurement for these
gestational ages is between 98% and 100%. The success rate falls to
3.0 90% at 14 weeks and onward.92
95th 2. Either transabdominal or transvaginal scanning can be used, with
Nuchal translucency (mm)
2.5 about 95% of cases able to be imaged by the transabdominal
75th route.93
2.0 50th 3. A true sagittal section of the fetus as for measuring the fetal crown-
rump length must be obtained.
25th 4. The magnification must be such that the fetus occupies at least three
1.5
fourths of the image. The magnification should be increased so that
5th each increment in the distance between calipers should only be
1.0
0.1 mm. Studies have demonstrated that ultrasound measurements
0.5 can be accurate to the nearest 0.1 to 0.2 mm.94
5. Care must be taken to clearly distinguish between the fetal skin and
0 the amnion. At this gestational age, both structures appear as thin
45 50 55 60 65 70 75 80 85 membranes. This can be accomplished by either waiting for spon-
Crown-rump length (mm) taneous fetal movement away from the amniotic membrane or by
bouncing the fetus off the amnion by asking the mother to cough
FIGURE 17-2 Normative curves for nuchal translucency or tap on her abdomen (Fig. 17-3).
measurement between 11 and 14 weeks’ gestation. (From 6. The maximal thickness of this subcutaneous translucency between
Nicolaides KH, Sebire NJ, Snijders RJM: The 11-14 Week Scan. New the skin and the soft tissue overlying the cervical spine should be
York, Parthenon, 1999.) measured by placing the calipers on the lines as illustrated in Figure
17-4.
TABLE 17-9 STUDIES OF IMPLEMENTATION OF FETAL NUCHAL TRANSLUCENCY (NT) SCREENING
Gestation Successful NT Cutoff False-Positive Rate Detection Rate
Source (ref) (wk) N Measurement (mm) (%) of Trisomy 21
Pandya (89), 1995 10-14 1,763 100% >2.5 3.6 3 of 4 (75%)
Szabo (90), 1995 9-12 3,380 100% >3.0 1.6 28 of 31 (90%)
Bewley (97), 1995 8-13 1,704 66% >3.0 6.0 1 of 3 (33%)
Bower et al (526), 1995 8-14 1,481 97% >3.0 6.3 4 of 8 (50%)
Kornman et al (527), 1996 8-13 923 58% >3.0 6.3 2 of 4 (50%)
Zimmerman et al (528), 1996 10-13 1,131 100% >3.0 1.9 2 of 3 (67%)
Taipale et al (529), 1997 10-16 10,010 99% >3.0 0.8 7 of 13 (54%)
Hafner (179), 1998 10-14 4,371 100% >2.5 1.7 4 of 7 (57%)
Pajkrt (181), 1998 10-14 1,547 96% >3.0 2.2 6 of 9 (67%)
Adapted from Nicolaides KH, Sebire NJ, Snijders RJM: The 11-14 Week Scan. New York, Parthenon, 1999.
9. CHAPTER 17 Prenatal Diagnosis of Congenital Disorders 229
+ +
+
+ +
+ + +
+
-5 +
Correct
FIGURE 17-4 Proper placement of the calipers for measuring the
0.09 cm nuchal translucency. (From Nicolaides KH, Sebire NJ, Snijders RJM:
A The 11-14 Week Scan. New York, Parthenon, 1999.)
NT
measured but were not acted on, reported that, in the interventional
groups, successful measurement was achieved in 100% of cases, whereas
the noninterventional centers were successful in only 85%.97 In a recent
prospective study,98 the NT was measured by two to four operators in
200 pregnant women, demonstrating that after an initial measurement,
a second one made by the same operator or another operator varied
from the initial measurement by less than 0.5 and 0.6 mm, respectively,
in 95% of cases. It is suggested that a large part of the variation between
operators can be accounted for by placement of the calipers rather than
generation of the appropriate image. Subsequent studies99-101 have con-
tinued to report small interoperator differences.
-5 Because NT values are incorporated into a standardized algorithm
along with biochemical analytes, it is critical that these ultrasound
0.09cm
measurements be performed and monitored appropriately. To accom-
B plish this, certification and quality review programs have been devel-
NT
oped to ensure that accurate and precise NT measurements are
FIGURE 17-3 First-trimester nuchal translucency (NT) obtained. The Fetal Medicine Foundation of London was the first to
measurement. Clear distinction of the amnion as opposed to the offer formalized NT training and quality review. In the United States,
skin edge is made by waiting for fetal movement. Measurement
the Nuchal Translucency Quality Review (NTQR) program was initi-
before the fetus moves (A) is less accurate than after fetal
movement (B).
ated in 2005. Both programs teach the mechanics of obtaining an NT
measurement, have an image review process to ensure that the stan-
dard technique is used correctly, and perform ongoing epidemiologic
monitoring of sonographer and sonologist performance. Two studies
7. During the scan, these measurements should be taken and the have evaluated the techniques used to ensure consistent NT results.
maximum one recorded and used for Down syndrome risk Both confirmed that ongoing expert review of images is an inefficient
calculation. and impractical approach. Epidemiologic monitoring in which indi-
8. The NT should be measured with the fetal head in the neutral posi- vidual operator’s performance is compared with expected standards is
tion. When the fetal neck is hyperextended, the measurement can preferable.101,102
be increased by 0.6 mm, and when the neck is flexed, the measure-
ment can be decreased by 0.4 mm.95
9. The umbilical cord may be found around the fetal neck in approxi- First-Trimester Biochemical Screening
mately 5% to 10% of cases, which may produce a falsely increased Two serum analytes are useful for first-trimester screening. Pregnancy-
NT, adding about 0.8 mm to the measurement.96 In such cases, the associated plasma protein A has been demonstrated to have a mean
measurements of NT above and below the cord differ, and the value of 0.4 MoM in trisomy 21 pregnancies. The free β subunit of
smaller measurement is the most appropriate. hCG is elevated in Down syndrome pregnancies, with a mean value of
1.8 MoM. Screening using pregnancy-associated plasma protein A
Even with these criteria, standardization of NT measurements (PAPP-A) alone identifies about 40% to 45% of trisomy 21 pregnan-
remains difficult. Certification courses are available with continuous cies, and free β-hCG identifies about 23%, both with a false-positive
quality assessment to maintain proper technique. The ability to achieve rate of 5%.103-105 Combining both free β-hCG and PAPP-A can identify
a reliable measurement has been linked to the motivation of the sonog- 60% to 65% of trisomy 21 pregnancies, for a similar 5% false-positive
rapher. A study comparing the results obtained from hospitals where rate.106 This is a serum analyte detection rate similar to that seen with
NT was clinically used compared with those where they were merely triple screening in the second trimester.
10. 230 CHAPTER 17 Prenatal Diagnosis of Congenital Disorders
The total hCG molecule can also be used for first-trimester screen-
ing but has slightly less discrimination power than does the free β Additional First-Trimester Markers of
subunit,107 especially at less than 11 weeks’ gestation. Free β-hCG Down Syndrome
begins to increase in performance as a Down syndrome marker at as
early as 9 weeks’ gestation, reaching values almost twice those in unaf- Biochemical Markers
fected pregnancies by 13 weeks. Levels of total hCG begin to increase ADAM 12 is the secreted form of a disintegrin and metalloprotease 12,
above those in unaffected gestations at 11 weeks.108,109 The impact of a glycoprotein of the Meltrin family synthesized by the placenta and
substituting total hCG for the free β subunit on overall Down syn- secreted throughout pregnancy. ADAM 12 has proteolytic function
drome screening remains uncertain. A recent meta-analysis showed against insulin-like growth factor (IGF) binding proteins IGFBP-3 and
that in younger patients (<35 years), detection of Down syndrome IGFBP-5 and regulates the bioavailability and action of IGF-1 and -2.116
increased by 4, 5, 6, and 7 percentage points at 9, 10, 11, and 12 weeks, Studies have shown that first-trimester ADAM 12 levels are reduced in
respectively, when free β was added to pregnancy-associated plasma women carrying a Down syndrome pregnancy, and that the reduction
protein A and nuchal translucency compared with 0, 0, 2, and 4 per- is more pronounced in earlier gestation.117-119 Discrimination appears
centage points when intact human chorionic gonadotropin was best at around 8 to 10 weeks, with an overall median MoM of 0.79
added.110 In patients with advanced maternal age (>35), inclusion of in Down syndrome pregnancies.119 Population modeling shows that a
free β-hCG reduced the false-positive rate by 2.5, 3.1, 3.8, and 4.4 per- combination of ADAM 12 and PAPP-A measured at 8 to 9 weeks,
centage points compared with 0.1, 0.3, 1.0, and 2.2 percentage points combined with NT and free β-hCG measured at 12 weeks, could
for intact hCG at 9, 10, 11, and 12 weeks, respectively. Other authors achieve a detection rate of 97% with a 5% false-positive rate, or 89%
have found less impact. Using samples from the FASTER study, Canick with a 1% false-positive rate.119
and coworkers111 showed that at 12 weeks’ gestation, the addition of
free β-hCG to NT and PAPP-A added only 0.9% (−3.3 to 6.3) detec- Ultrasound Markers
tion. However, at earlier gestational ages the impact of free β-hCG Nasal Bone. Similar to findings in the second trimester, investiga-
would be greater. tors have suggested that assessment of the fetal nasal bone (NB) can
be used in the first trimester to predict trisomy 21. This is based on
the flat nasal bridge area, which is a well-described component of the
Combined First-Trimester Down syndrome phenotype, as well as on several histopathologic and
radiographic studies demonstrating differences in the nasal bones of
Nuchal Translucency and Down syndrome fetuses. Stempfle and colleagues120 found that NB
Biochemistry Screening ossification was absent in one quarter of Down syndrome fetuses
Combining NT with serum analytes improves first-trimester Down investigated between 15 and 40 weeks’ gestation, compared with none
syndrome detection rates. Table 17-10 summarizes the large interna- of the controls. Similarly, Tuxen and colleagues121 evaluated Down
tional experience with first-trimester Down syndrome screening using syndrome fetuses between 14 and 25 weeks’ gestational age by radio-
free β-hCG, PAPP-A, and NT measurements. Overall, for a 5% false- graph and pathologic study and found that the NB was absent in one
positive rate, combined first-trimester risk assessment provides a third.
Down syndrome detection rate of approximately 88% (95% CI, 84.0% Sonek and colleagues48 published the first large prospective trial of
to 89.4%). In women older than 35, 90% to 92% of trisomy 21 preg- aneuploid risk evaluation using first-trimester ultrasound assessment
nancies can be identified with a 16% to 22% false-positive rate.20,112 of the fetal nasal bone. They determined that the fetal nasal bone could
First-trimester screening can also identify trisomy 18 pregnancies. routinely be imaged and that its absence was associated with trisomy
Over 90% of such pregnancies are screen positive when combined 21 (Fig. 17-5). The NB was absent in 73% of trisomy 21 fetuses com-
biochemical and NT screening is used.112 pared with only 0.5% of euploid fetuses. They estimated that if NB
When combining analytes, differences in gestational age–specific assessment were combined with maternal age and NT measurement,
performance should be considered.113-115 At all gestational ages between 93% of Down syndrome cases would be detected at a false-positive rate
9 and 12 weeks, NT and PAPP-A are the most efficient markers. In of 5%, and 85% with a false-positive rate of 1%.
combination, they are most efficient at 11 weeks, when free and total A recent review of the literature by Rosen and D’Alton122 evaluated
hCG are least efficient. In practice, screening is performed between 11 35,312 women having first-trimester ultrasound assessment for NB. In
and 13 weeks of gestation. 33,314 cases (94.3%), the NB was successfully imaged. The sensitivity
TABLE 17-10 STUDIES OF DOWN SYNDROME DETECTION RATES
IN FIRST-TRIMESTER SCREENING
Pregnancies Down Syndrome Cases
Study (ref) Screened (Screen-Positive/Total) Detection Rate
BUN (Wapner [112], 2003) 8,216 48/61 79%
FASTER (Malone [20], 2005) 38,033 100/117 86%
SURUSS (Wald [138], 2003) 47,053 84/101 83%
Nicolaides ([143], 2005) 75,821 321/325 93%
TOTAL 167,210 533/604 88.2%
Screening tests were for free b-subunit of human chorionic gonadotropin, pregnancy-associated
plasma protein A, and nuchal translucency (with a 5% false-positive rate).
11. CHAPTER 17 Prenatal Diagnosis of Congenital Disorders 231
FIGURE 17-5 Ultrasound images of the fetal nasal bone (NB) in the first trimester. First-trimester ultrasound images of euploid (left) and
trisomy 21 (right) fetuses demonstrate the presence of the nasal bone in the normal gestation and its absence in trisomy 21. Scanning
techniques are those suggested by the Fetal-Medicine Foundation for assessing NB and include the following: (1) The image is magnified so
that each movement of the calipers causes a 0.1-mm incremental change. (2) A midsagittal view of the fetal profile is obtained. (3) The angle
between the ultrasound transducer and a line passing from the fetal forehead to the chin is 45 degrees. (4) When the NB is present, three
echogenic lines should be visible. The NB and overlying skin look like an equal sign. In the same view, the skin over the nasal tip should be
visible. If both the nasal tip and skin are present, and the NB echo cannot be visualized or is less echogenic than the skin, the NB is considered
absent. (Fetal-Medicine Foundation, available at http://www.fetalmedicinefoundation.com/nasal.htm.)
of NB alone for detecting trisomy 21 was 65% with a false-positive rate would be detected at a false-positive rate of 5%.127 For a false-positive
of 0.8%. The positive predictive value of the screen was 54%, meaning rate of 0.5%, the detection rate would be 90.5%. Although these data
that approximately 1 in 2 fetuses with an absent NB had trisomy 21. are promising, detection rates using this combined screen would be
If the NB was absent, the likelihood that a fetus had trisomy 21 was expected to be significantly lower in an unselected population using a
increased 87-fold. The negative likelihood ratio with a normal NB was similar 5% false-positive rate. In addition, appropriate imaging of
0.35 (95% CI, 0.32 to 0.39). the NB appears to be technologically more difficult than measurement
As experience with NB has increased, relationships between absent of the NT, making its use in a primary screening program less
NB, fetal crown-rump length (i.e., gestational age), NT, and ethnicity attractive.128
have been established. The current data demonstrate that in euploid Tricuspid Regurgitation. Another potential ultrasound marker
pregnancies, NB absence occurs more frequently with increasing NT. is tricuspid regurgitation determined by pulsed wave Doppler ultraso-
In a series of 5851 high-risk patients containing 333 trisomy 21 fetuses, nography.129,130 This finding is present in around 8% of normal fetuses
absence of the NB had a likelihood ratio of 37.1 when the NT was less and 65% of those with trisomy 21. Combining tricuspid regurgitation
than the 95th percentile, and this was reduced to 13.4 when the NT with NT and PAPP-A would be expected to achieve a detection rate of
was 4 or greater.123 The same study showed that the NB was more likely 95% with a 5% false-positive rate, or 90% with a 2% false-positive
to be absent at earlier gestational ages. For example, in euploid fetuses rate.131
with a crown-rump length between 45 and 54 mm, the NB was absent Ductus Venosus Wave Form. A third potential marker is abnor-
in 4.7% of cases. At a crown-rump length between 75 and 84 mm, the mal blood flow through the ductus venosus. Studies have shown that
NB was absent in only 1.0% of cases. Prefumo and colleagues124 found pulsation of the ductus venosus gives detection rates of 65% to 75%
that NB hypoplasia was more common in the euploid fetuses of women with a 4% to 5% false-positive rate,132 and the rate increased to 75%
of African descent when compared with either Asian or white popula- to 80% when NT was added. When serum biochemical markers mea-
tions (odds ratio, 2.3). Cicero and colleagues125 also found an increased sured at 10 weeks were also added, the modeled detection rate increased
incidence of absent fetal NB in the first trimester in women of Afro- to 92% at a 5% false-positive rate, or 84% at a 1% false-positive
Caribbean and southern Asian descent. The NB was absent in 2.5%, rate.133
9.0%, and 5.0% of white, Afro-Caribbean, and southern Asian popula-
tions, respectively. Likelihood ratios for trisomy 21 with absent NB
were 31.3, 8.8, and 14.2, respectively, in these three populations.
Impact of Spontaneous Miscarriages
NB status is independent of serum biochemistry, allowing NB on First-Trimester Screening
assessment to be combined with measurements of NT and maternal A potential disadvantage of earlier screening is that chromosomally
serum markers to increase first-trimester screening performance.126 In abnormal pregnancies that are destined to miscarry will be identified.
a retrospective case-control study of a high-risk population with a The impact of this can be evaluated because 69% of trisomy 21 fetuses
median maternal age of more than 38 years assessed by NT, NB, and living in the first trimester and 76% of those alive in the second tri-
biochemistry, it was estimated that 97% of Down syndrome cases mester will be born alive.4 Using this information, Dunstan and Nix134
12. 232 CHAPTER 17 Prenatal Diagnosis of Congenital Disorders
calculated that a detection rate of 80% in the first trimester is approxi- a 1% false-positive rate. If all screen-negative patients proceed to
mately equivalent to a second-trimester sensitivity of 75%, suggesting second-trimester screening, an overall detection rate of 95% can be
that when early spontaneous losses of trisomy 21 pregnancies are obtained with a 5% false-positive rate. Although this approach has
considered, first-trimester screening is superior to that presently avail- excellent performance, with a high proportion of affected pregnancies
able in the second trimester. identified in the first trimester, it is logistically demanding.
First-trimester screening would be less desirable if screen-positive Contingent sequential screening is similar to stepwise sequential
pregnancies or those with enlarged NTs were preferentially lost. In a screening, but patients with a very low first-trimester combined risk
study of 108 fetuses with trisomy 21 diagnosed in the first trimester do not have second-trimester analysis performed. Using an approach
because of increased NT, Hyett and colleagues found that six patients in which patients with a first-trimester risk of 1 : 1300 or less complete
elected to continue the pregnancy.135 In five of the six fetuses the trans- screening in the first trimester, only 15% to 20% of patients have to
lucency resolved, and at the second-trimester scan the nuchal fold return for second-trimester analysis.141,142 Contingent sequential
thickness was normal. All six of these trisomy 21 fetuses were born screening has a detection rate of 92% to 94% for a 5% screen positive
alive. Wapner and colleagues112 calculated that greater than 80% of rate.140
screen-positive trisomy 21 pregnancies would be born alive. Nasal Bone Contingency Screening. Nasal bone assessment
is technically more difficult to perform than NT, which may limit avail-
Other Approaches to Down Syndrome ability. To address this Nicolaides and colleagues143 proposed a two-
stage screen, reserving NB assessment for patients at intermediate risk
Screening: Combining First- and after the combined first-trimester screen is complete. In this model,
Second-Trimester Screening Tests patients evaluated by NT and serum markers with a risk of 1 in 100 or
Screening performance may be improved by combining analytes per- greater would be offered CVS, and those with a risk of less than 1 : 1000
formed at different gestational ages.136,137 These approaches include the would be deemed to have such a low risk that no further testing is
following. offered. Those with a risk between 1 : 101 and 1 : 1000 would have NB
Integrated Aneuploidy Screening (Noninformative Sequen- evaluation. In initial studies, performance of this two-stage approach
tial). Wald and colleagues137 described a protocol for screening based was similar to using NB assessment as part of the initial screen. The
on tests performed during both the first (NT and PAPP-A) and second two-stage approach would have a significant advantage because only
trimesters (quad screen). A single risk estimate is calculated in the about 15% of pregnancies would require NB evaluation, which could
second trimester using all six of the measured analytes. Integrated be performed in centers that have developed special expertise in this
screening has a detection rate of approximately 95% with a 5% false- technique.
positive rate.20,137 Approximately 85% of affected pregnancies would be
detected with a false-positive rate of only 0.9%.137,138 Although this Can Maternal Age Be Eliminated
screening approach is quite sensitive and specific, withholding the risk
estimate until the second trimester precludes earlier prenatal diagnosis
as an Indication for Invasive
by chorionic villus sampling (CVS) and is not an acceptable approach Prenatal Diagnosis?
for many women.139 Maternal age of 35 or older has been a standard indication for invasive
If NT scanning is not available, an integrated serum screen may be testing for more than 35 years. When it was initially suggested, approxi-
performed (PAPP-A in the first trimester and a quad screen in the mately 5% of births were to women older than 35 years, as were 30%
second trimester). This approach has a detection rate of 86% to 90% of trisomy 21 gestations. Presently, almost three times as many women
at a 5% false-positive rate.20,137 giving birth are older than 35, and this group contains about 50% of
Sequential Testing. In an attempt to maximize screening perfor- trisomy 21 conceptions. For every invasive procedure done with mater-
mance by combining first- and second-trimester analytes yet retain the nal age as the only indication, the odds of being affected are approxi-
benefit of first-trimester diagnosis, various methods of sequential mately 1 : 100.20 As screening has improved, the importance of maternal
screening have been proposed. In these approaches, first-trimester risk age as a single indication for testing has been reevaluated.
results are calculated and used for clinical management, with second- In women aged 35 years and older, 87% of Down syndrome
trimester testing performed in selected cases. pregnancies and 25% of unaffected pregnancies will be triple-screen
Three approaches to sequential risk assessment are presently avail- positive at a cutoff of 1 : 250.18 The incidence of Down syndrome in
able. In independent sequential testing, a first-trimester combined risk this age group is approximately 1 : 100. Table 17-11 demonstrates
is calculated with a 1 : 270 screen-positive cutoff. Decisions on invasive that performing an amniocentesis on screen-negative women (risk
testing are made on the basis of these results. In the second trimester, <1 : 270) aged 35 years or older would lead to the loss of three normal
a quad screen is performed and calculated independent of the first- pregnancies from procedure-induced complications for every Down
trimester results. This approach provides detection rates greater than syndrome pregnancy identified. First-trimester screening has greater
95%,20,136 but it has an unacceptably high false-positive rate of greater than a 90% sensitivity with a 15% false-positive rate in women aged
than 10% because independent calculation of the quad screen risk 35 years or older.112 Using the approach illustrated in Table 17-1, it can
does not take into consideration the reduced second-trimester preva- be calculated that almost four normal pregnancies will be lost for each
lence of Down syndrome pregnancies after first-trimester prenatal Down syndrome pregnancy identified.
diagnosis. Screening the entire population of pregnant women regardless of
Stepwise sequential testing reduces the high false-positive rate of age provides the most effective use of resources. Presently, 14.2% of
independent sequential testing and offers the highest risk patients the women older than 35 are offered invasive testing, as are about 5%
option of first trimester invasive testing by using a high first-trimester of women under age 35 who are screen positive, making greater than
risk cutoff and calculating the second-trimester risk by integrating 18% of pregnant women eligible for testing. If second-trimester screen-
information from both trimesters.140 For example, using a 1 : 65 cutoff ing were used for all patients regardless of age and only screen-positive
in the first trimester identifies 70% of affected pregnancies with only patients were offered invasive testing, the number of procedures would
13. CHAPTER 17 Prenatal Diagnosis of Congenital Disorders 233
TABLE 17-11 COMPARISON OF SCREENING APPROACHES FOR WOMEN AGED 35 YEARS AND OLDER*
Invasive Procedures for First-Trimester Screening Second-Trimester Screening
All Women ≥35 Years for All Women ≥35 Years for All Women ≥35 Years
(N = 10,000) (N = 10,000) (N = 10,000)
Down syndrome pregnancies 100 100.0 100
Down syndrome detected 100 90.0 87
Down syndrome missed 0 10.0 13
Invasive procedures performed 10,000 1500.0 2500
Pregnancies lost due to procedure 50 7.5 13
Pregnancies lost to diagnose N/A 4.3 3
one trisomy 21 pregnancy in
screen-negative women
Based on population of 10,000 pregnant women ≥35 years old
*Assumes one procedure-related loss for every 200 invasive procedures performed. First-trimester screening: sensitivity, 90%; false-positive rate, 16%.
Second-trimester screening: sensitivity, 87%; false-positive rate, 25%.
be reduced to only 6.4% of the pregnant population. If first-trimester AFP enters the fetal urine and is excreted into the amniotic fluid.
screening is used, the number of eligible patients is only 3.8%. Peak levels of amniotic fluid AFP are reached between 12 and 14 weeks’
Age-related autosomal and sex chromosome trisomies other than gestation, declining between 10% and 15% per week during the second
trisomy 21 would potentially be missed if invasive testing for age were trimester, and levels are almost undetectable at term.
abandoned. Presently, both second- and first-trimester screening for Maternal serum AFP levels rise above nonpregnant levels as early
trisomy 18 are available and efficient. Wapner112 showed a 100% detec- as the 7th week of gestation. MSAFP levels are significantly lower than
tion rate using first-trimester combined screening in women aged 35 AFAFP levels but progressively increase during gestation until 28 and
years and older. About 50% of the sex chromosome abnormalities will 32 weeks, when they peak. This paradoxical rise in MSAFP when
be screen positive in the second trimester in women aged 35 years and amniotic fluid and serum levels are decreasing is believed to be
older.144 accounted for by increasing placental mass and progressive permeabil-
The American College of Obstetricians and Gynecologists has rec- ity to fetal plasma proteins. Thus the amount of AFP detected in
ommended that maternal age of 35 years should no longer be used as maternal serum is increased in the presence of multiple placentas (i.e.,
a cutoff to determine who is offered screening and who is offered in multifetal gestation).
invasive testing.145 This approach has to be preceded by explicit patient In normal pregnancies, transport of AFAFP into maternal serum
counseling to explain the risks and advantages of both options. contributes little to the MSAFP compartment. The significant differ-
ence in fetal serum AFP compared with that in the amniotic fluid and
maternal serum serves as the basis for using this fetal protein to screen
for fetal lesions such as neural tube defects, which potentially leak high
Maternal Serum levels of AFP into the amniotic fluid and, hence, the maternal serum.
a-Fetoprotein Screening The concentration gradient between fetal plasma and AFAFP is about
150 to 200 : 1. The concentration differential between fetal and mater-
for Neural Tube and Other nal serum is about 50,000 : 1. Thus, the presence of a small volume of
fetal blood or serum in the amniotic fluid can raise the AFP level
Structural Defects significantly.
Physiology Screening
Maternal serum screening for neural tube defects was the initial foray MSAFP screening for neural tube defects is ideally performed between
into pregnancy screening for congenital anomalies. Because 95% of 16 and 18 weeks of pregnancy. Cutoffs between 2.0 and 2.5 MoM yield
neural tube defects occurred in families without a history of a previ- detection rates of almost 100% for anencephaly and 85% to 92% for
ously affected offspring, prenatal detection of these defects was largely open spina bifida, with a false-positive rate between 2% and 5%. As
fortuitous before 1980. Screening is based on elevated levels of MSAFP, with all screening modalities, the positive predictive value for an indi-
which occurs in anencephaly and spina bifida. vidual patient depends on the population risk. Table 17-12 demon-
AFP is a fetal-specific globin similar to albumin in molecular weight strates the odds of an individual woman having a child with a neural
and charge but with a different primary structure and distinct anti- tube defect, based on the degree of elevation of her serum AFP and on
genic properties. The gene for AFP is located on chromosome 4q. AFP her a priori risk of having a child with a neural tube defect. Because
is synthesized early in gestation by the yolk sac and subsequently by MSAFP values rise between 16% and 18% per week during the second
the fetal gastrointestinal tract and liver. The level of fetal plasma AFP trimester, use of gestational age-corrected MSAFP MoM for compari-
peaks between 10 and 13 weeks of gestation and declines exponentially son between laboratories is recommended. The median is preferred to
from 14 to 32 weeks and then more sharply until term. The exponential the mean because it is less influenced by occasional outliers.
fall in fetal plasma AFP is most likely the result of the dilution effect MSAFP is performed using an enzyme immunoassay. All laborato-
of increasing fetal blood volume, as well as of a decline in the amounts ries performing this test should have their own normal ranges and a
synthesized by the fetus, as fetal albumin is increasingly produced as mechanism for continuous quality control assessment. The College of
the primary oncotic protein in fetal blood. American Pathologists operates a nationwide external proficiency test