Lean 6sigma and DMAIC
•
32 j'aime•3,540 vues

I've been asked to put together a basic (and therefore relatively quick) introduction to Lean Six Sigma & DMAIC. While it’s not yet finished, I thought I would put it out there for people to comment on. Since the presentation is supposed to be training material there’s more text on the slides than I would prefer, but there are a few exercises and games to get the trainees involved. I've put the PowerPoint version on my blog: http://alesandrab.wordpress.com/2013/06/07/introduction-to-lean-six-sigma-dmaic/

Recommandé
Contenu connexe
Tendances
Tendances (20)
En vedette
Similaire à Lean 6sigma and DMAIC
Similaire à Lean 6sigma and DMAIC (20)
Plus de Alesandra Blakeston
Dernier
Dernier (20)
Lean 6sigma and DMAIC
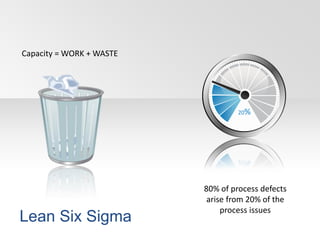
- 1. 20% 80% of process defects arise from 20% of the process issues Capacity = WORK + WASTE Lean Six Sigma
- 2. What is Lean Six Sigma… 2 successful management strategies for improving business processes combined LEAN LEAN 6σ 6σ
- 3. Plan, Do, Check, Act Plan = Define + Measure + Analyse Check + Act = Control Do = Implement Can be used alongside DMAIC methods Traditional PDCA method Lean six sigma method
- 4. Benefits of Lean Six Sigma Motorola has reported over US$17 billion in savings as of 2006. Another early adopter of Lean Six Sigma is General Electric (introduced by Jack Welch). By the late 1990s, about two-thirds of the Fortune 500 organisations had begun Lean Six Sigma initiatives with the aim of reducing costs and improving quality.
- 5. Lean 6σ Project Kaizen blitz Different approaches Fix specific problem or workflow issue within the organisation Kaizen = Continuous improvement Large scale project work to find route causes & fix hidden and obvious problems
- 6. ConsPros Happens in sporadic bursts Root causes not thoroughly analysed to optimise the results Fixes the obvious issues at the expense of learning about the latent opportunities Kaizen is seductive & efficient. Delivers large scale results quickly Utilises the entire team’s collective insight & experience Inspires curiosity about waste, defects and constraints to throughput Kaizen Lean Six Sigma, or DMAIC, fills in the gaps that Kaizen fails to address. It supplies the analytical discipline necessary to thoroughly understand the nature of processes and problems. Short, focused bursts of continuous improvement
- 7. DMAIC Kaizen Just do it Ongoing quick hits Low risk & investment Discover and deliver new value 3 – 6 months Solve problems 2 – 4 months Greater $$ and / or risk ScaleApproach Project / Risk relationship ~ 1 week Streamline Remove waste
- 8. Lean Control
- 9. What is Lean Control… Lean is a philosophy and set of management techniques focused on continuous “elimination of waste” and smoothing work flows so that every process, task or work action is made “value adding” when viewed from customer perspective How much product does the customer really need? Anything more is wasted inventory Extra stored product Needed stored product
- 10. Examples of waste (muda) 1 2 3 4 5 6 Overproduction Inventory Motion Waiting Transportation Over processing Defects7
- 11. Exercise Brainstorming & negative Brainstorming Examples of muda In pairs, use brainstorming and negative brainstorming techniques to find a solution for one example of one of the different types of muda in your workplaces One of the tools used in the DMAIC method Inventory Motion Defects Brainstorming Negative Brainstorming
- 12. Streamlining the process In addition to looking at wastes, lean also looks at streamlining the process using push / pull processes and kanban systems to ensure the product is made just in time with as little work in progress (WIP) as possible Customer Service Production Quality Control Logistics Information flow Material flow Material flow Material flow Information flow Information flow Push process
- 13. Chocolate experiment Experiment 1 Each person will be given a role / workstation. As part of the work you must pass the product on to the next person in the chain. After 2 minutes count how many products are still inside the production process (WIP) and how many have been given to the customer Supplier Production 1 Shipping Quality control Production 2 Customer Production 3 Watch dog
- 14. Chocolate experiment 1 – part 1 Production 3Supplier Supply a single chocolate & order to production 1 every second Production 1 Production 2 Count each chocolate then send a batch of 4 to production 3 Supply a batch of 3 chocolates to production 2 every 3 seconds Wrap chocolate in paper, then send a batch of 3 to Quality control Shipping Quality control Supply 1 wrapped chocolate to the customer Check each chocolate & pass 1 to shipping each second
- 15. Chocolate experiment 1 – part 2 Watch dog Customer Accept a delivery of chocolate from shipping Monitor the time taken, and the movement of the people during the exercise. Count the WIP and goods received by the customer Customer Production 2 Production 1Production 3Shipping Quality controlSupplier Watch dog Room layout
- 16. Watchdog feedback Push production What did you learn? How much work was in process (WIP)? Was creating batches efficient or did it slow the process down? Was the work station layout effective? How could we improve things?Learning about flow, push and pull production in Lean
- 17. Takt time Taktzeit = cycle time d a T T T Td Time demand (customer demand), e.g. [units required / day] Ta Net time available to work e.g. [minutes of work / day]
- 18. Example If Customer demand = 400 units/day To make product in 1 shift, takt time must = 1 part / minute Shift time = 8hrs (480mins) Break time = 30mins (2 x 15mins) Lunch break = 30mins Team brief = 10mins Maintenance checks = 30mins Net Available Time to Work 480 - 30 - 30 - 10 - 10 = 400mins If Customer demand = 600 units/day To make product in 1 shift, takt time must = 1 part / 40secs
- 19. Chocolate experiment 2 Experiment 2 Try the simulation with the layout of the room as shown… Send the chocolates through the system without batching. Note there are new tasks for some roles! What happens now? Customer Production 3 SupplierProduction 1Production 2 ShippingQuality Control Watch dog Room layout
- 20. Chocolate experiment 2 – new roles Watch dog Customer Only accept a delivery if the first one arrives in 10 seconds. 10 must arrive within 1 minute Don’t accept if they are wrapped! Monitor the time taken, and the movement of the people during the exercise. Count the WIP and goods received by the customer Quality control Due to maintenance issues you can now only check a chocolate every 8 seconds
- 21. Watchdog / customer feedback Push production What did you learn? Was there a bottleneck? Was this a push or a pull process? How could we improve the production flow? Was the customer satisfied? What about the company profits and losses? How could we find out what the customer really wants? Which processes added value and which steps had over processing wastes? Learning about inventory control, WIP, kanban Voice of the customer Value added processes
- 22. Chocolate experiment 3 Experiment 3 Use kanban stations to control the flow of goods through the process Find out what the customer really wants (VOC) and compare it to the voice of the process (VOP) See how a pull system works! Customer Production 3 SupplierProduction 1Production 2 ShippingQuality Control Watch dog Room layout K K K K K K K Only put a chocolate onto the next kanban station if the kanban station is empty!!!
- 23. Watchdog feedback Push production What did you learn? How much WIP was there in the process now? Where was the process being pulled from? Was the customer satisfied? Does VOC = VOP now? Is it necessary to keep ANY over processing steps in the production cycle? Learning about inventory control, WIP, kanban VOC / VOP Business necessary steps & value added steps
- 24. Origins - Lean Taiichi Ohno, Shigeo Shingo and Eiji Toyoda developed the TPS system between 1948 and 1975 Lean derives from Toyota Production System or Just In Time Production, Henry Ford and other predecessors Toyota, Aichi, Japan Detroit, USA
- 25. Lean timeline TAYLOR Standardised work / Time study WHITNEY Interchangeable parts GILBRETH Process charts / Motion study FORD Assembly / Low lines DEMING SPC TQM TOYODA/OHNO TPS Just in time, no stock production LEAN Lean used in manufacturing 1850 1900 1950 2000
- 26. Six Sigma
- 27. Example Pareto principle The Pareto principle is named after an Italian economist Vilfredo Pareto, who observed in 1906 that 80% of the land in Italy was owned by 20% of the population Microsoft noted that by fixing the top 20% of the most reported bugs, 80% of the errors and crashes would be eliminated University of Florence, Italy
- 28. What is 6σ… Six Sigma seeks to identify and remove these 20% of causes of defects and errors in business processes. It uses a set of management methods, including statistics and creates a dedicated infrastructure of people within the organisation who are experts in these methods. Production lines Percentageyield Lines where there is a significant defect Target By focussing resources on the areas where significant defects occur, we can stabilise and improve performance!
- 29. Exercise Normal distribution curves Normal distribution curves A normal distribution of data means that most of the examples in a set of data are close to the "average," while relatively few examples tend to one extreme or the other. Each person should take one of the targets and some silly putty. Affix the target to the wall, and throw ten pieces of putty at the target and see where they land We are then going to use this data to plot our first statistical graph! Mean and Sigma
- 30. Target Target scoring Score your results based on the diagram shown Then count up the number of times you hit each ring of the target and plot the results on the graph 5 1 2 4 3 0
- 31. Sample target results Target ring Noofhits 2 4 6 8 10 0 1 2 3 4 5 Paul Simon JackSarah What factors (inputs, Xs) affect the outcome (output, Y)? How can you calculate the mean? = 2.85
- 32. HistogramsNoofpeople Height in metres Histogram showing no of people at each height Height in metres Mean height = 1.8m Minimum = 1.6m Maximum = 2.0m Imagine performing a survey of everyone’s height in a factory. The results would be similar to the graph below
- 33. Normal distribution curve If you draw a line over the top of the histogram, you get what is known as a normal distribution curve Not all data sets will have graphs that look this perfect. Some will have flat curves, others will be steep. Sometimes the mean will lean a little bit to one side or the other. But all normally distributed data will have a similar "bell curve" shape. 1 2 Normal distributio n curve Mean
- 34. The standard deviation σ is a measure of how much variation there is in the data Standard deviation σ Statistics show that 68 percent of the data in this group falls within 1σ of the mean (either side) 3 4 When the data is tightly bunched together and the bell shaped curve is steep, the standard deviation is small. When the data is spread apart and the bell curve is relatively flat, the standard deviation is large Small standard deviation Large standard deviation σ
- 35. Sigma levels We can measure the sigma level of a process by graphing the number of defects / day The data should show normal distribution A process with a 1σ score will have 69% defects and 31% yield To have a 2σ score, there would be 31% defects and 69% yield σLevel %Defects %Yield 1 2 3 4 5 6 69 31 31 69 6.7 93.3 0.6 99.4 0.02 99.98 0.0003 99.99 5
- 36. But what is 6σ? The term "six sigma process" comes from the notion that if you can measure six standard deviations between the process mean and the nearest specification limit, practically none of the products will fail to meet the specification 6σ σ 2 3 4 5 6 σ- σ-2-3-4-5-6 σ μ Upper specification limit (USL) Lower specification limit (LSL) 68% of the data
- 37. Six sigma methodologies We use the six sigma methodologies, then, to find the causes of the defects in our processes to allow us to get a higher sigma score… Some causes of defects are obvious, others hidden… Traditional Quality costs Tangible Easy to measure Hidden Quality costs Intangible Difficult to measure Inspection Warranty Scrap Rework Rejects More setups Expediting costs Lost sales Late deliveries Lost customer loyalty Excess inventory Long cycle times Costly engineering changes
- 38. INPUTS Xs OUTPUTS Ys PROCESS I Process parameters Most of the time, we know that we have a problem, although we are not always exactly sure where. Using six sigma we can Define the problem exactly, and then Measure the inputs (X) and outputs (Y) of the process Once we can identify the anomalous data we can Improve and Control it. IF the anomalous data is affecting costs! We Analyse this data to determine if our performance is reliable and consistent, it follows a pattern, or if we have an unreliable or out of control process with significant levels of defects and / or special events
- 39. Origins – Six Sigma 6σ 6σ started in Motorola by Bill Smith 1986 Illinois, USA In 1920 Walter Shewhart showed that 3σ from the mean is the point where a process requires correction
- 41. What is the DMAIC method? Improve A structured approach to problem solving Team led project work A Japanese fad that won’t last long?
- 42. Exercise 15 word flip chart One of the tools used in the DMAIC method What is the DMAIC method? In teams, choose one of the following topics, then using post its and a flip chart, write 15 words to describe: • What you think the DMAIC method is • What are the origins of DMAIC • Why DMAIC is important to business Text Text Text
- 43. The “D” (Define) in the DMAIC process focuses on selecting high- impact projects and understanding which underlying metric(s) will reflect project success The M-A-I-C steps in DMAIC comprise a number of tools aimed at understanding and controlling root causes. Projects create additional work, and the management team must be convinced that the project is worth the additional work required to deliver breakthrough results. A good DMAIC project is focussed and team driven
- 44. Who is who in Lean Six Sigma… Champions / Sponsor Usually high up, who sponsors a Lean Six Sigma project through the business. The first few Lean Six Sigma projects may encounter some technical, political, or institutional obstacles in the business environment. It's critical that someone is there to help the project and the project members overcome any obstacles and resistance. Black Belts Does Lean Six Sigma "full time." Their entire work effort is focused on finding defects, wherever they might be, and eliminating them from the business processes. They move from department to department, heading Lean Six Sigma projects. Green Belts This is a title for someone who is involved with a Lean Six Sigma project "part-time." They have a job with normal duties, added involvement in a Lean Six Sigma project.
- 45. Brief overview Define Analyse Improve Control Measure Measure the process to determine current performance Define the project goals and customer deliverables Improve the process by eliminating defects Analyze and determine the root cause of the defects Control future process performance D M A I C
- 46. DMAIC in Everyday Life D M A I C My baseline weight is 192 pounds, and my target weight is 182 pounds. The measurement error is acceptable Pack healthy snacks so we don’t use the vending machine. Pre-plan 1 evening snack to develop a good routine Weigh-in 1/wk and track the results. If weight creeps above 185 pounds, log food intake and make adjustments Using the DMAIC, how would you tackle a problem involving trying to lose weight? I want to lose ten pounds… We take in 24% of our daily calories with evening snacks, & another 19% by hitting the vending machine at work I want to improve my health. Reaching a healthy body weight will increase my energy level and prevent a number of problems down the road. The research I have done says that I need to lose ten pounds.”
- 47. Pillars The original Toyota Production System could be described as a house with pillars. JIT (just in time) Smooth out production / resource utilisation Jidoka Quality production, defect free Lean control Respect for people HEIJUNKA (levelled production) KAIZEN STANDARD WORK Flow, pull processes, waste reduction
- 48. Paper tower exercise A4 sheet of paper Using a single sheet of A4 paper only & no other materials, construct the tallest free standing structure, in 5 minutes Creative thinking Working under pressure, planning, team working
- 49. Selecting a project team Once you have identified that you have a problem, you need a team! All teams are only as strong as their weakest member! Should all of the project team be process experts? More team members means more time! It’s difficult to engage operators Most project teams end up being the same usual suspects doing all of the work
- 50. 5-words What makes a good team player? 2 teams must battle it out to see who is the most creative, innovate and show better team skills! Choose 5 words: 1. Animal 2. Mineral 3. Famous place 4. Food 5. Clothing / Jewellery Give your words to the opposing team and then in 15 minutes write a script containing the 5 words you have been given. When the time is up, be ready to perform! During the game, think about the way you and your team members interact. What was good and what is bad? !
- 51. Storyboards Good storyboards are essential! Why use it? To track data, decisions, and actions and create a graphical or pictorial record of your DMAIC project.
- 52. Storyboards What does it do? • Facilitates decision making • Helps maintain forward momentum • Helps prevent rework • Provides a quick, visual summary of a team’s work • Can also be used as presentation materials. • Other employees can have access to the improvement team’s work.