2. creatine has improved outcomes for patients with Huntington’s
disease30
and type 2 diabetes.31
At the other end of the
spectrum, nitroarginine exhibits neuroprotective effects in
Parkinson’s disease.32
These are molecules that are inter-
mediate products in the conversion of arginine to nitric oxide
or urea. Theses diseases are related to inflammation, which
implicates macrophages in these diseases. Using arginine and its
derivatives to alter the phenotypic profile of macrophages has
not been explored, particularly in using these molecules as
surface modifiers.
In this study, we have examined the effect of arginine
derivatives as polymer modifiers in macrophage response.
Arginine is known to have a role in immune responses.22
Furthermore, several of its derivatives are known to impact
NOS production and function. Both 2-amino-3-guanidinopro-
pionic acid and nitroarginine inhibit NOS.33,34
Carnitine
suppresses the production of NO and the protein expression
of inducible nitric oxide synthase (iNOS).35
In addition to
these molecules, several products in arginine metabolism were
studied, including creatine, which is produced through
arginine/glycine amidinotransferase22,23
and citrulline. Other
arginine derivatives are thought to be pro-angiogenic, such as 3-
guanidinopropionic acid, which shifts mitochondrial metabo-
lism from a glycolytic to oxidative mechanism,36
and
acetylcarnitine, which protects against oxidative stress gen-
erated by mitochondrial metabolism.37
Acetylcarnitine has also
been used to decrease iNOS protein expression in multiple
sclerosis patients when delivered orally.38
Additional arginine
derivatives were explored to examine how these modifiers alter
macrophage responses. In addition to M(LPS) and M(IL-4)
cells, naïve macrophages were also tested. Correlations between
the molecules detected and material properties were examined
and used to determine what parameters promote different
macrophage phenotypes under different activation conditions.
2. MATERIALS AND METHODS
Fourteen chemically unique functional groups were coupled to
polymers to assess how they affect macrophage activation. All
experiments had at least four replicates, and error bars indicate the
standard deviation. All materials were purchased from Sigma (St.
Louis, MO) and used as received unless otherwise indicated. Fresh
deionized water (Milli-Q, Barnstead Nanopure, Thermo Scientific,
Waltham, MA) was used throughout this study.
Modifiers that were coupled to p(NIPAm-co-AAc) particles were 2-
amino-3-guanidinopropionic acid, 3-guanidinopropionic acid, nitro-
arginine, creatine (Fisher, Pittsburgh, PA), carnitine, citrulline, 5-
hydroxylysine, acetylglutamine, N-carbamyl-α-aminoisobutyric acid,
acetylcarnitine, 2,4-diaminobutyric acid, acetylornithine, albizziin, and
arginine (Amresco, Solon, OH).
2.1. Polymer Synthesis. 2.1.1. p(NIPAm-co-AAc) Particle Syn-
thesis. Modification of p(NIPAm-co-AAc) particles and their synthesis
have been described previously.5,8
Briefly, NIPAm (2.4 g), N,N-
methylenebis(acrylamide) (0.16 g), and 157 μL of AAc (J.T. Baker,
Center Valley, PA) were dissolved in 100 mL of H2O and stirred
under N2 in a 250 mL round-bottom flask for 30 min at 70 °C. Next,
15 mL of 13.3 mg/mL K2S2O8 was added to the flask. The reaction
was allowed to proceed for 3.5 h, after which the suspension was
slowly cooled to room temperature, filtered with P5 grade filter paper,
and dialyzed for 48 h in Milli-Q water. The particles were freeze-dried
using a lyophilizer (Labconco, Kansas City, MO, 4.5 L).
In a 15 mL tube, 7.5 mL of phosphate buffered saline (PBS, diluted
from a 10× solution, Fisher Scientific, to 0.1 M, pH 7.4), 16.7 μL of
ethylenediamine (Eda), 1.5 mL of 5% w/v p(NIPAm-co-AAc)
particles, and 75 mg of 1-ethyl-3(3-(dimethylamino)propyl)-
carbodiimide hydrochloride (EDC) were vortexed and incubated
overnight at room temperature. The particles were dialyzed against
H2O and lyophilized. The modifiers in Figure 1 were conjugated to the
Eda−p(NIPAm-co-AAc) particles through the carboxylic acid group
on the modifiers in Figure 1 by combining 10 mg of Eda−p(NIPAm-
co-AAc) particles with 2 mg of modifiers and 10 mg of EDC in 2 mL of
PBS at room temperature and stirring overnight. The particles were
dialyzed against H2O and lyophilized.
2.1.2. ζ-Potential. Milli-Q water was neutralized to pH 7 with HCl
or NaOH to ensure that the ions in water would not interfere with the
ζ-potential of particles. A low salt concentration was confirmed by
measuring conductivities at <0.2 mS/cm. A 100 μL aliquot of 1% w/v
of particles was added into 5 mL of water, and ζ-potential was
measured with a Zetasizer Nano Z (Malvern).
2.2. Cell Viability. RAW 264.7 macrophages were cultured at 37
°C with 5% CO2 in 10% fetal bovine serum, 100 U/L penicillin, and
100 μg/L streptomycin in Dulbecco’s modified Eagle’s medium
(DMEM high glucose; Thermo Scientific), to be referred to as
complete medium (CM). RAW 264.7 cells were seeded in a 24-well
plate at 1.25 × 10⁵
cell/cm2
in the presence of 5 μg/mL LPS39,40
or 25
ng/mL IL-441
(eBioscience Inc., San Diego, CA) and incubated 24 h at
37 °C in 5% CO2. A control set of experiments was not activated. After
activation, the medium was replaced with fresh CM, and particles were
added to the wells (100 particles per cell). The cells were incubated for
an additional 24 h. All particles were sterilized by washing three times
in 70% ethanol, followed by three washes in sterile H2O and
centrifugation at 10 000g for 10 min. In a control experiment, cells
were incubated without particles. A control of particle and IL-4 or LPS
in the absence of cells was also conducted. The medium in each well
was collected and stored at −20 °C.
Figure 1. Chemical structures of all molecules used for the modification of p(NIPAm-co-AAc) particles. The letters are used as labels in the following
figures for convenience.
ACS Biomaterials Science & Engineering Article
DOI: 10.1021/acsbiomaterials.6b00041
ACS Biomater. Sci. Eng. 2016, 2, 946−953
947
3. A (3-(4,5-dimethylthiazol-2-yl)-2,5-diphenyltetrazolium bromide
(MTT) assay was used to determine cell viability in the presence of
the modified particles. A total of 50 μL of MTT (5 mg/mL in DI
H2O) and 500 μL of CM was added to each well, and the plate was
incubated for 2 h at 37 °C in 5% CO2, after which time 425 μL of
media was aspirated. The resulting formazan crystals were dissolved in
500 μL of dimethylsulfoxide (DMSO, Fisher, Pittsburgh, PA). The
absorbance was measured at 540 nm with a reference at 690 nm using
a plate reader (BioTek Synergy HT Multidetection Microplate Reader,
Winooski, VT).
2.3. Measurement of Tumor Necrosis Factor-α Production.
Tumor necrosis factor-α (TNF-α) present in the LPS, IL-4, or naïve
cell supernatant was determined by commercially available immuno-
assay kits (eBioscience Inc., San Diego, CA) and performed as
described by the manufacturer.
2.4. Arginase Activity. After 24 h incubation with particles in
section 2.2, cells were washed with 500 μL of PBS. In each well, 100
μL of cell lysis buffer (150 μL protease inhibitor cocktail (Amresco,
Solon, OH) and 15 μL of Triton X-100 (Acros Organics) filled to 15
mL with DI water) was added, and the plates were incubated on ice for
10 min. Next, 25 μL of the cell lysate was transferred to a 96-well plate,
and 25 μL of 10 mM MnCl2 (Fisher) and 50 mM Tris (Fisher) was
added to each well. Incubation at 55 °C for 10 min activated the
arginase. A solution of 50 μL of 1 M arginine (pH 9.7) was added to
each well, and the plate was incubated at 37 °C for 20 h. The activity
of arginase was determined by measuring the amount of arginine
converted to urea. In 96-well plates, 5 μL of either the urea-containing
samples or standards was added to 200 μL of a 1:2 mixture of solution
1 (1.2 g of o-phthaldialdehyde (Alfa Aesar, Ward Hill, MA), 1 L of
H2O, and 500 μL of HCl (Fisher, Pittsburgh, PA)) and solution 2 (0.6
g of N-(napthyhl)ethylenediamine dihydrochloride (Acros Organics),
5 g of boric acid (Fisher, Pittsburgh, PA), 800 mL of H2O, and 111 mL
of sulfuric acid (Fisher, Pittsburgh, PA), diluted to 1 L with H2O).42
The plates were incubated for 30 min, and the absorbance in each well
was measured at 540 nm with a reference at 630 nm using a plate
reader.
2.5. Griess Reagent Assay. Nitrite concentration in the
supernatant collected in section 2.2 was quantified through a Griess
reagent assay. A standard curve was generated through serial dilutions
of 100 μM NaNO2. To each well were added 150 μL of sample or
standard, 130 μL of DI H2O, and 20 μL of Griess reagent. The plate
was incubated for 20 min, and the absorbance of each well was
measured with a plate reader at 448 nm with a reference of 690 nm.
TNF-α, arginase, and nitrite concentrations were determined at the
same time point of 24 h after introduction of the particles.
2.6. Statistics and Data Analysis. Statistical analysis was
performed using XLSTAT statistical software (New York, NY).
Statistical significance of the mean comparisons was determined by a
two-way ANOVA. Pair-wise comparisons were analyzed with Tukey’s
honest significant difference test. Differences were considered
statistically significant for p < 0.05. The macrophage responses
measured above were analyzed by performing partial least-squares
(PLS) regression on the material descriptors shown in Table 1. These
descriptors were based on descriptors defined by Bicerano.43
3. RESULTS AND DISCUSSION
3.1. Synthesis, ζ-Potential, and Cell Viability. Function-
alized p(NIPAm-co-AAc) particles were synthesized and
modified with the molecules shown in Figure 1 through the
carboxylic acid on the modifier. The ζ-potential of the modified
and unmodified p(NIPAm-co-AAc) is in Figure 2. There was a
range in ζ-potentials for the particles from −4.2 to −20.8 mV.
Cytocompatibility of these materials was tested through an
MTT viability assay. Macrophages were activated with LPS or
IL-4 to simulate M1- and M2-like cells. After being incubated
for 24 h, the medium was replaced and the functionalized
particles were added to each well. Metabolic activity of the cells
was assessed after an additional 24 h incubation period. Naïve
cells, denoted M(0), were also assessed. The results of the
viability assay are shown in Figure 3. All tested conditions were
>70% viable, with most particles and activation conditions
resulting in 90% viability of the macrophages. The largest
decrease in viability came from B, D, G, I, and J for M(LPS), H
for M(IL-4), and L for M(0).
Table 1. Thirty-Eight Molecular Descriptors for the Surface
Modifications Used in This Studya
ID
structure
descriptor
descriptions
1 R freely rotating bonds
2 HD H-bond donors
3 HA H-bond acceptors
4 Nsp
2
number of sp2
carbon atoms
5 N1°C Number of 1° carbon atoms
6 1
X connectivity index 1, calculated based on the molecular graph
of the modifier
7 1
Xv
connectivity index 2, calculated based on the electronic
configuration of the molecular graph of the modifier
8 0
X atomic index 1, calculated based on the number of non-
hydrogen atoms to which a non-hydrogen atom is bound
9 0
Xv
atomic index 2, calculated based on the electronic
configuration of each non-hydrogen atom
10 1
ξ
intensive connectivity index 1, ξ = N
1 X1
11 1
ξv
intensive connectivity index 2, ξ =
ν
ν
N
1 X1
12 0
ξ
intensive atomic index 1, ξ = N
0 X0
13 0
ξv
intensive atomic index 2, ξ =
ν
ν
N
0 X0
14 N number of non-hydrogen atoms
15 NC number of carbon atoms
16 NH number of hydrogen atoms
17 NO number of oxygen atoms
18 NN number of nitrogen atoms
19 NCH2 number of CH2
20 NK NK = 5Namide + 4Nhydroxyl − 3Nether − 5NCC + 3Nsulfone
21 Ndc Ndc = 19NN + 12N(side group O, −S−) + 52Nsulfone − 14Ncyc
22 Ngroup Ngroup = 12Nhydroxyl + 12Namide + 2N(non‑amide −(NH)− unit) −
N(alkyl ether −O−) − NCC + 4N(non‑amide −(CO)− next to a nitrogen)
+ 7N(−(CO)− in carboxylic acid, ketone, or aldehyde) +
2N(other −(CO)−)
23 NMV NMV = −5Nsulfone + 3Nester + 5NCC − 11Ncyc
24 NHη NHη = −7Namide + 6Nether + 5Nsulfone +
3N(six‑membered nonterminal aromatic rings) + 8NCC + 4 N4° carbon atoms
+ 2N3° carbon atoms
25 NUR NUR = −2NOH − 3Ncyc + 4N(six‑membered aromatic rings)
26 Nds Nds = 2NCH2
− 7NCC + 3N(six‑membered aromatic rings) − 12NCO2
27 NPS NPS = −3Nsp
3
carbon atoms + 6Ncarbonyl groups
28 NvdW NvdW = Nmenonar
b
+ Nalamid
c
+ NOH − 4Ncyc + 2NCC
29 Vw Vw = 3.861803°X + 13.7484351
Xv
, van der Waals volume
30 ξNOH ξ =
+ −N N N
NNOH
0.125N O H
31 M molecular weight
32 α polarizability
33 V̅ molar volume
34 log p octanol−water partition ratio
35 log D
(pH 5.5)
distribution coefficient at pH 5.5
36 log D
(pH 7.4)
distribution coefficient at pH 7.4
37 ΔHv enthalpy of vaporization
38 γ surface tension
a
The structure descriptors are defined by Bicerano.43 b
Nmenonar is the
number of methyl groups attached to nonaromatic atoms. c
Nalamid is
the total number of linkages between amide and nonaromatic atoms.
ACS Biomaterials Science & Engineering Article
DOI: 10.1021/acsbiomaterials.6b00041
ACS Biomater. Sci. Eng. 2016, 2, 946−953
948
4. 3.2. TNF-α Secretion from Activated and Naïve
Macrophages. Activated and naïve macrophages were
exposed to functionalized p(NIPAm-co-AAc) particles, and
the concentration of secreted TNF-α was measured (Figure
4A). LPS was used to stimulate that M1-like phenotype. The
control in which no particles were added to the cells contained
4.03 ± 0.51 ng/mL. This was statistically higher (p < 0.05) than
the unmodified p(NIPAm-co-AAc) particles and the particles
modified with ethylenediamine of 2.49 ± 0.29 and 2.55 ± 0.25
ng/mL, respectively. Compared to both the unmodified and
Eda-modified particles, modifications D and I−M resulted in
statistically higher TNF-α secretion (p < 0.05). Of these,
albizziin increased TNF-α secretion ∼2-fold. Modifications B,
E, G, and H decreased the TNF-α production (p < 0.05). The
most significant decrease was observed for 3-guanidinopro-
pionic acid of ∼40%. Details of multiple comparisons for these
data are in Table S1.
To explore the M2-like phenotype, macrophages were
stimulated with IL-4. The control without particles resulted
in 2.69 ± 0.08 ng/mL TNF-α measured in the supernatant.
The unmodified p(NIPAm-co-AAc) and Eda-modified particles
resulted in a decrease in TNF-α by 1.78 ± 0.13 and 1.68 ± 0.12
ng/mL, respectively (p < 0.05), similar to the M(LPS) cells.
Modifications A, I−K, and N resulted in increased TNF-α
secretion (p < 0.05), while modifications B, C, E, F, and H
resulted in a decrease (p < 0.05) compared to the unmodified
and Eda particles. Modifications C−G and K resulted in
increases in TNF-α secretion, and particles modified with I, J,
L, and M decreased the TNF-α concentration detected
compared to the unmodified and Eda particles. 2-Amino-3-
guanidinopropionic caused the largest increase in TNF-α
secretion of ∼200%, and 3-guanidinopropionic acid caused the
most significant decrease of ∼40%. Details of multiple
comparisons for these data are in Table S2.
Macrophages without activation were also incubated with the
modified particles, and the secreted TNF-α was assessed. The
control, unmodified p(NIPAm-co-AAc), and Eda particles were
Figure 2. ζ-Potentials for modified p(NIPAm-co-AAc) particles. Data
represent the mean value of three replicates for each sample ±
standard deviation. Eda = ethylenediamine, pN = unmodified
p(NIPAm-co-AAc).
Figure 3. Viability assay showing the cytotoxicity of all particles with
LPS or IL-4 activated or naïve RAW 264.7 cells. The % viability was
normalized to RAW 264.7 cells treated with LPS, IL-4, or naïve cells
without particles. Data represent the mean value of four replicates for
each sample ± standard deviation. Eda = ethylenediamine, pN =
unmodified p(NIPAm-co-AAc).
Figure 4. Molecular expression of (A) TNF-α and (B) urea/nitrite by
macrophages in respose to functionalized p(NIPAm-co-AAc) particles
and stimulation with LPS or IL-4. Naïve cells are also shown. Data
represent the mean value of four replicates for each sample ± standard
deviation. Eda = ethylenediamine, pN = unmodified p(NIPAm-co-
AAc), PC = positive control of cells without materials.
ACS Biomaterials Science & Engineering Article
DOI: 10.1021/acsbiomaterials.6b00041
ACS Biomater. Sci. Eng. 2016, 2, 946−953
949
5. not statistically different with 1.04 ± 0.11, 1.31 ± 0.11, and 1.12
± 0.13 ng/mL TNF-α detected. The largest increase in TNF-α
was found for modifications F and K, with an increase of
∼350%. The largest decrease was observed for modifications I,
J, and L, resulting in an 80% decrease in TNF-α compared with
the unmodified or Eda particles. Details of multiple
comparisons are in Table S3.
Taken together, modifications I, J, and K lead to increases in
TNF-α for both M(LPS) and M(IL-4), while modifications B,
E, and H lead to decreases in TNF-α secretion. The most
dramatic decreases in TNF-α secretion for both M(LPS) and
M(IL-4) were in the presence of the 3-guanidinopropionic acid
modification, which reduced TNF-α secretion by ∼40%
compared to unmodified and Eda-modified particles.
3.3. Urea/Nitrite for Activated and Naïve Macro-
phages. Arginase activity was measured by exposing cell
lysate to arginine and assessing its conversion to urea after 20 h
incubation. Increased arginase activity is suggestive of an M2-
like phenotype. Increased iNOS indicates an M1-like
phenotype. The activity of iNOS was indirectly measured
through a Griess assay in which nitrites, the stable form of NO,
are quantified. NO results from reactive nitrogen intermediates,
which are synthesized by iNOS. Arginine is generally
metabolized through one of these pathways, thus the ratio of
urea/nitrite can assess the extent of polarization toward either
phenotype.25,26
These results are shown in Figure 4B. The
nitrite and urea concentrations are shown as Figure S1A,B.
M(IL-4) cells were found to have 447 ± 68 mg/μmol urea/
nitrite. Cells incubated with A−D and I−L increased the
amount of urea/nitrite measured (p < 0.05), while particles
modified with E−H decreased the levels of urea/nitrite (p <
0.05). Measured levels of urea/nitrite ranged from 252 to 1023
mg/μmol. There was no statistical difference between the
M(IL-4) cells in the absence of particles and M(LPS) cells
incubated with unmodified and Eda-modified p(NIPAm-co-
AAc) particles: 421 ± 100 and 366 ± 70 mg/μmol urea/nitrite,
respectively. Details of multiple comparisons for urea/nitrite for
M(IL-4) are in Table S4.
M1-like cells were also studied using M(LPS)-stimulated
cells. No statistical differences were observed between the
control and cells incubated with unmodified and Eda-modified
particles: 62 ± 5, 69 ± 6, and 70 ± 7 mg/μmol urea/nitrite,
respectively. Particles E−H, K, and M resulted in elevated urea/
nitrite levels. Only particles A and I decreased urea/nitrite (p <
0.05) compared to the positive control, unmodified, and Eda-
modified particles. Details of multiple comparisons for urea/
nitrite for M(LPS) are provided in Table S5. In comparing
trends between M(LPS) and M(IL-4), only modification K
resulted in increasing urea/nitrite levels and no modifications
were able to decrease urea/nitirite in both M(LPS) and M(IL-
4) cells. It is important to note that these results may be
particular to murine macrophage cells. Human macrophages
transport arginine through system y+
L transporters,44
whereas a
cationic amino acid transporter has been suggested as an
arginine transporter in mice.45
Naïve macrophages were also tested for urea/nitrite levels.
The levels of nitrites detected for all M(0) cells were lower than
the standard curve. Statistical analysis on these values is not
reasonable.
3.4. Material Parameters That Influence Macrophage
Phenotypic Shifts. Secretion of TNF-α in the absence of
particles followed the expected trend, in which the highest
levels were observed for M(LPS), followed by M(IL-4) and
M(0).6,46−48
With the exception of modification A, M(LPS)
cells secreted more TNF-α than the M(IL-4) cells when they
were incubated with particles. The M(0) cells exhibited a range
of responses to the particles, secreting less TNF-α in the
presence of modifications A, C, J, Eda, and unmodified
p(NIPAm-co-AAc) than M(LPS) cells. Increased TNF-α was
observed for modification M compared to M(LPS) cells. The
increase in TNF-α secretion may be a result of LPS tolerance
developed in the M(LPS) cells, which leads to a decreased
production of TNF-α.49
Another possibility is that IL-10, a
suppressor of TNF-α, may be secreted. Previous findings have
demonstrated a decrease of TNF-α secretion in M(LPS) cells
by a factor of 21.4 ± 2.5 in the presence of 0.1 ng/mL IL-10.50
Arginase/iNOS is a measure of macrophage polarization,25,26
with high levels denoting M2-like states and low levels
indicating a more M1-like state. Here, we measure this using
urea/nitrite levels. In the case of M(IL-4), both the control and
the cells incubated with particles resulted in higher urea/nitrite
levels, which is expected.
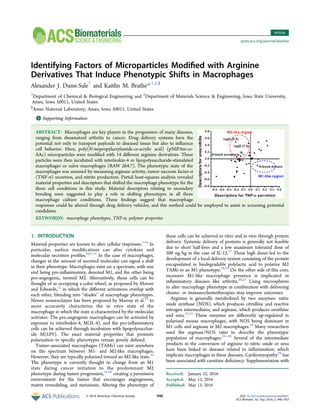
The aim of this work was to identify material properties that
influence M1- and M2-like phenotypes. The trends between
material properties and cell responses were quantitatively
modeled using material descriptors listed in Table 1. These
descriptors were based largely on structural descriptors43
along
with physiochemical properties. PLS was performed on the
measured data using principle component analysis values of
Figure 4A,B as a function of the molecular descriptors in Table
1. The results of the model are presented in Figure 5, where the
horizontal axis represents TNF-α secretion and the vertical axis
is urea/nitrite. Cells that secrete high levels of TNF-α and
exhibit low levels of urea/nitrite are M1-like, while the converse
are M2-like. Both of these regions are outlined in Figure 5. In
addition, the specific descriptors that promote either of these
two extremes are labeled on the plots. For M(IL-4) cells
(Figure 5A), increasing H-bond donors promoted a shift
toward an M1-like phenotype, while increasing H-bond
acceptors, Ndc, log D (5.5), and log D (7.4) retained the M2-
like phenotype. Log D is the octanol−water distribution
coefficient, which can be measured at any pH, and Ndc is a
correction factor for the dielectric constant. It bears mentioning
that the inverse of these material descriptors would result in a
shift toward the opposite phenotype. Based on these
parameters, polarity of the molecule appears to be an important
factor in altering M(IL-4) polarization. It should be noted that
surface tension had a negligible effect on either TNF-α or urea/
nitrite.
A larger number of material properties were identified as
altering M(LPS), shown in Figure 5B. Increasing the number of
freely rotating bonds, aliphatic carbons, van der Waals
interactions (calculated using NνdW), the number of carbon
and hydrogen atoms, and the enthalpy of vaporization
promotes an M2-like phenotype. On the other end of the
spectrum, primary carbon atoms, the number of sp2
carbon
atoms, NMVa correction term for molar volume, NURa
correction term for molar Rao function, ξNOHa correction
term for thermal conductivity, log p, log D (7.4), and log D
(5.5) promoted the M1-like phenotype. All of these parameters
suggest that hydrophobicity plays a dominant role in altering
M(LPS) cells.
Since the levels of nitrites detected for all M(0) cells were
lower than the standard curve, material properties influencing
phenotypic shifts were not analyzed because statistical analysis
on these values is not reasonable.
ACS Biomaterials Science & Engineering Article
DOI: 10.1021/acsbiomaterials.6b00041
ACS Biomater. Sci. Eng. 2016, 2, 946−953
950
6. Interesting similarities exist for the material properties that
promote phenotypic shifts in all the conditions examined here.
Descriptors related to hydrophobicity, van der Waals
interactions, and H-bonding were found to be related to
macrophage polarization for M(LPS) and M(IL-4). The
conventional dogma surrounding ligand−receptor binding
involves all of these interaction forces additively combining to
stabilize the ligand−receptor pair.51
Very likely, serum proteins
present in the culture media adsorb in different configurations
on the particle surface, thus enabling different interactions with
surface receptors. The complexity of macrophage activation and
reprogramming through surface receptors prevents predicting
which receptors these particles are interacting with; however,
examining the impact of material descriptors on altering
macrophage response has the potential to improve material
systems for implanted biomaterials as well as drug delivery
systems.
Based on the observations described above and in Figure 5,
three molecules were selected to alter the macrophage
phenotype: lysine, ornithine, and ureidopropionic acid. These
molecules were conjugated to Eda-modified particles as
described in section 2.1.1. The concentration of secreted
TNF-α and urea/nitrite in response to incubation with the
modified particles is shown in Figure 6.
Ureidopropionic acid was predicted to promote urea/nitrite
and TNF-α secretion in M(IL-4) cells and decrease secretion in
M(LPS). Factors that would increase urea/nitrite and TNF-α
secretion in M(IL-4) cells would be increased distribution
coefficients at pH 5.5 and 7 and a reduction in H-bond
acceptors. Compared to albizziin, ureidopropionic acid has
fewer H-bond acceptors and higher distribution coefficients at
pH 5.5 (−4.0 vs −2.62, respectively). The distribution
coefficients at pH 7 are decreased for ureidopropionic acid
(−4.4 vs −4.01). The distribution coefficients at pH 5.5 and 7
are very similar when compared to those of albizziin to
citrulline, ergo an increase in urea/nitrite and TNF-α secretion
would be expected for ureidopropionic acid compared to
citrulline, as is observed in Figure 5A,B, particularly since
citrulline has an additional H-bond donor compared to
ureidoprionic acid, much like albizziin. In the case of M(LPS)
cells, factors that cause cells to secrete decreased levels of urea/
nitrite are the distribution coefficients at pH 5.5 and 7. In the
Figure 5. Analysis of molecular descriptors to identify polymer
characteristics that promote M1- or M2-like profiles. Pearson’s
correlation between molecular descriptors that promote urea/nitrite
(y-axis) and TNF-α (x-axis) for (A) IL-4 and (B) LPS. Relevant
descriptors that promote M1- or M2-like responses are labeled on the
figure.
Figure 6. Molecular expression of (A) TNF-α and (B) urea/nitrite by
macrophages in respose to functionalized p(NIPAm-co-AAc) particles
and stimulation with LPS or IL-4. Naïve cells are also shown. Data
represent the mean value of four replicates for each sample ± standard
deviation.
ACS Biomaterials Science & Engineering Article
DOI: 10.1021/acsbiomaterials.6b00041
ACS Biomater. Sci. Eng. 2016, 2, 946−953
951
7. case of M(LPS) cells, the higher distribution coefficient for
ureidopropionic acid compared to that of either albizziin or
citrulline would cause a decrease in the urea/nitrite and TNF-α
levels, as was observed. The number of freely rotating bonds is
also lower for ureidopropionic acid compared to albizziin and
citrulline.
The difference between lysine and ornithine is an additional
aliphatic CH2 group in lysine, which also results in an additional
freely rotating bond for lysine. The other parameters
influencing urea/nitrite production are similar for the two
modifiers. This resulted in predictions that lysine would result
in increased nitrite/urea secretion compared to ornithine. The
additional CH2 group results in a 2-fold increase in urea/nitrite
for the two modifiers in the case of M(LPS) cells. In examining
the response of M(IL-4) cells, no difference between lysine-
and ornithine-modified particles was expected for urea/nitrite
and TNF-α levels since the differences in their structures did
not result in differences in the material descriptors identified in
Figure 5A,B.
4. CONCLUSIONS
In summary, we have examined how a library of 14 surface
modifiers alters macrophage response and have correlated those
responses to material descriptors that promote shifts in
phenotypes. Similarities between all three macrophage treat-
ment conditions exist in that intermolecular nonbonding
interactions play an important role in altering macrophage
responses. The differences between these three conditions
suggest the possibility that material properties can be exploited
to manipulate macrophage responses, possibly reprogramming
these cells without exogenous protein delivery. Semiquantita-
tive methods such as those employed in this study have the
potential to both improve screening for materials that promote
M1- or M2-like phenotypes in macrophages and add to the
current library of knowledge pertaining to how materials
influence cellular responses.
■ ASSOCIATED CONTENT
*S Supporting Information
The Supporting Information is available free of charge on the
ACS Publications website at DOI: 10.1021/acsbiomater-
ials.6b00041.
Details of multiple comparisons for TNF-α for M(LPS),
M(IL-4), and M(0) cells and for urea/nitrite for M(LPS)
and M(IL-4) cells; nitrite and urea measured for
M(LPS), M(IL-4), and M(0) cells (PDF)
■ AUTHOR INFORMATION
Corresponding Author
*Tel: 515-294-7304. Fax: 515-294-5444. E-mail: kbratlie@
iastate.edu.
Notes
The authors declare no competing financial interest.
■ ACKNOWLEDGMENTS
This work was supported by the National Science Foundation
under Grant No. CBET 1227867 and the Roy J. Carver
Charitable Trust Grant No. 13-4265. The authors also
acknowledge support from NSF ARI-R2 (CMMI-0963224)
for funding the renovation of the research laboratories used for
these studies.
■ REFERENCES
(1) Acharya, A. P.; Dolgova, N. V.; Clare-Salzler, M. J.; Keselowsky,
B. G. Adhesive substrate-modulation of adaptive immune responses.
Biomaterials 2008, 29, 4736−50.
(2) Schutte, R. J.; Xie, L.; Klitzman, B.; Reichert, W. M. In vivo
cytokine-associated responses to biomaterials. Biomaterials 2009, 30,
160−8.
(3) Anderson, J. M.; Rodriguez, A.; Chang, D. T. Foreign body
reaction to biomaterials. Semin. Immunol. 2008, 20, 86−100.
(4) Nilsson, B.; Ekdahl, K. N.; Mollnes, T. E.; Lambris, J. D. The role
of complement in biomaterial-induced inflammation. Mol. Immunol.
2007, 44, 82−94.
(5) Wang, D.; Phan, N.; Isely, C.; Bruene, L.; Bratlie, K. M. The
effect of polymer chemistry and macrophage phenotype on particle
internalization. Biomacromolecules 2014, 15, 4102−10.
(6) Wang, D.; Bratlie, K. M. Influence of Polymer Chemistry on
Cytokine Secretion from Polarized Macrophages. ACS Biomater. Sci.
Eng. 2015, 1, 166−74.
(7) Bygd, H. C.; Akilbekova, D.; Muñoz, A.; Forsmark, K. D.; Bratlie,
K. M. Poly-l-arginine based materials as instructive substrates for
fibroblast synthesis of collagen. Biomaterials 2015, 63, 47−57.
(8) Bygd, H. C.; Forsmark, K. D.; Bratlie, K. M. Altering in vivo
macrophage responses with modified polymer properties. Biomaterials
2015, 56, 187−97.
(9) Petersen, L. K.; Xue, L.; Wannemuehler, M. J.; Rajan, K.;
Narasimhan, B. The simultaneous effect of polymer chemistry and
device geometry on the in vitro activation of murine dendritic cells.
Biomaterials 2009, 30, 5131−42.
(10) Ariganello, M. B.; Simionescu, D. T.; Labow, R. S.; Lee, J. M.
Macrophage differentiation and polarization on a decellularized
pericardial biomaterial. Biomaterials 2011, 32, 439−49.
(11) Rodriguez, A.; Meyerson, H.; Anderson, J. M. Quantitative in
vivo cytokine analysis at synthetic biomaterial implant sites. J. Biomed.
Mater. Res., Part A 2008, 89, 152−9.
(12) Mosser, D. M. The many faces of macrophage activation. J.
Leukocyte Biol. 2003, 73, 209−12.
(13) Murray, P. J.; Allen, J. E.; Biswas, S. K.; Fisher, E. A.; Gilroy, D.
W.; Goerdt, S.; et al. Macrophage Activation and Polarization:
Nomenclature and Experimental Guidelines. Immunity 2014, 41, 14−
20.
(14) Mantovani, A.; Locati, M. Tumor-associated macrophages as a
paradigm of macrophage plasticity, diversity, and polarization: lessons
and open questions. Arterioscler., Thromb., Vasc. Biol. 2013, 33, 1478−
83.
(15) Biswas, S. K.; Sica, A.; Lewis, C. E. Plasticity of Macrophage
Function during Tumor Progression: Regulation by Distinct Molecular
Mechanisms. J. Immunol. 2008, 180, 2011−7.
(16) Qian, B.-Z.; Pollard, J. W. Macrophage diversity enhances tumor
progression and metastasis. Cell 2010, 141, 39−51.
(17) Gollob, J A.; Mier, J. W.; Veenstra, K.; McDermott, D. F.;
Clancy, D.; Clancy, M.; et al. Phase I trial of twice-weekly intravenous
interleukin 12 in patients with metastatic renal cell cancer or malignant
melanoma: ability to maintain IFN-gamma induction is associated with
clinical response. Clin. Cancer Res. 2000, 6, 1678−92.
(18) Hill, H.; Conway, T.; Sabel, M.; Jong, Y.; Mathiowitz, E.;
Bankert, R.; et al. Cancer immunotherapy with interleukin 12 and
granulocyte-macrophage colony-stimulating factor-encapsulated mi-
crospheres: coinduction of innate and adaptive antitumor immunity
and cure of disseminated disease. Cancer Res. 2002, 62, 7254−63.
(19) Watkins, S. K.; Egilmez, N. K.; Suttles, J.; Stout, R. D. IL-12
rapidly alters the functional profile of tumor-associated and tumor-
inflitrating macrophages in vitro and in vivo. J. Immunol. 2007, 178,
1357−62.
(20) Hofkens, W.; Schelbergen, R.; Storm, G.; van den Berg, W. B.;
van Lent, P. L. Liposomal Targeting of Prednisolone Phosphate to
Synovial Lining Macrophages during Experimental Arthritis Inhibits
M1 Activation but Does Not Favor M2 Differentiation. PLoS One
2013, 8, e54016.
ACS Biomaterials Science & Engineering Article
DOI: 10.1021/acsbiomaterials.6b00041
ACS Biomater. Sci. Eng. 2016, 2, 946−953
952
8. (21) Jain, S.; Tran, T.-H.; Amiji, M. Macrophage repolarization with
targeted alginate nanoparticles containing IL-10 plasmid DNA for the
treatment of experimental arthritis. Biomaterials 2015, 61, 162−77.
(22) Bronte, V.; Zanovello, P. Regulation of immune responses by L-
arginine metabolism. Nat. Rev. Immunol. 2005, 5, 641−54.
(23) Morris, S. M. Arginine metabolism: boundaries of our
knowledge. J. Nutr. 2007, 137, 1602S−1609S.
(24) Mantovani, A.; Sica, A.; Sozzani, S.; Allavena, P.; Vecchi, A.;
Locati, M. The chemokine system in diverse forms of macrophage
activation and polarization. Trends Immunol. 2004, 25, 677−86.
(25) Lumeng, C. N.; Bodzin, J. L.; Saltiel, A. R. Obesity induces a
phenotypic switch in adipose tissue macrophage polarization. J. Clin.
Invest. 2007, 117, 175−84.
(26) Allen, J. E.; Loke, P. Divergent roles for macrophages in
lymphatic filariasis. Parasite Immunol. 2001, 23, 345−52.
(27) Murphy, B. S.; Sundareshan, V.; Cory, T. J.; Hayes, D.; Anstead,
M. I.; Feola, D. J. Azithromycin alters macrophage phenotype. J.
Antimicrob. Chemother. 2008, 61, 554−60.
(28) Rath, M.; Muller, I.; Kropf, P.; Closs, E. I.; Munder, M.
Metabolism via Arginase or Nitric Oxide Synthase: Two Competing
Arginine Pathways in Macrophages. Front. Immunol. 2014, 5, 1−10.
(29) Amat di San Filippo, C.; Taylor, M. R. G.; Mestroni, L.; Botto,
L. D.; Longo, N. Cardiomyopathy and carnitine deficiency. Mol. Genet.
Metab. 2008, 94, 162−6.
(30) Ferrante, R.; Andreassen, O.; Jenkins, B.; Dedeoglu, a;
Kuemmerle, S.; Kubilus, J.; et al. Neuroprotective effects of creatine
in a transgenic mouse model of Huntington’s disease. J. Neurosci. 2000,
20, 4389−97.
(31) GUALANO, B.; DE SALLES PAINNELI, V.; ROSCHEL, H.;
ARTIOLI, G. G.; NEVES, M.; DE SÁ PINTO, A. L.; et al. Creatine in
Type 2 Diabetes. Med. Sci. Sports Exercise 2011, 43, 770−8.
(32) Arimoto, T.; Bing, G. Up-regulation of inducible nitric oxide
synthase in the substantia nigra by lipopolysaccharide causes microglial
activation and neurodegeneration. Neurobiol. Dis. 2003, 12, 35−45.
(33) Grant, S. K.; Green, B. G.; Stiffey-Wilusz, J.; Durette, P. L.;
Shah, S. K.; Kozarich, J. W. Structural requirements for human
inducible nitric oxide synthase substrates and substrate analogue
inhibitors. Biochemistry 1998, 37, 4174−80.
(34) Jang, J. J.; Ho, H. K.; Kwan, H. H.; Fajardo, L. F.; Cooke, J. P.
Angiogenesis is impaired by hypercholesterolemia: role of asymmetric
dimethylarginine. Circulation 2000, 102, 1414−9.
(35) Koc, a; Ozkan, T.; Karabay, a Z; Sunguroglu, a; Aktan, F. Effect
of L-carnitine on the synthesis of nitric oxide in RAW 264·7 murine
macrophage cell line. Cell Biochem Funct 2011, 29, 679−85.
(36) Oudman, I.; Clark, J. F.; Brewster, L. M. The Effect of the
Creatine Analogue Beta-guanidinopropionic Acid on Energy Metab-
olism: A Systematic Review. PLoS One 2013, 8, e52879.
(37) Hagen, T. M.; Ingersoll, R. T.; Wehr, C. M.; Lykkesfeldt, J.;
Vinarsky, V.; Bartholomew, J. C.; et al. Acetyl-L-carnitine fed to old
rats partially restores mitochondrial function and ambulatory activity.
Proc. Natl. Acad. Sci. U. S. A. 1998, 95, 9562−6.
(38) Calabrese, V.; Scapagnini, G.; Ravagna, a.; Bella, R.; Butterfield,
D a.; Calvani, M.; et al. Disruption of Thiol Homeostasis and
Nitrosative Stress in the Cerebrospinal Fluid of Patients with Active
Multiple Sclerosis: Evidence for a Protective Role of Acetylcarnitine.
Neurochem. Res. 2003, 28, 1321−8.
(39) Ricote, M.; Li, A. C.; Willson, T. M.; Kelly, C. J.; Glass, C. K.
The peroxisome proliferator-activated receptor-gamma is a negative
regulator of macrophage activation. Nature 1998, 391, 79−82.
(40) Guastadisegni, C.; Minghetti, L.; Nicolini, A.; Polazzi, E.; Ade,
P.; Balduzzi, M.; et al. Prostaglandin E2 synthesis is differentially
affected by reactive nitrogen intermediates in cultured rat microglia
and RAW 264.7 cells. FEBS Lett. 1997, 413, 314−8.
(41) Motrán, C. C.; Díaz, F. L.; Gruppi, A.; Slavin, D.; Chatton, B.;
Bocco, J. L. Human pregnancy-specific glycoprotein 1a (PSG1a)
induces alternative activation in human and mouse monocytes and
suppresses the accessory cell-dependent T cell proliferation. J.
Leukocyte Biol. 2002, 72, 512−21.
(42) Levinson, S. S. Kinetic centrifugal analyzer and manual
determination of serum urea nitrogen, with use of o-phthaldialdehyde
reagent. Clin. Chem. 1978, 24, 2199−202.
(43) Bicerano, J. Prediction of Polymer Properties; Marcel Dekker Inc.:
New York, 2002.
(44) Rath, M.; Muller, I.; Kropf, P.; Closs, E. I.; Munder, M.
Metabolism via Arginase or Nitric Oxide Synthase: Two Competing
Arginine Pathways in Macrophages. Front. Immunol. 2014, 5, 1−10.
(45) Manner, C. K.; Nicholson, B.; MacLeod, C. L. CAT2 arginine
transporter deficiency significantly reduces iNOS-mediated NO
production in astrocytes. J. Neurochem. 2003, 85, 476−82.
(46) Akilbekova, D.; Philiph, R.; Graham, A.; Bratlie, K. M.
Macrophage reprogramming: influence of latex beads with various
functional groups on macrophage phenotype and phagocytic uptake in
vitro. J. Biomed. Mater. Res., Part A 2015, 103, 262.
(47) Barth, K a.; Waterfield, J. D.; Brunette, D. M. The effect of
surface roughness on RAW 264.7 macrophage phenotype. J. Biomed.
Mater. Res., Part A 2013, 101, 2679−88.
(48) Varin, A.; Mukhopadhyay, S.; Herbein, G.; Gordon, S.
Alternative activation of macrophages by IL-4 impairs phagocytosis
of pathogens but potentiates microbial-induced signalling and cytokine
secretion. Blood 2010, 115, 353−62.
(49) Docke, F. R. W.; Bundschuhrt, D. S.; Hartung, T.; Wendel, A.;
Volk, H. In vitro prevention and reversal of lipopolysaccharide
desensitization by IFN-gamma, IL-12, and granulocyte-macrophage
colony-stimulating factor. J. Immunol. 1997, 158, 2911−8.
(50) Bogdan, C.; Vodovotz, Y.; Nathan, C. Macrophage deactivation
by interleukin 10. J. Exp. Med. 1991, 174, 1549−55.
(51) Seong, S.-Y.; Matzinger, P. Hydrophobicity: an ancient damage-
associated molecular pattern that initiates innate immune responses.
Nat. Rev. Immunol. 2004, 4, 469−78.
ACS Biomaterials Science & Engineering Article
DOI: 10.1021/acsbiomaterials.6b00041
ACS Biomater. Sci. Eng. 2016, 2, 946−953
953