Investment Banking and Capital Markets- Ivey MBA 2024
Wells Fargo - Valuation Report-2
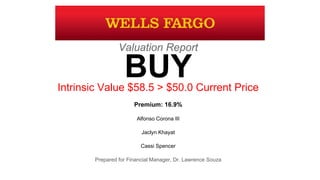
1. Valuation Report
Intrinsic Value $58.5 > $50.0 Current Price
Premium: 16.9%
Alfonso Corona III
Jaclyn Khayat
Cassi Spencer
Prepared for Financial Manager, Dr. Lawrence Souza
BUY
3. ● Founded: In 1852 by Henry Wells and William G. Fargo
● Purpose: Originally to provide express and banking services to California
● 1969: Wells Fargo & Company holding company formed, with Wells Fargo as its main subsidiary
● Headquarters: San Francisco, California
● Specializes in banking and financial services, consumer/corporate, credit cards, mortgage loans,
wealth management, foreign currency exchange.
○ 264,700 Full Time Employees
○ $1.8 Trillion in Assets
○ Total Market Capital: $256,424,723,120
○ Revenue: $90,033,000,000
○ Net Income: $22,894,000,000
Background
5. Products and Services
● Branch, ATM, Telephone and Online
Banking
● Investment Banking
● Credit Cards ● Asset Management
● Home Loans and Home Equity Line
of Credit
● Treasury Services
● Education Finance ● Worldwide Security Services
● Retirement & Investing ● Private Banking
● Personal Bank Accounts ● Investment Advisory
6. Leadership
John G. Stumpf
Chairman, CEO
MBA, University of Minnesota
1982 - Present (34 years)
Previously worked at Norwest
John R. Shrewsberry
Senior Executive VP, CFO
MBA, Yale School of Management
2001 - Present (15 years)
Previously a successor to a commercial
finance company he cofounded.
David M.Carroll
Senior Executive VP
University of North Carolina, Chapel Hill
2011 - Present (7 years)
Previously worked at First Union National
Bank.
Michael J. Loughlin
Senior Executive VP, CRO
University of California, Berkeley
1986 - Present (30 years)
Previously worked at Crocker
National Bank.
Patricia R. Callahan
Senior Executive VP, CAO
Master’s in Management, MIT
1977 - Present (39 years)
Previously worked at Crocker
National Bank.
Avid Modjtabai
Senior Executive VP, CLO
Stanford University
1993 - Present (23 years)
Previously worked at McKinsey & Company.
7. Banking Ranking
Rank Institution Name Total Asset ($Trill)
1 JP Morgan 2.3
2 Bank of America 2.1
3 Wells Fargo 1.8
4 Citigroup Inc. 1.7
5 American Express Co. 0.2
8. S. W. O. T.
Strengths
1. Strong brand name and good financial position
2. Strong credit-rating
3. Diverse products and services
4. One of the largest recruiters with over 280,000
employees globally
5. Wells Fargo is the second largest bank in deposits,
home mortgage servicing, and debit card
Weaknesses
1. Lacking in global acclaim as
compared to competitors
2. Low customer-care and satisfaction
3. Legal issues
Opportunities
1. Expansion in other countries
2. Diversifying portfolios for customers
3. Acquisitions and JVs
4. Commercial banking industry
Threats
1. Changing govt regulations and
financial crisis like recessions
2. Online frauds and scams
9. Technical Analysis
Target Price $56.3 > $50.0 Current Price Premium: 12.5%
● Upward Trend Line
● Trading Above Resistance
● Approach to Resistance
Resistance Line
Downward Momentum
Volume
Support Line
Trend Line
10. Financial Condition
Financial Ratios Wells Fargo BOA Peer Group Industry Condition
Profitability (%)
Net Profit Margin 24.9 17.5 21.9 19.0 Excellent
ROA 1.3 0.7 0.9 1.0 Good
ROE 12.1 6.3 9.8 8.8 Excellent
Leverage Ratios
Debt to Equity 1.0x 1.0x 1.3x 1.1x Average
Interest Coverage 7.7x 2.5x 4.4x 2.4x Excellent
Overall Good
11. Financial Condition
Financial Ratios Wells Fargo BOA Peers Industry Condition
Equity Ratio
Forward P/E 11x 9x 10x 11x Above Average
Dividend Payout (%) 35.1 15.0 27.7 41.9 Above Average
Growth Rate
Revenue (%) 2.0 (2.1) (0.4) (2.0) Excellent
Operating Income (%) 39.1 26.9 32.9 21.3 Good
Net Income (%) 25.0 17.5 21.3 27.3 Good
EPS (%) 4.1 1.3 2.7 2.7 Good
Overall Good
12. Valuation: Perpetuity Model
CAPM Model
Risk Free Rate 2%
Beta 1.0
Expected Market Return 10%
Cost of Equity 10%
Cost of Equity Intrinsic Stock Value Range
8% $56.3 High
9% $50.0 Medium
10% $45.0 Low
Intrinsic Stock Value $56.3 > $50.0 Current Stock Price Premium: 12.5%
2014 2015 2016E 2017E
EPS 4.1 4.1 4.3 4.2
g (%) 0.8 0.5 5 4
13. Valuation: Gordon Growth
Discount Rates
Cost of Debt 6%
CAPM 10%
WACC 7.6%
i/g 1% 2% 3% Range
8% 64.3 75.0 90.0 High
9% 56.3 64.3 75.0 Medium
10% 50.0 56.3 64.3 Low
Range Low Medium High
Intrinsic Stock Value $64.3 > $50.0 Current Stock Price Premium: 28.6%
2015 2016E 2017E
EPS 4.1 4.1 4.2
g (%) 0.5 0.8 O.7
Formula: PV = Expected EPS / (i-g)
Stock Value = $4.15 / (9% - 2%) = $64.3
14. Valuation: Multiple Approach
Intrinsic Stock Value $51.8 > $50.0 Current Stock Price Premium: 3.7%
EPS in 2017 g
4.2 0.7 P/E Ratio Stock Value Range
13x 56.1 High
12x 51.8 Medium
11x 47.5 Low
P/E Ratio 2015 2016E 2017E
Wells Fargo 12X 12x 11x
Bank of America 12X 12x 10x
Goldman Sachs 9X 9x 9x
Citigroup Inc 12X 12x 8x
JP Morgan 11X 11x 10x
Formula: PV = P/Et+1
* M = $4.32 * 12
15. 2016 2017 2018 2019 2020 2021 TV
EPS 4.3 4.5 4.6 4.8 4.9 4.9
66.1
g 5 4 3 3 2 2
Discounted
Cash Flow
10.4 10.3 10.3 10.3 10.4 10.0
Corporation
Value
$61.7
Valuation: DCF Model
Weighted Debt 60%
Weight Equity 40%
Rdebt
5%
Requity
8%
WACC
(unadjusted)
6%
WACC Stock Value Range
6% $66.4 High
7% $61.7 Medium
8% $57.0 Low
Intrinsic Stock Value $61.7 > $50.0 Current Stock Price Premium: 23.4%
16. Weighted Stock Valuation
Intrinsic Stock Value $58.5 > $50.0 Current Stock Price Premium: 16.9%
Model Stock Value Weight
Perpetuity $56.3 5% 10% 15%
Gordon Growth $64.3 5% 10% 15%
Multiples $51.8 40% 30% 25%
Discounted CF $61.7 50% 50% 45%
$57.6 $58.5 58.8
BUY
17. Summary
★ Financial Condition: GOOD
★ The 3rd largest United States bank in terms of asset holding
★ Intrinsic Value $58.5 > $50.0 Current Price Premium: 16.9%
★ Recommendation:
Financial Services Index Financial Service ETFs Bank Stock
● Buy Forwards ● Buy on Margin ● Buy on Margin
● Buy Futures ● Buy Calls ● Buy Calls
● Buy Calls on Futures ● Write Puts ● Write Puts
● Write Puts on Futures
Trades: 12
BUY
18. References
❖ Morning Star Report of Wells Fargo & Company
❖ Wells Fargo & Company Website
❖ Yahoo Finance, 2015
❖ Google Finance, 2015
❖ Value Line Report of Wells Fargo & Company, 2015
19. Appendix: Intrinsic Valuation Matrix
High Medium Low
Perpetuity Model $56.3 $50.0 $45.0
Gordon Growth $75.0 $64.3 $56.3
Multiple Approach $56.2 $51.8 $47.5
DCF Approach $66.4 $61.7 $57.0
Intrinsic Stock Value $58.5 > $50.0 Current Stock Price Premium: 16.92%