1. Middle East Well Evaluation Review
A
ncient coral reefs, long buried in
sedimentary rocks, are an impor-
tant source of oil in the Middle
East. These carbonate rock formations,
created from the skeletal remains of
diverse marine species, have been
around for at least 600 M years. Some
reefs formed in shallow coastal waters,
while others developed around vol-
canic islands a long way from any large
continent. What factors controlled the
occurrence of these coral reefs, and
which have the best reservoir potential?
In common with modern coral reefs,
ancient reefs (figure 1.1) thrived in
warm, shallow water with very little
associated sediment. Over geological
time many different types of organism
have dominated the reef environment,
but all have achieved their best growth
rates in shallow equatorial waters. Con-
sequently, the diversity and abundance
of coral species decrease with distance
away from the equator.
The typical island reef, developed
around an oceanic volcano, has little
potential for oil and gas accumulation.
In these reef ecosystems almost all the
organic material present is in the form
of living organisms. Nutrients from dead
organisms are recycled very rapidly. As
a result, reefs do not generally produce
enough ‘excess’ organic material to gen-
erate oil and gas. However, some reefs
do contain hydrocarbons, and the best
oil and gas targets are reefs which
developed close to ancient continental
margins. Here, organic input from a
nearby continental shelf may have gen-
erated hydrocarbons or been incorpo-
rated in shales which can act as trap
rocks.
The Arabian Peninsula spans a range
of latitudes, so that in the south - the
Gulf of Aden and the Red Sea - condi-
tions are, currently, favourable for coral
growth, while the Eastern Mediter-
ranean and The Gulf are marginal areas,
with few coral species. The Red Sea is
particularly rich in modern coral reefs,
especially along the edges of fault
blocks.
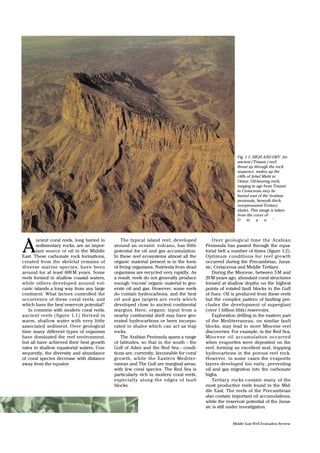
Fig. 1.1: HIGH AND DRY: An
ancient (Triassic) reef,
thrust up through the rock
sequence, makes up the
cliffs of Jebel Misht in
Oman. Oil-bearing reefs,
ranging in age from Triassic
to Cretaceous may lie
buried east of the Arabian
peninsula, beneath thick,
overpressured Tertiary
shales. This image is taken
from the cover of
O m a n '
Over geological time the Arabian
Peninsula has passed through the equa-
torial belt a number of times (figure 1.2).
Optimum conditions for reef growth
occurred during the Precambrian, Juras-
sic, Cretaceous and Middle Tertiary.
During the Miocene, between 5M and
20M years ago, abundant coral structures
formed at shallow depths on the highest
points of rotated fault blocks in the Gulf
of Suez. Oil is produced from these reefs
but the complex pattern of faulting pre-
cludes the development of supergiant
(over 1 billion bbls) reservoirs.
Exploration drilling in the eastern part
of the Mediterranean, on similar fault
blocks, may lead to more Miocene reef
discoveries. For example, in the Red Sea,
Miocene oil accumulation occurred
when evaporites were deposited on the
reef, forming an excellent seal, trapping
hydrocarbons in the porous reef rock.
However, in some cases the evaporite
layers developed too early, preventing
oil and gas migration into the carbonate
highs.
Tertiary rocks contain many of the
most productive reefs found in the Mid-
dle East. The reefs of the Precambrian
also contain important oil accumulations,
while the reservoir potential of the Juras-
sic is still under investigation.
2. Number 15, 1994.
A number of Tertiary reef prospects
are being developed across the Middle
East. There are Eocene-Oligocene (early
Tertiary) reefs in northern Syria and Iraq
and part of the Asmari reefs facies in Iran
produces hydrocarbons. More Tertiary
reefs have been discovered in Oman and
in the Gulf of Aden. These discoveries
may develop into important reservoirs in
the future, although they are not, as yet,
in commercial production.
The oldest reefal reservoirs in Arabia
are located in the Precambrian rocks of
southern Oman which contain algal stro-
matolitic reefs. Stromatolites are large
accumulations of carbonate sediment and
skeletal material bound together by algae.
They are often dome-shaped and have a
distinctive, finely-laminated appearance.
In addition, deep drilling projects in mar-
ginal areas of the Ara and Hormuz salts
are expected to reveal additional oil and
gas in stromatolitic reservoirs.
Recently, reef- forming stromatolites
have been discovered in Belize and Hon-
duras, in Central America. Studies of
these stromatolites should clarify the role
which these organisms play in the devel-
opment of modern reef communities.
During the Jurassic, environmental
conditions in Arabia meant that oolitic
carbonate sands were more common
than reefs. Oolites are rocks composed of
Tertiary
Cretaceous
Jurassic
Triassic
Permian
Carboniferous
Devonian
Silurian
Ordovician
Cambrian
CenozoicMesozoicPalaeozoic
Precambrian
Present
sea level
0 0.5 1.0
Relative changes of sea level
Falling Rising
1st &2nd - Order Cycles
600
500
400
300
200
100
10oN 10oS 30oS 50oS
Equator
Position of Arabia with
respect to the Equator
Sahara glaciation
Gondwanan
glaciation
Predominanceofcarbonates
Predominanceofclastics
Myears
Reefs absent
Incipient reefs
Reefs fully developed
World reef potential through time
Can have
oomouldic
Aragonite
threshold
Can have
oomouldic
(Leached oolite)
moulds
Ocean chemistry
Holocene
Fig. 1.2: Reefs have come and
gone throughout geological
history. The presence of well-
developed reef facies (a) is linked
to sea level fluctuations. The times
when reefs have been almost
absent from the geological record
show a rough correlation with
periods of rapid sea level change
(b). Another factor controlling the
development of coral reefs is the
movement of Arabia relative to
the equator through time (c).
Although close to the equator
during the Devonian, Arabia was
completely above sea level at that
time, so no coral reefs developed
on the Arabian peninsula. The
development of ooids (which are
chemical rather than biological
carbonates) is controlled by
seawater chemistry. As ocean
chemistry fluctuated through time
(d) the changes influenced the
relative stability of calcite and
aragonite cements and the
dissolution of ooids. This diagram
is based on concepts developed by
David Raup, M.W. Hughes Clarke,
Peter Vail and Bruce Wilkinson.
carbonate grains (ooids) which form in
tidal deltas and other shallow environ-
ments or ‘shoals’. They are not pro-
duced by biological processes, rather
the carbonate in each ooid precipitated
directly from calcium carbonate
(CaCO3 ) saturated seawater.
However, some ‘patch reefs’ did
occur in the Jurassic. These small car-
bonate structures were scattered across
the shallowest parts of the continental
shelf. The patch reefs found to the west
of Riyadh, in Saudi Arabia, provided
good reservoirs on salt domes and anti-
clinal structures in The Gulf and along
its southern shore.
The hydrocarbon potential of the rel-
atively large Jurassic marginal reef in
the Gotnia Basin, has not been exam-
ined in detail. However, a recent discov-
ery in the Kuwait/Saudi Neutral Zone
(South Umm-Guadir DW-1) by the
Kuwaiti Oil Company (KOC) and Saudi
Arabia Texaco should renew interest in
this potential reef target. Good dolomiti-
zation of the shelf-edge reef trend has
been found, with one of the best source-
rock sequences down dip in the Gotnia
Basin. However, effective seals are pre-
sent which may separate source from
reefal facies, and could have hindered
oil and gas migration.
(a) (b) (c) (d)
3. Middle East Well Evaluation Review
Darwin’s other discovery
Charles Darwin, the naturalist whose
theories revolutionized our understand-
ing of biological science, made a signifi-
cant contribution to the study of reefs. In
1842, while engaged on a scientific voy-
age on the research ship HMS Beagle,
Darwin proposed his subsidence theory
for the development of coral atolls. He
speculated that reef atolls had, at some
time in their development, been mar-
ginal or fringing reefs (figure 1.3a)
around an island. Darwin believed that
as the island started to subside, the fring-
ing reefs continued to grow upwards at a
rate equal to, or greater than subsi-
dence. Consequently, as the area of the
central island decreased, a shallow
lagoon formed between the island and
the growing reef (figure 1.3b). When the
island finally dropped below sea level,
all that remained was a large lagoon
fringed with upbuilding reef material (fig-
ure 1.3c). Seismic surveys and drilling car-
ried out as part of the 1991 Ocean Drilling
Program (Leg 143) appear to have con-
firmed Darwin’s theory on atolls.
Darwin also speculated on the char-
acteristics of a specific group, the Mal-
dive atolls. He suggested that subaerial
erosion and subsidence were the most
important factors in their development.
However, recent studies suggest that
Darwin’s sea level fluctuations alone can
not account for all the complexities of
carbonate deposits in the Maldives.
Seismic surveys and drilling in both
the Maldives and the Seychelles have
confirmed existing plate tectonic recon-
structions of the Indian Ocean. In the
Maldives, carbonate deposition began in
the early Eocene with shallow water sed-
iments resting on hot-spot basalts (figure
1.4) related to the slightly older Deccan
Trap basalt rocks of India. Very little is
known about the early development of
the islands, but the limited evidence sug-
gests that early rifting coincided with
development of a graben system along
the transform fault on which the Mal-
dives carbonate platform and atolls
grew. The overall structure of the plat-
form was probably influenced by crustal
cooling effects.
Island reefs and reef platforms are
not potential exploration targets, since
they generally lack a source rock or seal-
ing layer, or both. Reef environments
such as the modern Maldives platform
contain large volumes of porous and
permeable rock, but the Maldives are
too far from sources of organic material
to generate hydrocarbons and too small
to generate the sealing layers necessary
for oilfield development.
Arabian Sea
Indian Ocean
India
Africa Maldives
Saudi
Arabia
Reefs
Island records
The subsidence history of a small vol-
canic island and subsequent growth of
an Eocene coral reef has been recon-
structed using geochemical logging car-
ried out as part of the Ocean Drilling
Program. Experts from Columbia Uni-
versity’s Borehole Research Group stud-
ied a composite volcanic-carbonate
sequence in the Indian Ocean, using a
Geochemical Logging Tool (GLT*) to
unravel the geological history of the area.
The volcanic rocks proved to be
mainly vesicular olivine basalts which
showed weathering effects. This sug-
gested that they may have formed the
surface of a volcanic island. These rocks
were overlain by plagioclase basalts
with high concentrations of titanium (Ti)
and iron (Fe). Basalts can be assigned to
geochemical ‘families’, with the chemi-
cal composition of the rocks indicating
Fig. 1.3: GOING,
GOING, GONE:
Darwin’s theory
of volcanic island
subsidence has
been confirmed
by geochemical
analysis carried
out during the
Ocean Drilling
Project.
According to
Darwin, before
subsidence the
volcanic island
would have had a
fringing reef (a).
When the island
started to subside
coral growth
continued at a
rate greater than
or equal to
subsidence.
Eventually, a
lagoon appeared
behind the reef
(b) and, as
subsidence
continued, the
island dropped
below sea level
leaving an empty
lagoon ringed
with coral (c).
Fig. 1.4: HOT SPOTS: The Maldives are ocean
islands produced by movement of the Indian
Plate over a mantle ‘hot spot’ which pushes
basalt through the crust to form volcanic
islands. As each island moves away from the
hot spot the volcano loses its source of magma
and the island starts to subside.
(a)
(b)
(c)
4. Number 15, 1994.
probable tectonic setting. High concen-
trations of iron, aluminium and silicon
(figure 1.5) are typical of basalts found
in volcanic island settings. The alu-
minium ‘spikes’ in the lower part of the
log correspond to weathered ‘soil’ lay-
ers deposited between the basalt flows.
A thin calcarenite zone, interpreted
from core as a beach deposit, is fol-
lowed by a distinctive, titanium-rich
basalt layer which marks the end of vol-
canic activity on the island.
The reef proved more difficult to
sample, with a core recovery rate of
only 5%. However, this was enough to
indicate a transition from high-energy
grainstones to low-energy packstones.
This, together with successive faunal
changes, confirmed that the water
above the reef was getting deeper. Car-
bonates, in stark contrast to basalts, are
characterized by low concentrations of
aluminium, iron and silicon and, of
course, a high calcium content.
Fig. 1.5: WHERE’S THE BEACH?
Geochemical logging is proving a
powerful tool for stratigraphic
interpretation. The geochemical
data retrieved from this borehole
show a calcium-rich carbonate
(reef) deposit overlying an iron-
rich basalt (volcanic complex). A
separate calcium-rich layer,
identified from core material as a
beach deposit, occurs in the
middle of the volcanic sequence.
Columbia University, Borehole
Research Group, 1990.
0 TiO2 5
100 SiO2 5 100 CaO 0
0 FeO 20 0 S 10
50 Al2O3 0
80007900810082008300
Depthbelowtherigfloor
Ti Si Fe Ca S Al
ft
Benthic
foraminifera,
gastropods,
bryozoans,
molluscs,
solitary and
colonial corals
Grainstones
Subaerial
vesicular olivine
basalt lava flows
(1-5m thick)
with lateritic
weathering
Calcarenite
(beach)
High Ti/Fe
plagioclase
basalt
Volcanic island
Fringing reef
Packstones
The sulphur curve in this log shows
zones of high sulphur concentration
within the reef. These sulphur peaks
have been interpreted as sulphate evap-
orites. Experts have speculated that the
log shows sea level changes with low
stands marked by relatively high sul-
phur content. Sulphur peaks at wave-
lengths of 25ft and 50ft could be related
to the Eocene low sea level stands (at
36 M, 40 M, 42 M, 49 M and 54 M years
ago) recorded in the Vail eustatic sea
level curve. This example illustrates the
value of geochemical techniques in
determining the geological history of a
sequence from raw element data
recorded direct from logs.
The karst (subaerial weathering of
limestone) features found in many
ancient reefs underline the importance
of fresh water diagenesis, which caused
leaching of less stable carbonate miner-
als. Fresh water zones fluctuate through
time as sea level rises and falls in rela-
tion to the atoll islands and the platform.
Geothermally-heated fluids, which rise
along crustal fracture and fault systems,
mix with cooler seawater and fresh water
lenses which are scattered within upper
parts of the atolls and the platform.
Permo-Triassic ‘exotics’ - large rock
masses which have been structurally
emplaced into a sedimentary sequence -
were thrust onto the slope/shelf at the
eastern edge of Arabia during the Creta-
ceous. These may be fragments of
ancient atolls and platforms similar to
those in the Maldives. Although the
exotics seen at the surface contain no
hydrocarbons, there may be oil and gas-
filled reef blocks beneath Tertiary shales
off the east coast of Arabia. If these
deeper blocks could match the produc-
tivity of similar reefs in the Gulf of Mex-
ico, they would represent a major new
exploration target in the Middle East.
However, the overpressured Tertiary
seal, which may also be the source rock,
is a serious obstacle to deep drilling
operations.
Sorting out the salt
The salt dome structures which underlie
prolific reservoirs in The Gulf - including
the Permo-Triassic Khuff carbonates, the
Jurassic grainstone reservoirs and Creta-
ceous grainstone/reefal reservoirs -
sometimes form islands, but have very
little in common with the ocean atolls.
Formations overlying the salt domes are
closely interlinked and continuous with
formations which surround the dome.
Hydrological studies suggest that these
reefs often form part of regional aquifers.
The numerous evaporite layers found in
Permo-Triassic and Jurassic formations,
and the thick clay-rich shales deposited
during phases of low sea level, are wide-
spread and form effective seals: ideal for
the development of giant oil and gas
reservoirs.
5. Middle East Well Evaluation Review
The Egyptian experience
The Belayim carbonate facies, and the
equivalent Gemsa Formation, developed
along Egypt’s Gulf of Suez as scattered
and separate carbonate deposits. In the
northern part of the Darag Basin, the
Belayim carbonates were deposited in a
very shallow marine sabkha environment.
In the west central part of the Gulf of Suez,
in the Ras Gharib and Ras Fanar fields,
the Belayim was deposited as a reef com-
plex. In the southern Gulf of Suez these
carbonates are represented by reefal lime-
stones, such as those in Gemsa Field, and
also sabkha carbonates.
Structural factors control the distribu-
tion of the Belayim carbonate facies,
which were deposited on tilted and
eroded pre-Miocene fault blocks (figure
1.7). These fault blocks developed during
the opening of the Gulf of Suez and are
formed by NW-SE oriented Clysmic faults.
Fractures associated with the structures
have enhanced secondary porosity, per-
meability and hydrocarbon potential.
Fig. 1.6: ALL SHOOK UP: The dolomite replaces limestone layer-by-layer and its
small-scale distribution through the reservoir rock sequence is difficult to
predict in this Miocene reservoir sequence in the Gulf of Suez. Only detailed
geochemical logging techniques can provide a quantitative view of dolomite
diagenesis in this complex sequence; a mixture of calcite, dolomite, quartz,
pyrite, glauconite and two types of clay.
Diagenesis, dissolution
and dolomite
Porosity evolution in rocks is a com-
plex, but vital part of reservoir develop-
ment and a clear understanding of this
process is crucial in the search for oil
and gas. Porosity varies within rock lay-
ers. Where the porosity of a reservoir
layer falls below a threshold, or cut-off,
it ceases to be a viable reservoir. This
cut-off value varies from reservoir to
reservoir.
A picture of the porosity distribution
in each reservoir zone depends on a
clear understanding of reservoir geo-
chemistry (figure 1.6).
Other elements in the porosity equa-
tion are sedimentary geochemistry,
pressure and temperature of burial, fluc-
tuating sea level and changing pore
fluid composition. Reservoir analysts
must build a composite picture of
porosity, extrapolating and interpolating
data between wells from the start of
drilling.
Dolomite makes a difference
Dolomite mineralization can play a
major part in influencing reservoir prop-
erties such as porosity and permeabil-
ity. The conversion of pure limestones
(CaCO3 ) to dolomite (CaMg
(CO3 )2 ) is a gradual process
which can start almost as soon as the
carbonate sediments have been
deposited. Dolomite crystallization is
caused by seawater interacting with
fresh water lenses or pore water in car-
bonate rocks. This dolomitization
process can take place in hypersaline
ponds where there are freshwater
lenses in the sediment or in coastal
lakes which are subjected to intense
evaporation.
While dolomites can be produced in
a number of ways, the chemical
changes involved do not vary. Magne-
sium from the seawater replaces some
of the calcium present in the original
limestone. The concentration of magne-
sium in dolomite is much higher than in
the seawater from which it was derived.
Dolomite crystallization and dissolu-
tion processes often control porosity
development in carbonate reservoirs.
Early dolomitization can preserve
porosity which might be lost by com-
paction effects and calcite cementation.
Dolomitization often occurs as a
result of repeated sea level changes and
the mixing of hypersaline basinal brines
and normal seawater which accompa-
nies these changes. At the same time,
leaching of less stable skeletal compo-
nents (aragonite) occurs, along the plat-
form margins, increasing porosity. Dur-
ing long periods of rising sea level
(marine transgressions) dolomite miner-
alization may spread to carbonates at
the centre of the platform. The extent of
dolomitization, and its effect on reser-
voir properties, depends on the volume
and salinity of the hypersaline brines.
Large volumes of mouldic, vuggy and
intercrystalline porosity can be created
by marine transgressions.
Changing sea level and water chem-
istry also influence the composition of
common pore-filling cements. Calcite
cementation is retarded because the cal-
cium carbonate in solution is incorpo-
rated into the precipitating dolomite.
When calcite cementation is inhibited,
the development of anhydrite cements
is the most important porosity-reducing
mechanism. In some cases, both pri-
mary porosity and early-generated sec-
ondary porosity have been filled by
anhydrite cements.
Calcite
Dolomite
Montmorillonite
Quartz
Oil
Water
Kaolinite
Pyrite
x400ft
x500ft
6. Number 15, 1994.
Impermeable salt and anhydrite
which surround carbonate deposits in
the southern Gulf of Suez, for example at
Gebel al Fessayan, prevented hydrocar-
bon migration into potential reservoir
zones. Clearly, the position of salt and
anhydrite layers is crucial in any evalua-
tion of reservoir potential in carbonates.
Miocene carbonate facies vary through-
out the Gulf of Suez. The supratidal
sabkha deposits at the northern end of
the basin, around Ras Fanar Field and in
the Darag Basin, generally have poor
reservoir potential. In contrast, the reef
complexes of Nullipore facies found in
the Ras Gharib, Ras Fanar, Ras Bakr and
Gemsa fields are excellent reservoirs.
Fig. 1.7: The reef reservoirs
which developed in Egypt’s
Gulf of Suez are found in a
variety of positions along the
trend of Miocene fault blocks.
Fig. 1.8: Dolomite mineralization
develops gradually, spreading
grain by grain through the
reservoir rock. The progressive
growth of dolomite crystals
within a Miocene reservoir is
shown in these microscope
photos (a-c). In the final stages of
dolomitization pore space can be
filled by dolomite (d).
Abu Shaar el Qibli
Zeit Bay Gemsa
Miocene Sea Level
Modern sea level
15-20mYounger reef
Older reef
Dolomite
Fig. 1.9: The interaction of seawater with
fresh water (arrows) provided an ideal
environment for the replacement of calcite
by dolomite after deposition of the older
reef. The upper limit of dolomite
development coincides with maximum sea
level. The younger reef is presently
undergoing dolomitization. Radioactive
dating indicates the older reef cycle is
between 350,000 and 270,000 years old.
The younger reef cycle was deposited
between 140,000 and 60,000 years ago
(Strasser et al., 1992).
These images provided by Denise Stone, Amoco Prod. Res., Houston
(a) (b)
(c) (d)
Early dolomitization and subsequent
dissolution of the dolomite crystals were
vital steps in porosity development in Gulf
of Suez carbonates. Other factors favouring
the development of high-porosity rocks
included; skeletal aragonite dissolution
coupled with late corrosion of anhydrite,
and fine grained sediments. The porosity of
Miocene carbonates could reach values
between 15% and 30% following deep bur-
ial, and associated fracturing and late disso-
lution of anhydrite cements, carbonate
grains and even, in some cases, the rock
matrix. The corrosive fluids capable of a
large-scale, late-stage dissolution were
probably associated with source rock mat-
uration or basinal shale compaction.
Dolomite mineralization develops
gradually (figure 1.8) and chemical
changes can halt the process at any
stage. Unfortunately, some of the major
fields (e.g. along the Shoab Ali Trend
and the Kareem Formation of the Zeit
Bay Field) contain chalky microporosity
and are only partly dolomitized. Marly-
shaly units, which overlie potential
reservoir zones, probably kept the
dolomitizing fluids out of the carbonate.
Modern dolomitization effects can be
seen in the Gulf of Suez (figure 1.9)
where freshwater from the surface and
from the basement mix with seawater.
7. Middle East Well Evaluation Review
Dolomite close up
At any given depth, dolomite
sequences seem to have
greater porosity than a lime-
stone sequence. Most of this
porosity difference is due to
‘porosity retention’ in the
dolomite.
The factors which encourage dolomi-
tization are reduced sulphate content in
seawater (which typically occurs during
gypsum and anhydrite precipitation);
dilution of seawater where the ionic con-
centration is lowered while the molar
Mg:Ca ratio is maintained; raising of the
Mg:Ca ratio by evaporation; and temper-
ature increases during burial. Climate is
a factor, since dolomitization commonly
occurs in arid depositional systems. Sea
level fluctuations also mix fresh water
and marine fluids in subsurface pore sys-
tems - another cause of dolomitization.
Studies in the Khuff, Arab and Asmari
formations and in Miocene carbonates
from the Gulf of Suez, indicate that all of
the factors mentioned above played a
part at some stage in the development of
dolomite in these major reservoirs.
In most Cretaceous reservoirs the
dominant factors were groundwater and
seawater mixing.
Pleistocene sea level fluctuations in
the Gulf of Suez and Red Sea are believed
to be the main factors in stratigraphic
variations of reef dolomites, although the
climate and tectonics of any area will
always influence dolomite mineralization.
Age dating of dolomitized sequences
indicates that major cycles of dolomite
development correlate well with the
100,000 year cycle of eccentricity in the
Earth’s orbit (Milankovitch cycles). This
eccentricity affects the amount of solar
radiation reaching the Earth and, therefore,
has a profound effect on global climate. Cli-
matic variations may, in turn, control
dolomite development. The smaller
sequences which comprise the individual
reef sequences are believed to be con-
trolled by sea level fluctuations every
21,000years, a cycle which relates to move-
ment of the Earth’s axis. These smaller
depositional sequences have reefal and
lagoonal facies which represent transgres-
sive stages and coral rubble and siliciclas-
tics associated with sea level highstands.
At the southern end of Sinai, around
Sharm el Sheikh, studies of Pleistocene
and younger reefs by Andre Strasser et
al. (1992) underline the importance of
seawater and groundwater mixing in the
dolomitization of the reefs and associ-
ated sediments (figure 1.10).
The carbon and oxygen isotope val-
ues in the older (Pleistocene) reefs (fig-
ures 1.11 and 1.12) indicate a fresh water
influence on carbonate mineralization,
whereas the younger reef samples show
values typical of dolomite mineralization
in normal marine waters. Results from
the Sinai reefs resemble findings from
Pacific atolls and reefs in Latin America
where mixing zone dolomitization is the
most important mechanism.
However, evidence for other mecha-
nisms has emerged recently. Thermal
pumping - hot water rising from depth to
mix with seawater is the focus of current
research - while small-scale seawater
fluctuations, such as tides, may also pro-
mote dolomite mineralization.
ThisimageandthoseoppositewereprovidedbyAndreStrasser,InstitutofGeology,UniversityofFribourg,Switzerland.
Fig. 1.10: Pointed aragonite crystals growing into pore space in the younger reef, Red Sea, southern end of the Sinai Peninsula.
Andre Strasser et al. (1992): Sequential Evolution and
Diagenesis of Pleistocene Coral Reefs (South Sinai, Egypt).
Sedimentary Geology, 78, pp.59-79.
8. Number 15, 1994.
Fig. 1.11 (above): This Scanning Electron Microscope (SEM) image shows rhombs of dolomite growing over crystals of calcite which contain high
concentrations of magnesium. This rock is from the Pleistocene (older) reef.
Fig. 1.12 (below): Dolomite and high-magnesium calcite crystals are invaded by small needle-like crystals of aragonite. This change in the older reef
is in response to changing water compositions as seawater and groundwater mix.
9. Middle East Well Evaluation Review16
2400
2425
2450
2475
2500
2525
2550
2575
2600
2625
Depthft
0 25 50 75 100 0 25 50
Permeability
(md)
Block calcite cement
(%)
Fig. 1.13: NOW YOU
SEE IT, NOW YOU
DON'T: Permeability
comes and goes in
Kirkuk Field, Iraq. This
plot of dolomite layers
shows that the zones of
low permeability in the
sequence correlate with
layers where late stage
calcite cements have
developed. It is difficult
to reconcile the
presence of this calcite
cement with burial
diagenesis. Fresh water
lenses preserved in the
sediment seem the
most likely cause of
this patchy calcite
cementation.
Developing dolomite
In the Cretaceous and Tertiary rocks of
the Middle East there is patchy develop-
ment of algal and foraminiferal lime-
stone, with some coral and associated
detrital limestones. These were not con-
nected with true fringing reefs, barrier
reefs or reef banks. Some modern exam-
ples can be seen in The Gulf today.
F.R.S. Henson, in his 1950 AAPG
paper, suggested the term ‘reef-shoals’
for these small reefs which lack rigid
fore-reef walls. He also recognized that
there were massive rudist accumulations
making up banks which he observed out-
cropping in north east Iraq (Upper Creta-
ceous between Bekhme Gorge and Aqra,
and Late Middle Cretaceous at Pir-i-
Mugrun). Dolomite mineralization devel-
oped in a variety of tectonic settings in
northern Iraq and in Syria (figure 1.12).
The Shuaiba reef of Bu Hasa Field in
Abu Dhabi may be a rudist bank, but
Ibrahim Marzouk, Supervisor of Reser-
voir Geology at the Abu Dhabi National
Oil Company (ADNOC), has indicated
that wrench faulting may have affected
the topography of the reef buildup.
Opportunities in Oman
Occidental has recently announced the
discovery of a Lower Cretaceous reser-
voir in northwest Oman, near the flank of
the Middle Cretaceous high situated west
of Safah Field. This should lead to a re-
evaluation of this reef-bearing region.
Reef facies were deposited around
the Kirkuk Field during both the early
Cretaceous and the Oligocene, along
with Eocene nummulitic shoals. The min-
eralogy of the reef facies was originally
calcite (limestone) but many zones were
later dolomitized. Recent studies indicate
that dolomitization of the Eocene bank
was related to falling sea level. This
occurred before development of the
major unconformity which precedes
deposition of the Fars evaporites.
Fig. 1.14: The porosity and
permeability of dolomite
(green) and limestone
(blue) samples from the
core indicate a close
relationship between these
properties. The graph
shows two dolomite
trends. One (a) follows the
limestone trend, showing
that dolomitization had
little effect on the pore
system. The second trend
(b) indicates that
dolomitization led to a
higher permeability for a
given porosity. In this case
the leaching associated
with dolomite
mineralization has
improved pore system
connectivity. This core
data is taken from the
Cretaceous sequence
shown in figure 1.16.
0
Core porosity (pu)
10 20 30 40
0.01
.01
1
10
100
1000
10000
Corepermeability(md)
(a)
(b)
Sea Level
Evaporites &
associated deposits
Globigerinal chalks,
marls & limestone
Reef, back-reef &
fore-reef limestones
Sublittoral shales &
marls
Sands,
conglomerates, etc.
Tectonic sink A (Graben at depth)
}
}
}
B
C
Barrier or
fringing reef
Submerged high
with bank reef
Submerged high
with disconformity
A......Deposited horizontally before uplift
B......Deposited during and after uplift
C......Deposited during subsidence
Fig: 1.12: Dolomites developed in a variety of tectonic settings in Syria and northern Iraq.
10. Number 15, 1994. 17
Fig. 1.15: Dolomite - related porosity
typically develops in one of two
ways. In the early stages individual
dolomite crystals appear in the
limestone matrix (a). Dolomite
mineralization continues until
individual crystals come into
contact (b), and a framework may
emerge (c). Alternatively, chemical
changes may favour the dissolution
of the dolomite crystals and the
rock may develop leached mouldic
porosity (d). If dolomite
mineralization continues, the
dolomite framework may prove
more durable than the limestone
host. Dissolution of the limestone
leaves a dolomite framework with
inter-crystalline porosity (e).
(a)
(b)
(c) (d)
(e)
Fig. 1.16: Mineral analysis of this
Cretaceous carbonate reservoir in
the Emirates used geochemical
data collected by a Geochemical
Logging tool (GLT). The best
porosity is found in the lower part
of the sequence, but the high
permeability values correlate with
dolomitization.
Core mineralogy, isotopic variations
and rock examinations suggest there
may have been seven stratigraphic dis-
continuities caused by sea level fluctua-
tions. Detailed mineral analysis indicates
that cementation variations from one sea
level fluctuation to the next account for
the permeability variations found in the
sequence. Changing sea level also
resulted in the development of calcite
cementation following the dolomitization
phase. The best permeability is found in
dolomite intervals where blocky mete-
oric calcite cements have not developed.
Data from the Kirkuk Field in northern
Iraq (figure 1.13) shows this clearly.
Dolomitization can have a very pro-
found influence on permeability and
porosity (figure 1.14). This makes a clear
understanding of the process crucial to
reservoir development. Dolomitization is
a complex process and dolomite-related
porosity can develop in two ways (figure
1.15). Dolomite crystals appear in the
limestone matrix and, as dolomitization
continues, may coalesce to form a frame-
work. At this stage chemical changes can
dissolve the dolomite leaving leached
porosity, or may dissolve the remaining
limestone, producing inter-granular
porosity and high permeability in a pure
dolomite rock.
Studies from around the Middle East
show that dolomites retain their porosity
longer than interbedded or associated
limestones. There are a number of rea-
sons for this, perhaps the most important
being less physical and chemical com-
paction and reduced cementation associ-
ated with dolomites. In mixed carbonate
sequences dolomites often show the
highest permeability values (figure 1.16).
However, shallow dolomite reservoirs
with relatively high porosity values can
have lower permeabilities than grain-
stones with similar porosities.
Susan Herron et al. (1992), Geochemical Logging of a
Middle East Carbonate Reservoir. Jour. Pet. Tech.
November 1992.
Oil
Moved Hydrocarbon
Secondary Porosity
Core permeability
Permeability
(Core)
0.01 (md) 10000
Water
Calcite
Dolomite
SPI
0 (PU) 50
x200ft
x300 ft
11. Middle East Well Evaluation Review18
Subtle traps revealed in
the Middle East
Most of the giant anticlines and large
reef reservoir bodies in the Middle East
have been surveyed and drilled. New
reef and carbonate shoal reservoirs are
likely to be smaller than those in exist-
ing fields, and will only be found
through careful processing and
informed interpretation of 3D seismic
surveys. In The Gulf region, many Creta-
ceous reservoir zones are not dolomi-
tized. Consequently, depositional char-
acteristics are the most important factor
in understanding oil and gas accumula-
tions. Seismic surveys are therefore
being evaluated for depositional charac-
teristics as well as reservoir structure.
A team of seismic experts from Geco-
Prakla/GeoQuest recently summarized
an integrated seismic processing strat-
egy which can be applied in carbonate
exploration and reservoir characteriza-
tion. Figure 1.17 (a to c) shows their
work on a prograding carbonate plat-
form and aggrading shoals similar to
those seen in northern Iraq and Syria
and northern and eastern Arabia. The
first step (figure 1.17a) is a preliminary
interpretation of the structure, seismic
sequence analysis and interpretation of
depositional facies. The next stage (fig-
ure 1.17b) produces a complete inter-
pretation of depositional environment,
using all available data from systems
tracks and depositional sequences. In
the third and final stage (figure 1.17c),
synthetic modelling is carried out to
check the interpretation and to give an
indication of the geophysical risk factors
in the area.
Risk evaluation is a vital step in new
exploration areas where the seismic,
structural and depositional interpreta-
tions are usually based on limited
datasets.
Fig. 1.17: STEP BY STEP:
After preliminary
interpretation had been
carried out (a) the
interpreters brought together
all existing data from system
tracks and sequences to
present an integrated picture
of the reservoir (b). This was
checked and the potential
risks for development
assessed (c) before any
major production
commitment was made.
(a)
(b)
(c)
Klaus Fischer et al. (1993) Remarks on Exploration Tools:
Integrated Exploration Strategy being applied to Carbonate
Environments. SPE Middle East Oil Show.
Basin
Shelf interior / marginal mounds
Shelf interior
Slope upper ramp
1.6 sec
1.8 sec
2.0 sec
2.2 sec
2.4 sec
2.0 sec
1.9 sec
5000 m 10000 m
12. Number 15, 1994. 19
MarkElliott,GeoQuest,London
ChristopheM.
RUDISTS, REEFS AND RESERVOIRS
During the Cretaceous an aberrant
group of large bivalves, the rudists,
moved into the reef environment.
These particular organisms filled the
high-energy shoal so successfully that
many geologists think of rudists as
reef builders.
For 40M years rudists dominated
the tops of shoaling highs and the
edges of carbonate platforms. These
unusual bivalves have one long cylin-
drical valve hinged with a flat ‘lid’
(figure 1.18). Rudists, like recent
bivalves, filtered seawater for food.
The elongate valve helped keep the
rudist’s feeding mechanism high
above the sediment-rich layer which
would have clogged their food gath-
ering system. This adaptation
allowed them to feed almost continu-
ously, stopping only when very
strong currents lifted muddy sedi-
ment from the sea floor.
Rudists did not replace corals
completely, they simply took over
part of the environmental niche
which corals had exploited in the
past. As rudists moved into the envi-
ronments where corals had been less
successful, their shape evolved to
overcome the soft mud problems
which had faced the corals.
The hippuritids and radiotitids
formed the most striking of all in-
place rudist congregations, with indi-
viduals sometimes so densely
packed together that they resembled
colonial organisms (figure 1.19). These
dense clusters were most common in
quieter water. In high energy facies, the
caprinids were dominant.
The best reservoirs in the Creta-
ceous are typically carbonate sand
grainstones or rudist shallow-marine
carbonate deposits. Of the latter, the
most significant are the Middle Creta-
ceous rudist facies which form banks,
thickets and biostroms (fossil rich lay-
ers). The rudists did not build reefs, nor
did they form large bioherms, but they
are a vital component of many Creta-
ceous reservoir rocks.
The best rudist reservoir facies are
those which contain a high proportion
of skeletal aragonite (from Caprinid)
shells. The leaching (dissolution and
removal) of aragonite, an unstable car-
bonate, has produced important, sec-
ondary porosity in the form of large
‘vugs’ or cavities in the limestone. The
reservoir potential of a horizon is often
enhanced if the aragonite intervals were
subaerially exposed after deposition.
Increased porosity related to this type
of exposure can be seen in the Natih
reservoir, in Oman. The leaching associ-
ated with fresh water lenses during sub-
aerial exposure is often high in the car-
bonate reservoir, but not necessarily at
the very top of the sequence.
Fig. 1.18: IDENTITY CRISIS: It looks like a
coral, but it's a bivalve. Rudists grew one long
valve to keep their filter feeding mechanism
clear of muddy sediments.
Fig. 1.19: FAMILY TREE: The rudists, unlike
corals, were not colonial organisms. However,
they normally crowded together to form
mounds, with successive generations building
on top of their parents.
13. Middle East Well Evaluation Review20
Fig. 1.20: This seismic line shows the facies changes which occur across the platform edge and into the basin. The sedimentary lobes
developed during the High Stand Systems Tract (HST) of the Natih ‘e’ Member are remarkably clear on this seismic section. During this
period of high and stable sea level sediment was prograding from the NE towards the SW. This sedimentation was terminated by a sea level
drop, creating a sequence boundary (SB).
Pictures of the prospect*
Explorationists often have to deal with
very complex sedimentological and
structural problems in prospective areas.
Their aim is to understand the detail of
reservoir variations, while drawing all of
the information together into a compre-
hensive picture of reservoir develop-
ment and overall hydrocarbon potential.
Petroleum Development Oman (PDO)
carried out an evaluation study of the
Sirat structure, making use of sequence
stratigraphic techniques.
The Sirat Prospect, in the Natih For-
mation of Oman, has been the focus of
intensive seismic and geological model-
ling. This formation consists of stacked
limestone cycles separated by relatively
thin shaly beds. The depositional envi-
ronment of the Natih Formation has var-
ied from deep water shales, with charac-
teristic marine fossils such as ostracods
and planktonic foraminifera, to very shal-
low marine packstones, grainstones and
rudstones with abundant larger
foraminifera and rudists.
In the upper part of the Natih‘e’ Mem-
ber a number of sedimentary lobes
developed (figure 1.20). These pro-
graded from the shallowest parts of the
shelf, building out to deeper water at the
edge of the shelf. Maximum water depth
during this progradation was probably
no more than 100m.
Each lobe contains a cycle of rock
types changing from deep water
deposits at the base to shallow sedi-
ments at the top.
Sequence stratigraphy attempts to
classify sediments and sedimentary
packages by their relationships to
changing sea levels (rise, fall, rate of
change) for local and worldwide (eusta-
tic) changes. This allows us to define dif-
ferent packages or sequences consist-
ing of a Transgressive Systems Tract
(TST), a Highstand Systems Tract (HST)
and, in deeper areas, a Lowstand Sys-
tems Tract (LST). Sequences are sepa-
rated by sequence boundaries (SBs)
created by sea-level fall. During times of
maximum rate of sea-level rise, a Maxi-
mum Flooding Surface (MFS) is
deposited. Sequences with their sys-
tems tracts and surfaces can all be recog-
nized on seismic lines, giving vital clues
to the structure and likely composition
of sediments. Micropalaeontology pro-
vides important, additional information
about the sequences.
Sequences are ranked, according to
their importance and the type of
changes which they represent. The 1st-
order sequence boundary is more
important than a 2nd-order boundary
and so on.
The cyclic response from the
Gamma-Ray log has been used to define
two 2nd-order sequences (Sequence I
and II) and a number of smaller 3rd-
order sequences (figure 1.21). The top of
the Natih‘e’ Member is identified as an
important sequence boundary. The
shorter period cyclicity defines the vari-
ous members (a - g) which constitute the
Natih Formation. In shallow areas only
the TST and the HST are present. In the
basin at the southwestern end of the
seismic section (figures 1.20 and 1.21) a
LST developed.
*Taken from: - Sequence Stratigraphy and Hydrocarbon
Habitat of the Natih Formation in Oman. Presented by Wytse
Sikkema (Petroleum Development Oman) at the 1993 AAPG
International Conference, The Hague, The Netherlands.
SW NE
14. Number 15, 1994. 21
Fig.1.21: Sequence stratigraphic analysis of the area revealed two 2nd-order sequences (Sequence I and Sequence II) and a number of
3rd-order sequences. Two maximum flooding surfaces have been identified and the top of the ‘e’ Member is an important sequence
boundary. By correlating seismic lines with this analytical approach to sedimentary structures, experts can assess the structural history of
the area and determine the risks associated with any given prospect.
The sequence stratigraphic recon-
struction has a number of implications
for the prospectivity of the Sirat struc-
ture. The prograding lobes of Sequence I,
as seen on the seismic section, contain
excellent reservoirs. Porosity and reser-
voir permeability were enhanced by the
exposure of the sediments which
occurred during low sea level phases.
This reservoir quality, coupled with the
clear images available using seismic
technology, suggest that this would be an
excellent prospect. However the sedi-
ments at the top of the Natih ‘e’ level
were deposited in a shallow environ-
ment and are of poor sealing quality,
thereby downgrading the prospect.
LST deposits are present but will
probably be low value reservoirs. These
sediments normally contain a high pro-
portion of fine clastic sediment which
would reduce porosity. In addition, the
absence of rudist fragments suggests that
initial porosity was low.
Three important reflectors relating to
the sequence stratigraphy can be seen
on the seismic line:
• the maximum flooding surface of
Sequence I (basal ‘e’ Member)
• the sequence boundary between I and
II (near top of ‘e’ Member)
• the maximum flooding surface of
Sequence II.
The seismic view
Explorationists integrated seismic lines
with well data in the sequence strati-
graphic model, to reconstruct the depo-
sitional environment of the Sirat
Prospect.
• Deep water sediments occur around
the maximum flooding surface. The rela-
tively deep limestone-shale alternations
are represented by a ‘reflective’ seismic
facies containing a number of continu-
ous, high-amplitude reflectors.
• The rudist accumulations are some-
times visible as high-amplitude discon-
tinuous reflectors.
• Thick deposits of shallow marine car-
bonates appear as low amplitude ‘trans-
parent’ seismic facies.
The study concluded that despite
the excellent reservoir qualities of the
HST lobes, the limited sealing capacity
of overlying sediments made develop-
ment of the Sirat Prospect a high-risk
project. A further conclusion from the
study was that sequence stratigraphic
methods could be used to reconstruct
the detailed sedimentary history of the
area and to predict the character of the
rocks in the sequence.
x300m
x500m
x500m
x300m
SB
mfs
mfs
15. Middle East Well Evaluation Review22
Cyclic sequences
The Middle Cretaceous is one of the
main hydrocarbon producing horizons
in Oman and offshore Dubai. Sediments
such as the Middle Cretaceous Natih
Formation were part of a Mesozoic plat-
form carbonate succession, accumulat-
ing around intrashelf depressions on the
eastern edge of the Arabian peninsula.
To the north west, in the Emirates, the
equivalent reservoir rocks are known as
the Mishrif Formation (figure 1.22). Elf
has recently discovered oil in the same
formation offshore Qatar.
The Natih limestones are separated
from the deeper Shuaiba reservoir car-
bonates by the Nahr Umr Shale. This,
and the Fiqa Shale which overlies the
Natih Formation, act as regional seals.
The Natih Formation is cyclic, com-
prising a succession of coarsening-
upward sequences. Each cycle consists
of deep marine shales and mudstones
grading up to shallow marine rudist
packstones and grainstones. Emergence
surfaces occur at the top of each cycle.
The cyclic sequence was caused by
eustatic sea level changes, although it
appears that deposition of the Natih For-
mation was halted by tectonic uplift.
Away from the local highs, typified
by shallow water deposits, the lime-
stones interfinger with two deeper
marine shales. These have significant
organic content and a rich fauna of
planktonic foraminifera. The cycles have
formed the basis of a scheme of subdivi-
sions (members labelled ‘a’ to ‘g’) for
the Natih Formation.
Regional uplift during the Jurassic
effectively reduced average sea level
and led to the deposition of evaporites
over much of the Arabian carbonate
platform. In some areas uplift raised the
sediment above sea level and there is
evidence of subaerial erosion. Compres-
sion, as the Arabian and Eurasian plates
were forced together, caused rapid sub-
sidence along the plate boundaries. This
was followed by the spread of transgres-
sive seas across the Arabian platform
(figure 1.23).
On two more occasions during the
Cretaceous, uplift pushed topographic
highs to a position where they were
eroded. Both phases were followed by
rapid subsidence and shale deposition.
The transgressive seas which developed
after these events became areas of
deposition for the three main carbonate
megasequences which cover
northeastern Arabia namely; the
Thamama/Kahmah, Wasia and Aruma
groups. Each megasequence contains
NW SEDubai Oman
70
80
90
100
110
Million
Years
?
?
Simsima
Shuaiba
Fiqa shale
Juweiza
Muti
Halul-Ilam
Laffan
Mishrif
Khatiyah
Ahmadi
Mauddud
Nahr Umr
shale
a
c
b
e
f
g
ArumagroupWasiagroup
UpperLower
Cretaceous
Natih
Eroded
Eroded
??
?
?
?
Middle
Fig. 1.22: TIME
ZONES: The study
of rudist
assemblages and
the discovery of
ammonites within
the Natih Formation
have provided a
precise correlation
of time lines within
the sequence.
Correlation
between outcrop
sections allowed
explorationists to
develop a
conceptual
sequence
stratigraphic model
which includes the
subdivisions
(‘a’ to ‘g’) used in
subsurface studies.
Fig. 1.23: PRIME SITES: The best locations
for rudist buildups were in the shelf setting
as shown in this Middle Cretaceous map of
The Gulf area.
numerous depositional cycles (3rd-
order or parasequences) related to
small-scale sea level fluctuations.
Understanding the cycles, and defin-
ing which areas were most suitable for
reef and shoal development, is an essen-
tial part of the interpretation. These
depositional factors control the nature
and location of the Cretaceous carbon-
ate reservoirs.
The best reservoirs are generally
found in the upper part of each megase-
quence. This is due to upward shallow-
ing, the abundance of coarse grain car-
bonate particles, leaching caused by
subaerial exposure and the presence of
particularly effective seals immediately
above the uppermost carbonate units in
each megasequence.
Modern
coastline
Basin
Shelf
16. Number 15, 1994. 23
Fig. 1.24: Typical mottled fabric of the Upper
Cretaceous Ilam carbonate reservoir facies
revealed by FMI imagery and in core (inset) from
Fateh Field.
Fig. 1.27: Karst surfaces seen in borehole images
and core within the Mishrif reservoir provide
clear evidence of repeated subaerial exposure.
Fig. 1.26: Electrical imagery and equivalent Mishrif
Reservoir core sample (inset) of a rudist shoaling
buildup in Fateh Field. An arrow indicates the seal
mark of the MDT pressure probe, the tool used to
define reservoir pressure and permeability. A stylolite
seam can be seen just beneath the seal mark.
Fig. 1.25: FMI image and core interval (inset) of
the unconformable contact at the top of the
Middle Cretaceous Mishrif reservoir. This unit is
overlain by Upper Cretaceous Laffan Shale.
Mishrif reservoirs
Rudist reefal-shoaling deposits com-
prising the Cretaceous Mishrif Forma-
tion, which is partially equivalent to
the Natih Formations of Oman, are the
major reservoirs in many fields in
Dubai and eastern Abu Dhabi. The
domal Fateh Field is the largest off-
shore Mishrif-age field in the Emirates.
It was discovered in 1966, despite the
absence of Mishrif rocks from the dis-
covery well - the result of pronounced
post-Cenomanian erosion on the crest
of the structure. Typical structures and
fabrics from wells in Fateh Field are
shown in figures 1.24 to 1.27.
Other fields in the region, including
the Shah Field in Abu Dhabi and the
Awali Field in Bahrain, are character-
ized by erosion of Mishrif and equiva-
lent rocks.
Fluid inclusion data, maturation cal-
culations and burial history modelling
indicate that cementation by blocky
calcite crystals and oil migration hap-
pened about the same time, between the
Late Miocene and Early Eocene. The
Khatiyah Shale, which lies directly
beneath the Mishrif, is believed to be the
major source rock for these reservoirs.
A number of depositional cycles,
locally bounded by erosional uncon-
formities, have been identified by geol-
ogists of the Dubai Petroleum Com-
pany. These unconformities are
believed to have been caused by
global sea-level fluctuations and uplift
of the deep, Eocambrian Hormuz Salt.
The combination of sea level fall
and uplift probably led to the develop-
ment of new, tectonically-controlled
islands and erosion of these structures.
Anticlinal fold belts and deep-seated
salt deposits were raised to the surface
of the Cretaceous sea which covered
much of the Middle East. Having
reached the surface, they were sub-
jected to the mixing of fresh water and
marine water. The results of this mix-
ing process can be seen along the
mountain fronts from Turkey to Oman.
Subsequent transgression over the
subaerially exposed islands was asso-
ciated with deposition of the Laffan
Shales which seals the Mishrif and
other, slightly younger, Cretaceous
reservoirs.
x043.0 ft
x047.0 ft
x317.0 ft
x324.0 ft
x343.0 ft
x340.0 ft
17. Middle East Well Evaluation Review24
Evaluating variation
Examination of drill cuttings, core and
well logs reveals the vertical variation in
carbonate reservoir sequences. Inte-
grated studies of reservoir behaviour,
particularly when these involve major
waterflood projects, highlight the lateral
variations present in all reservoirs. In
some giant and supergiant reservoirs
understanding the lateral variations has
not been a priority. These variations
were not considered a problem since the
flow rates were outstandingly high and
standard porosity well logs suggested lat-
eral variations were not significant.
In addition to the hidden complexities
in some major reservoir zones, there are
many zones with lower reservoir poten-
tial, whose development has been
delayed until now. These include chalky,
high-porosity but low-permeability zones
such as the Hanifa and certain Thamama
reservoirs. These zones must be
appraised carefully and new techniques
have emerged to meet the challenge.
Recent 3D seismic surveys have indi-
cated many more faults than previously
seen, and 3D borehole imagery in highly
deviated and horizontal wells is providing
a wealth of fracture data.
The role of fractures, either helping or
hindering oil production, has been exam-
ined in detail (Middle East Well Evaluation
Review, Number 14) and this knowledge
can be applied where fracturing affects
the reservoir zones. Careful interpretation
and integration of results indicates that
many of the simple structures mapped
over Gulf salt domes and in fold-belt anti-
clinal reservoirs are actually more compli-
cated than early models suggested. On a
more positive note, better models of com-
plex structures should reveal oil-filled
reservoir compartments and reservoir
facies on the flanks of existing fields. This
will offer new exploration opportunities.
1600
1200
800
400
0
0.01 0.1 1 10 100
Pore area (cm2)
Frequency
Fig. 1.28:
UP THE
WALL:
Canadian
reef wall
containing
moulds of
leached
stromatopo-
roids. The
size
analysis
summary is
shown in
figure 1.29.
Fig. 1.29: VUGS AND MOULDS: Pore size
frequency distribution measured from large
area photos of reef. Blue areas indicate the
number of whole vugs while the green
shows the number of edge vugs.
(From McNamara et al. 1991).
R. Ehrlich (1971) Relative permeability characteristics of
vugular cores - their measurement and significance.
SPE Annual Meeting Paper 3553.
Once a reservoir engineer has char-
acterized total reserves or storage capac-
ity in a reservoir, the emphasis switches
to production. Well logging and core
evaluation often provide sufficient data
to determine the porosity of carbonate
reservoirs. The next step is to analyse
vertical and lateral variations in perme-
ability. This type of information, pre-
sented as an integrated model of perme-
ability distribution, is essential for effi-
cient production. However, secondary
porosity in carbonate rocks complicates
this modelling process.
First stop - secondary porosity
Secondary porosity is not of secondary
importance in reservoirs. In fact this type of
porosity, created after the reservoir rock
has been buried, has often proved the most
difficult to quantify and the most important
for reservoir development.
Secondary porosity has caused prob-
lems in the majority of carbonate reser-
voirs. Even the biggest grainstone reser-
voirs, with intergranular porosity similar to
that found in sandstone, can exhibit a sur-
prising range of secondary porosity. This is
often developed in the form of intercrys-
talline pores, vugs, moulds of leached shell
material and micropores which may be no
more than a few microns in diameter.
The abundance of micropores makes
carbonates difficult to evaluate accurately.
They are not visible to the naked eye, or
even under a standard microscope. The
very high magnifications possible with a
scanning electron microscope (SEM) are
usually necessary for accurate estimates of
secondary porosity. The size of the micro-
pores means they are generally filled with
non-moveable water, while larger pores in
the same rock contain varying proportions
of water and oil. Consequently, it is possi-
ble to produce oil, without water cut, from
a carbonate reservoir interval which con-
tains more than 50% water.
Many new techniques are available for
micropore imaging. Dielectric measure-
ments, nuclear magnetic resonance and
Stoneley wave sonic energy have been
introduced in recent years. At the same
time, computer modelling of 3D borehole
electrical imagery is improving the defini-
tion of large vugs and moulds which char-
acterize some reservoirs.
Going for the vugular
Carbonate research projects indicate that
evaluating porosity is difficult but deter-
mining permeability is impossible in the
presence of large vugs and moulds (figure
1.28) - even when whole diameter cores
are used. Ehrlich, in his studies of carbon-
ate permeability, concluded that no core
would be large enough to represent the
full extent of interconnection in the pore
system. Thus, whole diameter core or
analysis of 3D borehole images must be
verified using down hole well testing tech-
niques or drill stem tests. This approach is
the only way to improve our understand-
ing of large scale interconnectivty and pro-
ducibility in vuggy zones.
Recently, researchers (McNamara et al.
1991) at the University of Calgary, Canada
found that porosity defined by core analy-
sis alone could be 30 % lower than the
actual value (figure 1.29). However, such
errors in evaluating vuggy or mouldic
porosity are unavoidable in cases where
the size of the vugs is comparable with
core diameter.
18. P
ro
g
re
s
s
iv
e
s
o
lu
tio
n
Initial particle
Mould
Solution-enlarged
mould
Vug
Number 15, 1994. 25
Fig. 1.32: MAKING THE
MOULD (AND THE VUG):
When a particle, sedimentary
grain or organic fragment
dissolves from the
surrounding rock matrix it
leaves a mould. If dissolution
continues the original shape
of the mould is lost,
producing a vug.
Fig. 1.30: (above) Analysis of the
mould ‘population’ in a short section of
core can be carried out using the
Formation MicroScanner (FMS)* tool.
This example, from offshore Bombay,
India, shows a plot of vug size and
area, giving an indication of vug
density in the rock sample.
Fig. 1.31: (left) Concentrations of
coral/algal moulds and vugs in this
Tertiary coralgal boundstone from
offshore India have been revealed
and quantified using FMS imagery
and core by N.R. Devrajan and R.S.
Iyer of The Oil and Natural Gas
Commission of India.
Detecting vugs and moulds
The petroleum industry devotes a lot of
time to mould and vug evaluation (figures
1.30 and 1.31). However, strict definitions
of moulds and vugs are often ignored and
using the two terms synonymously can
lead to confusion.
Moulds are pores formed by the selec-
tive removal, normally by solution, of an
existing rock particle such as a shell frag-
ment, crystal or grain. The resulting poros-
ity is referred to as mouldic porosity and is
described according to the type of particle
removed; e.g. oomouldic for an oolitic rock
where ooids have been dissolved.
If the leaching of the original particle goes
beyond the point at which it can be identi-
fied the hole is a referred to as a vug (figure
1.32). The condition of the hole, not its size,
determines whether it is a mould or a vug.
The authors of the basic reference on
carbonate porosity, Philip Choquette and
Lloyd Pray, suggested that a vug which is
large enough to be examined from the
inside should be referred to as a cave.
They also defined micropores as those
which have a diameter or cross-section
which averages less than 1/16 mm
whether the pores are equidimensional,
platy or tabular.
The full capabilities of the Modular
Dynamic Tester (MDT)* tool include the
definition of vuggy reservoir zones which
cannot be characterized by core or bore-
hole imagery even when combined with
other well logs. Even the RFT tool has lim-
ited applications for vuggy intervals. Tests
often fail due to lack of seal or the pres-
ence of a tight patch resulting in a dry
test. Fractures in low porosity patches fur-
ther complicate the situation. However,
the MDT tool has inflatable packers which
can be placed above and below the vuggy
zone to isolate it. The zone can be defined
by FMI/FMS tools or core data.
While testing vuggy zones the MDT
tool can be configured to include a con-
ventional probe and an inflatable packer
module. The tool can then provide probe
measurements, and allows the operator to
use the inflatable packers when a seal is
not possible in the best fractured or
vuggy interval.
The MDT tool’s pumpout module can
be used for the dual packer approach
which often succeeds where RFT attempts
fail. Packer spacing can be set to match
the small intervals defined in FMI/FMS (or
UBI in oil-base muds) or core data, to a
minimum of 3ft. This minimum size actu-
ally provides a surface area thousands of
times greater than the standard RFT or
MDT probe. In this respect it can be
thought of as a small-scale DST-type test
which provides a pressure buildup with a
radius of investigation just under 100 ft
into the formation. This figure varies with
the pore system in the formation.
x752 ft
x753 ft
x751ft
x373.4 ft
x373.0 ft
19. Middle East Well Evaluation Review26
Evaluation of isolated zones is nor-
mally achieved by pressure tests. How-
ever fluid samples for evaluation can be
taken from vuggy zones or even low per-
meability or thin bed intervals. This ben-
efit is derived from the large seal and
sample area created by the dual pack-
ers. Tough sampling situations require
use of the MDT tool’s pumpout module,
fluid analyzer and sample throttling; an
approach which relies on the tool’s mod-
ular design.
Since pressure and fluid content read-
out is done at the surface, the test need
only continue until the formation fluid is
detected. This appears after the flow of
drilling fluid which invaded the forma-
tion has been pumped out. This type of
arrangement can replace the more
expensive drill stem test and offers a
high degree of safety. The MDT tool has
been used for production testing for
wells with high hydrogen sulphide (H2S)
concentrations.
Revealing reservoir permeability
Measured slowness, derived from low
frequency Stoneley waves, can be used
to evaluate the permeability of hydrocar-
bon reservoirs. At low frequencies the
Stoneley wave produces fluid flow which
is related to the connectivity of pore
space. By comparing observed slowness
with elastic slowness computed for a for-
mation with no fluids we can calculate
permeability (figure 1.33). Elastic slow-
ness is calculated using three factors which
have a direct effect on Stoneley wave prop-
agation- formation density, borehole fluid
density and shear slowness.
Stoneley attenuation provides an
alternative to permeability estimates
based on slowness. In permeable forma-
tions Stoneley waves are attenuated by
fluid moving in the pore space (figure
1.34) to a degree proportional to fluid
mobility in the formation. From this
value engineers can derive the quality
factor, Q (inverse attenuation), which is
directly related to reservoir permeabil-
ity. The calculation used to derive per-
meability from the quality factor
involves values for pore fluid and bulk
elastic moduli, and for porosity and
borehole diameter.
The technique was tested on a dataset
collected from a high porosity, pure car-
bonate reservoir in Saudi Arabia. The
slowness and attenuation techniques
were applied to data gathered using a
Dipole Shear Sonic Imager (DSI*) tool.
The predicted permeability was mod-
ified to simulate a synthetic flowmeter
profile. Agreement between slowness-
derived permeability and the flowmeter
profile was very good.
Squirting flow
Pore throat
to pore
Edge to centre
Crack lubrication
facilitating
friction
Biotic fluid flow
with boundary
shear
Fig. 1.34: SLOWING THE FLOW: There
are several mechanisms which
contribute to the attenuation of shear
waves. The lubricating effects of
liquids in cracks absorb energy. The
mechanisms involved are fluid flow
with boundary shear effects and
squirting flow (which occurs when
fluids are forced through narrow pore
throats between grains). By measuring
energy absorption we can estimate
rock permeability. From Johnston,
Toksoz and Timur (1978).
Fig. 1.33: Stoneley permeability values can be calibrated by RFT tool tests
and confirmed by core data where available. The MDT tool provides a
greater range of permeability than the RFT tool used here to calibrate the
Stoneley energy-derived permeability. The lithology/porosity/fluid column
is an ELAN-computed result.
x950ft
x000ft
x050ft
M. Petricola and B. Frignet (1992) A Synergetic Approach to
Fracture and Permeability Evaluation from Logs. 5th Abu
Dhabi Petroleum Conference.
D. Johnston, M. Toksoz and A.Timur (1978) Attenuation of
Seismic Waves in Dry and Saturated Rocks. Geophysics 44.
Permeability
(Core)
0.01 (md) 1000
Permeability
(Stoneley)
0.01 (md) 1000
Shear
Slowness
170 (us/f) 90
Stoneley
Slowness
250 (us/f) 200
Permeability
(RFT)
0.01 (md) 1000
• Thick deposits of shallow
marine carbonates appear as
low-amplitude ‘transparent’
seismic facies.
20. Number 15, 1994. 27
Imagery + Stoneley analysis + OH Logs Reservoir data for well testing strategy
and optimum MDT tool configuration
(FMI) (DSI) (ELAN)
(UBI) Lithology
(ARI) Porosity
Saturation
Permeability progress
Permeability measurements in carbon-
ate reservoirs present a major challenge
to well logging analysts. A group of
expert analysts and geophysicists in
Dubai, Abu Dhabi, Egypt, Saudi Arabia
and at the Oil and Natural Gas Commis-
sion (ONGC) - Schlumberger Joint
Research Council in India, have tested
carbonate reservoir permeability using
Stoneley wave data. Present efforts are
concentrated on sample analysis and
Stoneley frequency using the DSI tool
which samples at lower frequencies than
the earlier Array Sonic tool (figure 1.35).
The permeabilities found in shoaling
sequences, where coarse particles over-
lie fine chalky facies with micropore sys-
tems, have been characterized using the
DSI tool. The tool has also found suc-
cess in reservoirs where there are a
variety of secondary porosity types.
RFT tool permeability data can be
used to calibrate permeability profiles
defined by Stoneley wave data. In the
example, core permeability data from
one inch diameter plugs, taken at one
foot intervals, compare favourably with
the DSI tool and RFT tool profiles. How-
ever, in carbonate reservoirs where the
pore system is heterogeneous, the
match is often poor, despite accurate
permeability measurements.
This situation typically arises when
each measurement relates to a different
rock volume. Whole core analysis is
recommended for permeability charac-
terization in the heterogeneous pore
systems found in many carbonate
reservoirs.
The MDT tool has already succeeded
in defining pressure, permeability and
fluid content within complex carbonate
reservoirs in the Middle East. The tool’s
30
20
10
0
Stoneleyobserved-elastic(µs/ft)
0 1000 2000 3000 4000 5000
Frequency (Hz)
3000md1000md
300md
30md
10md
100md
Fig. 1.35: At low frequencies the Stoneley wave produces fluid flow
which is related to the connectivity of pore space (permeability). This
plot shows the sensitivity of Stoneley slowness to frequency - in the
range measured by the DSI tool - for a water-saturated sandstone.
From Cheung and Liu (1988).
Electric power
Pump-out
Sample
Optical analyzer
Hydraulic
Single probe
Packer
Fig. 1.36: The MDT
tool can define
pressure,
permeability and
fluid content within
complex carbonate
reservoirs. The tool’s
modular design
allows the operator
to select the optimum
configuration for
each task. The MDT
tool is reliable in
reservoirs, where
permeability ranges
from hundreds of
millidarcies to
hundredths of a
millidarcy.
Thin layered porosity
Interwoven porosity
Isolated non-porous
Fractured porosity
Shale barriers & baffles
Isolated porosity
Porosity
Non-porous (or low-porosity)
rock
Uniform high porosity
Layered porosity
Thin porous layers
Uniformly non-porous
Thin non-porous layers
modular design allows the operator to
select the optimum configuration for
each task (figure 1.36). The MDT tool is
reliable in challenging reservoirs, such
as those where permeability ranges from
hundreds of millidarcies to hundredths
of a millidarcy. To devise a high-quality
MDT tool test we require information
from several sources (e.g. electrical
imagery and Stoneley). Only by combin-
ing data from several sources can we be
sure of maximizing test efficiency.
Fig. 1.37: The main types of carbonate
porosity heterogeneity revealed by
borehole imagery.
Heterogeneities defined by imagery
21. Middle East Well Evaluation Review28
0
100
200
300
400
Time(Millionyears)
N
P
U
Cr
I
J
Tr
P
C
D
S
O
0.7070 0.7080 0.7100
(after BP 1992)
E.CretLateJurassicMiddleJurassicE.Jurassic
Valanginian
Barriasian
Tithonian
Kimmeridgian
Oxfordian
Callovian
Bathonian
Bajocian
Aalenian
Toarcian
Pliensbachian
145.6
152.1
154.7
157.1
161.3
166.1
173.5
178.0
187.0
194.5
Sr seawater curve for the Jurassic
(modified after Smalley et al, 1989)
87Sr/86Sr
0.7065 0.7070 0.7075Ma Age
87Sr/86Sr
0.7090
Ratio
Global seawater strontium curve
Fig. 1.38: NAME THE DATE: This simplified curve for global Sr isotope ratios in seawater illustrates
the principle of the isotopic dating methods. For a known 87Sr/86Sr ratio a vertical line can be
drawn. Wherever this line crosses the curve, the sample ratio matches the seawater ratio for that
particular time. However, some isotopic ratio values occur at two or more places in the curve.
When this happens age must be defined by alternative dating methods.
Fig. 1.39: This series of logs (a) from the Upper
Jurassic shows the Asab Oolite at well A.
Strontium isotope dating indicates that rocks of
the same age are also found in well B, but have
been lost from the sequence at well C to the
north east. The unconformable contact between
the Jurassic and Cretaceous beds in the third well
marks a period of erosion or non-deposition.
Core taken from this level (b) confirms the
unconformity.
Chemical timing
Geochemistry is finding new applica-
tions as a tool for explorationists and
reservoir analysts. A few years ago,
most geochemical surveys were
directed at identifying source rock. This
led to new applications in maturation
and migration studies. Today, laborato-
ries are using petroleum geochemistry
to tackle reservoir problems such as
assessing heterogeneity.
Geochemical methods include deter-
mining ‘biomarkers’ in a sequence and
then using isotopes to ‘fingerprint’ dif-
ferent oils present in a reservoir. Recent
studies have investigated hydrocarbon
variation within reservoirs and clarified
the extent of compartmentalization
caused by tar mats, shale barriers and
sealing faults. This data is vital in estab-
lishing models for development and
production phases.
Rock geochemistry is especially use-
ful where the reservoir rocks are not
composed of the usual quartz, lime-
stone or dolomite lithologies on which
log interpretations are based. Problems
can even arise where mixtures of these
basic lithologies are being investigated
for basic formation evaluation. This has
encouraged the spread of geochemical
well logging and core studies.
Well-to-well correlation can be
enhanced by applying geochemical tech-
niques to core or well log data. In this
way, we can identify geochemical varia-
tions in major lithologies or the presence
of minor minerals in adjacent wells.
Log analysts who routinely use the
lithology indications from density/neu-
tron variations in simple lithology mix-
tures are defining lithology by compar-
ing a single element, hydrogen, to the
bulk density of the formation. Interpre-
tations from geochemical logs are based
on much more information.
At present, the gamma ray log is most
widely used for correlation in carbonate
sequences: the elements identified are
uranium (U) thorium (Th) and carbon
(C). Geochemical logging analyses use a
further nine elements for correlation.
Ocean chemistry
Ocean chemistry influences the compo-
sition of minerals being deposited on the
sea floor. However, the chemical com-
position of the oceans varies through
time and these variations control min-
eral stability. Ocean chemistry is crucial
in determining the proportions of arago-
nite or calcite present on the sea bed
and, consequently, in the accumulated
sediment which reservoirs contain. This
proportion influences ultimate reservoir
porosity and permeability.
UpperJurassic
Lower
Cret.
SW A B C70km105km
Habshan
Fm
Hith
Equiv
Asab
Oolite
Lower
Asab
Rayda
Fm
AsabFormation
NE
(a)
Weighing the evidence
Isotopes are atoms of the same element
having different numbers of neutrons in
the nucleus and, therefore, different
atomic weights. The weight difference is
important, and useful, because natural
processes such as evaporation, conden-
sation and photosynthesis cause signifi-
cant variations in the distribution of iso-
topes within the various geochemical
cycles.
For example, the light oxygen iso-
tope, 1 6 O, is concentrated in
water vapour when seawater evapo-
rates. The 1 6O-enriched vapour
travels through the atmosphere towards
the poles where it condenses and is
incorporated in the polar ice sheets. The
differential evaporation of oxygen atoms
which occurs at the equator means that
the 1 8 O / 1 6 O ratio in
polar ice caps is much lower than in sea-
(b)
22. Number 15, 1994. 29
1330
Core data
after demagnetization
-50 0 50
Reverse Normal
Log data
NMRT SUMT
Normal
1335
1340
1345
Depth,m
Magnetic
colour
code Normal
Reverse
0 1 2-1-2
Normal
water at the equator.
These stable isotope ratios have varied
systematically over time and can, there-
fore, be used to date rock samples and
correlate sequences. The stable isotopic
ratios of strontium (Sr) and sulphur (S)
are used in chronostratigraphic studies,
confirming time gaps at unconformities
and determining sedimentation rates.
They can even be used to date diagenetic
events such as dolomitization.
The principle of strontium dating relies
on changes in 8 7 Sr / 8 6 Sr
through time and the assumption that the
ratio within seawater is uniform worldwide
at any given time. Seawater curves for
strontium ratios have been plotted and cal-
ibrated against the geological time scale
(figure 1.38). This was done by analyzing
the Sr isotope ratio in carbonate and phos-
phate from fossils of known ages.
Strontium dating, and correlations based
on strontium ratios, can be used when there
are few fossils and when biostratigraphic
zonation is poor. Independent of facies and
fossil occurrence, this technique can even
be used to date evaporite sequences.
Very small samples are required (as lit-
tle as 0.1 mg) to provide a reliable age,
with uncertainty normally being +/-1 mil-
lion years, or less. The technique can be
applied worldwide and, unlike fossil cor-
relations, is completely objective.
While the benefits of this technique are
obvious, there are some limitations.
Weathering affects all isotopic systems,
and Sr isotope ratios can be modified by
contamination from meteoric / mixing
zone diagenesis and burial cements.
Depending on the modifying mechanism,
the 8 7Sr/8 6Sr ratios can be
shifted towards values typical of younger,
or older, rocks. If unaltered carbonate
samples are not available for Sr isotope
studies then adjustments must be made to
account for sample impurities.
Brachiopods and belemnites, with
their low-magnesium calcite skeletons,
are little affected by diagenesis and the
best samples come from these and from
the phosphates which make up fish and
conodont fossils. Whole rock samples,
with the exception of anhydrites, usually
give less accurate dates since their
8 7 Sr/8 6 Sr values have fre-
quently been altered by diagenetic
processes.
The final problem occurs when one
8 7Sr/8 6Sr value corresponds
with two or more ages in the seawater
curve. Ratios recorded from rocks in the
Kimmeridgian have the same
8 7Sr/8 6Sr ratio as found in
Bajocian rocks which are 10 M years
older. This problem occurs on both large
and small scales throughout the geologi-
cal record. Isotope values recorded in the
Upper Permian can be identical to those
in Cretaceous rocks, although there is less
chance of confusion between these units.
Matching the isotope ratio to a position on
Fig. 1.40: POLE POSITION: Over geological time scales, the Earth's magnetic field switches polarity.
These changes are recorded in rock sequences. This forms the basis of a new logging tool which can
correlate polarity changes between wells, offering a high-resolution magnetic log. The magnetic
reversals shown here were revealed by combining data from the Nuclear Magnetic Resonance well
logging tool (NMRT*) with the induced field as measured by the Susceptibility Measurement tool
(SUMT*). Modified from Arnaud Etchecopar et al., Oilfield Review, October 1991.
the curve is normally a problem only if
the age of the sample layer is very
poorly constrained.
In 1991, the Abu Dhabi Company for
Onshore Oil Operations (ADCO) carried
out an isotopic pilot study to resolve
some of the uncertainties in Jurassic
stratigraphy. Early results were encourag-
ing and the study expanded. Today, the
database consists of Sr isotope analyses
from ooid grainstones, belemnites, lime
mudstones, anhydrites and bivalves.
Sr dating has provided evidence of a
direct stratigraphic correlation between
the pelagic transgressive belemnite lag
deposit and the unconformity (a type II
sequence boundary) of the Jurassic-Cre-
taceous contact and the intraclastic
belemnite horizon in the Asab Oolite (fig-
ure 1.39a and b). This type of geochemi-
cal correlation has helped to refine
regional stratigraphy. For example,
anhydrites which had been included in
the lowermost Cretaceous Habshan For-
mation, were re-assigned to the Upper
Jurassic while the Manifa Member
(150.5M years) was correlated with the
Asab Formation (151.2M years) and with
the lateral equivalent Qatar Formation
(150.5M years) using this technique.
A new logging technique (figure 1.40)
which relies on reversals of the Earth's
magnetic field through geological time,
has proved very successful for cross-
well correlation. Rocks can retain the
magnetization from previous magnetic
fields, a phenomenon called natural
remnant magnetism (NRM). The logging
techniques which record this magnetic
‘memory’ are very accurate and can be
used worldwide. Absolute age correla-
tions derived from reversals have been
made between three wells drilled by
Total in the Jurassic sediments of the