1. 2QFY2011Result Update |Infrastructure
October 18, 2010
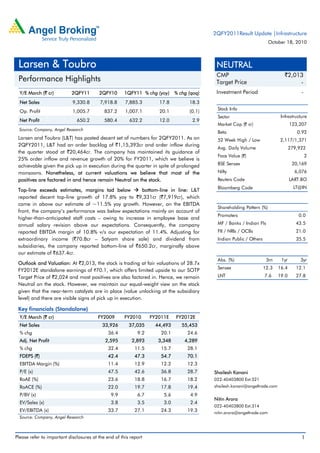
Larsen & Toubro NEUTRAL
CMP `2,013
Performance Highlights Target Price -
Y/E March (` cr) 2QFY11 2QFY10 1QFY11 % chg (yoy) % chg (qoq) Investment Period -
Net Sales 9,330.8 7,918.8 7,885.3 17.8 18.3
Stock Info
Op. Profit 1,005.7 837.2 1,007.1 20.1 (0.1)
Sector Infrastructure
Net Profit 650.2 580.4 632.2 12.0 2.9
Market Cap (` cr) 123,207
Source: Company, Angel Research
Beta 0.92
Larsen and Toubro (L&T) has posted decent set of numbers for 2QFY2011. As on 52 Week High / Low 2,117/1,371
2QFY2011, L&T had an order backlog of `1,15,393cr and order inflow during
Avg. Daily Volume 279,922
the quarter stood at `20,464cr. The company has maintained its guidance of
Face Value (`) 2
25% order inflow and revenue growth of 20% for FY2011, which we believe is
achievable given the pick up in execution during the quarter in spite of prolonged BSE Sensex 20,169
monsoons. Nonetheless, at current valuations we believe that most of the Nifty 6,076
positives are factored in and hence remain Neutral on the stock. Reuters Code LART.BO
Bloomberg Code LT@IN
Top-line exceeds estimates, margins tad below bottom-line in line: L&T
reported decent top-line growth of 17.8% yoy to `9,331cr (`7,919cr), which
came in above our estimate of ~11.5% yoy growth. However, on the EBITDA
Shareholding Pattern (%)
front, the company’s performance was below expectations mainly on account of
Promoters 0.0
higher-than-anticipated staff costs – owing to increase in employee base and
annual salary revision above our expectations. Consequently, the company MF / Banks / Indian Fls 43.5
reported EBITDA margin of 10.8% v/s our expectation of 11.4%. Adjusting for FII / NRIs / OCBs 21.0
extraordinary income (`70.8cr – Satyam share sale) and dividend from Indian Public / Others 35.5
subsidiaries, the company reported bottom-line of `650.2cr, marginally above
our estimate of `637.4cr.
Abs. (%) 3m 1yr 3yr
Outlook and Valuation: At `2,013, the stock is trading at fair valuations of 28.7x
Sensex 12.3 16.4 12.1
FY2012E standalone earnings of `70.1, which offers limited upside to our SOTP
Target Price of `2,024 and most positives are also factored in. Hence, we remain LNT 7.6 19.0 27.8
Neutral on the stock. However, we maintain our equal-weight view on the stock
given that the near-term catalysts are in place (value unlocking at the subsidiary
level) and there are visible signs of pick up in execution.
Key financials (Standalone)
Y/E March (` cr) FY2009 FY2010 FY2011E FY2012E
Net Sales 33,926 37,035 44,493 55,453
% chg 36.4 9.2 20.1 24.6
Adj. Net Profit 2,595 2,893 3,348 4,289
% chg 32.4 11.5 15.7 28.1
FDEPS (`) 42.4 47.3 54.7 70.1
EBITDA Margin (%) 11.4 12.9 12.2 12.3
P/E (x) 47.5 42.6 36.8 28.7 Shailesh Kanani
RoAE (%) 23.6 18.8 16.7 18.2 022-40403800 Ext:321
RoACE (%) 22.0 19.7 17.8 19.4 shailesh.kanani@angeltrade.com
P/BV (x) 9.9 6.7 5.6 4.9
Nitin Arora
EV/Sales (x) 3.8 3.5 3.0 2.4
022-40403800 Ext:314
EV/EBITDA (x) 33.7 27.1 24.3 19.3 nitin.arora@angeltrade.com
Source: Company, Angel Research
Please refer to important disclosures at the end of this report 1
3. Larsen & Toubro | 2QFY2011 Result Update
Top-line beats estimates – visible signs of pick up in execution: L&T reported
decent top-line growth of 17.8% yoy to `9,331cr (`7,919cr), which exceeded our
estimate of ~11.5% yoy growth, mainly on account of the pick up in the E&C
segment, which recorded 16.9% yoy growth in top-line to `8,015cr. The MIP
segment posted very good yoy top-line growth of ~37% led by increased off-take
in the industrial valves and mining and construction equipment business. However,
the E&E segment sales came in below expectations and posted a yoy de-growth of
~5%, mainly on account of deferment in engineered-to-order-business. Order
booking during the quarter stood at `20,464, up 11.4%.
Exhibit 4: 2QFY2011 top-line depicts pick up in execution Exhibit 5: Order booking as per expectations
16000 50.0 35,000 160.0
14000 39.8 30,000 139.5 140.0
40.0 120.0
12000 25,000 100.0
10000 35.0 28.1 17.8 30.0 80.0
25.3 20,000 65.2 47.5 63.3
8000 20.0 60.0
15,000 40.0
6000 10.0 10,000 23.4 20.0
4000 7.3 6.4 14.3 11.4 -
3.0 - 5,000 (16.9)
2000 (21.8) (20.0)
(5.7) - (40.0)
0 (10.0)
2QFY09
3QFY09
4QFY09
1QFY10
2QFY10
3QFY10
4QFY10
1QFY11
2QFY11
2QFY09
3QFY09
4QFY09
1QFY10
2QFY10
3QFY10
4QFY10
1QFY11
2QFY11
Sales (Rs cr, LHS) Growth (yoy %, RHS) Order Booking (Rs cr, LHS) Growth (yoy %, RHS)
Source: Company, Angel Research Source: Company, Angel Research
On the EBITDA front, the performance was below our expectations mainly on
account of the higher-than-anticipated staff cost – owing to increase in employee
base and annual salary revision which surpassed our expectations. Consequently,
the company reported EBITDA margin of 10.8% as against our expectation of
11.4%. Adjusting for extraordinary income (`70.8cr – Satyam share sale) and
dividend from subsidiaries, the company reported bottom-line of `650.2cr
marginally above our estimate of `637.4cr.
Exhibit 6: EBITDA trend Exhibit 7: Net profit trend
2,500 15.0 16.0 1600 12.0
15.1
12.3 14.0 1400 10.4 10.0 10.0
2,000
12.8 12.0 1200 8.8
11.2 10.0 1000 7.6 7.6 7.0 8.0
1,500 10.6 10.8
9.1 8.0 800 6.0 7.0 8.0 6.0
8.8
1,000 6.0 600 4.0
500 4.0 400
2.0 200 2.0
0 - 0 -
2QFY09
3QFY09
4QFY09
1QFY10
2QFY10
3QFY10
4QFY10
1QFY11
2QFY11
2QFY09
3QFY09
4QFY09
1QFY10
2QFY10
3QFY10
4QFY10
1QFY11
2QFY11
EBITDA (Rs cr, LHS) EBITDAM (%, RHS) PAT (Rs cr, LHS) PATM (%, RHS)
Source: Company, Angel Research Source: Company, Angel Research
October 18, 2010 3
4. Larsen & Toubro | 2QFY2011 Result Update
Subsidiary performance
L&T InfoTech registers decent performance
The technology subsidiary, L&T InfoTech, reported a decent performance for
2QFY2011 reporting 26.2% yoy and 4.1% qoq growth in revenues. On the
profitability front, the subsidiary reported NPM at 13.3%. For 1HFY2011, the
company recorded 22.7% yoy growth and 100bp improvement in NPM on the
back of effective cost controls and better utilisation.
The numbers of the finance subsidiaries were not announced given the SEBI norms
as the DRHP has been filed.
Exhibit 8: Subsidiary performance
2QFY11 2QFY10 1QFY11 % chg (yoy) % chg (qoq)
Revenues
L&T InfoTech 588.0 466.0 565.0 26.2 4.1
PAT
L&T InfoTech 78.0 57.0 79.0 36.8 (1.3)
Source: Company, Angel Research
Order book analysis
L&T registered robust order inflow of `20,464cr during 2QFY2011 mainly on
account of the power segment, which contributed 43% of the overall order inflow.
Orders to the tune of ~94% for the 1HFY2011 came from the local market, taking
the company’s outstanding order book to `1,15,393cr. L&T’s order book is
majorly dominated by the power (37%) and infrastructure (31%) segments. Process
(12%), hydrocarbon (15%) and others (5%) constitute the balance part of the order
book. Export orders however, disappointed and the share of export orders
declined significantly from ~15-17% to ~5-6%, which is mainly due to slow
awarding activity in the Middle East. However, management has guided that the
scenario is improving and momentum should pick up in the coming quarters. The
company has maintained its yearly order booking guidance of 25%, which we
believe is achievable given strong traction in the power and infrastructure
segments.
Exhibit 9: Quarterly sectoral order inflow trend (` cr) Exhibit 10: Quarterly sectoral OB composition trend (` cr)
12,000 140,000
10,000 120,000
100,000
8,000
80,000
6,000 60,000
4,000 40,000
2,000 20,000
-
-
2QFY09
3QFY09
4QFY09
1QFY10
2QFY10
3QFY10
4QFY10
1QFY11
2QFY11
2QFY09
3QFY09
4QFY09
1QFY10
2QFY10
3QFY10
4QFY10
1QFY11
2QFY11
Process Hydrocarbon Power Infrastructure Others Process Hydrocarbon Power Infrastructure Others
Source: Company, Angel Research Source: Company, Angel Research
October 18, 2010 4
5. Larsen & Toubro | 2QFY2011 Result Update
Client-wise, 44% of the outstanding order book comes from the public sector, with
41% coming from the private sector, and the balance 15% make up the captive
work orders. Notably, there has been a drop in the share of public sector, which
management has cited as not being a concern and guided to see a revival in the
ensuing quarters.
Outlook and Valuation: Positives priced in at `2,013
The macro outlook for infrastructure in general, and the consequent benefits for
L&T in terms of order inflows in particular, remain strong. We believe that the
company will continue to occupy a unique position in the Indian engineering and
construction (E&C) space as a diversified and large engineering play, with
exposure to areas ranging from power to defence to nuclear to equipment.
Exhibit 11: Change in estimates
FY2011E FY2012E
Earlier Estimates Revised Estimates Variation % Earlier Estimates Revised Estimates Variation %
Revenues 44,047 44,493 1.0 55,519 55,453 (0.1)
EBITDA Margin 12.2 12.2 - 12.3 12.3 -
PAT 3,353 3,348 (0.1) 4,289 4,289 (0.0)
Source: Company, Angel Research
At the CMP of `2,013, the stock is trading at 28.7x FY2012E earnings and 4.9x
FY2012E P/BV, on a standalone basis. We have used the sum-of-the-parts (SOTP)
methodology to value the company to capture all its business initiatives and
investments/stakes in the different businesses. Ascribing separate values to its
parent business on a P/E basis and investments in subsidiaries on P/E, P/BV and
MCap basis, our fair value works out to `2,024, which provides limited upside
from current levels. Hence, we remain Neutral on the stock.
We maintain our equal-weight view on the stock given that the near-term catalysts
are in place (value unlocking at the subsidiary level) and there are visible signs of
pick up in execution. It may be noted here that the L&T stock has historically traded
at a premium to the BSE Sensex. At our SOTP Target Price, the stock would trade at
28.8x FY2012E standalone EPS of Rs70.1, which is at a premium of ~70% over
Angel’s FY2012E Sensex Target P/E multiple of 17x.
October 18, 2010 5
6. Larsen & Toubro | 2QFY2011 Result Update
Exhibit 12: L&T - Parent historic P/E multiple premium to BSE Sensex
160%
140%
120%
100%
80%
60%
40%
20%
0%
-20%
15-Jan-04
15-Jan-05
15-Jan-06
15-Jan-07
15-Jan-08
15-Jan-09
15-Jan-10
15-Apr-04
15-Apr-05
15-Apr-06
15-Apr-07
15-Apr-08
15-Apr-09
15-Apr-10
15-Jul-04
15-Jul-05
15-Jul-06
15-Jul-07
15-Jul-08
15-Jul-09
15-Jul-10
15-Oct-03
15-Oct-04
15-Oct-05
15-Oct-06
15-Oct-07
15-Oct-08
15-Oct-09
15-Oct-10
-40%
-60%
L&T Premium/(Discount) to Sensex 7YEAR AVG 5YEAR AVG 3YEAR AVG
Source: Company, Angel Research
On one-year forward P/E basis, historically L&T has traded at an average P/E
of 25.8x, 28.8x and 30.3x over the past seven, five and three years,
respectively. Thus, our target P/E multiple of 28.8x is in line with its historical
average.
Exhibit 13: L&T - Parent 1-year forward P/E band
70.0
60.0
50.0
40.0
30.0
20.0
10.0
0.0
15-Oct-03
15-Oct-04
15-Oct-05
15-Oct-06
15-Oct-07
15-Oct-08
15-Oct-09
15-Oct-10
15-Feb-04
15-Feb-05
15-Feb-06
15-Feb-07
15-Feb-08
15-Feb-09
15-Feb-10
15-Jun-04
15-Jun-05
15-Jun-06
15-Jun-07
15-Jun-08
15-Jun-09
15-Jun-10
P/E 7YEAR AVG 5YEAR AVG 3YEAR AVG
Source: Company, Angel Research
October 18, 2010 6
8. Larsen & Toubro | 2QFY2011 Result Update
Investment Arguments
Proxy to India's infra story: We believe that L&T is in an enviable position, given the
apparent shortage of good quality constructors in India. It is in a position to
choose its contracts and negotiate for price variation clauses. L&T's strong balance
sheet, a sound execution engine, wide array of capabilities, integrated operations
tailored to suit India's infrastructure growth story and multiple, recurring value-
unlocking triggers over the medium term, lead us to place faith in this default India
infrastructure story. Further, L&T has an order book of >Rs1trillon, lending revenue
visibility. With signs of pick up in execution, management has guided for an
improving scenario and we also believe that most of the pieces are falling into
place for the company.
Well-capitalised balance sheet funding the expansion: L&T has a well-capitalised
balance sheet, at a debt-equity ratio of 0.4x as of FY2010, in spite of having a
strong portfolio of assets and having invested in future growth areas. We believe
that the key factors for the same are: 1) high margins, and 2) better working
capital management.
Great Infusion-Dilution opportunity: Investment in the construction segment is
expected to double over the Eleventh Plan period, and the PPP model is assuming
greater significance in delivering and meeting physical targets in the different
segments of the Infrastructure space. The government, through Regulatory
changes, is focusing on the construction segment through the PPP mode of
investment. It expects the PPP share in the Eleventh Plan to be 30%, as against a
mere 19.8% in the Tenth Plan. This has become imperative due to the widening
gap between the demand for infrastructure and financial resources available with
the government to fund the same. Given the high growth opportunities present in
L&T's varied business verticals (Infrastructure and Finance), we feel that the
company provides a great infusion-dilution opportunity. It should be noted that
such moves lead to short-term dilution in equity, leading to the EPS getting
temporarily depressed. However, it also shores up the net worth of the company,
which fuels its future growth. Further, it also serves as a benchmark for valuing the
entity.
October 18, 2010 8
14. Larsen & Toubro | 2QFY2011 Result Update
Research Team Tel: 022 - 4040 3800 E-mail: research@angeltrade.com Website: www.angeltrade.com
DISCLAIMER
This document is solely for the personal information of the recipient, and must not be singularly used as the basis of any investment
decision. Nothing in this document should be construed as investment or financial advice. Each recipient of this document should make
such investigations as they deem necessary to arrive at an independent evaluation of an investment in the securities of the companies
referred to in this document (including the merits and risks involved), and should consult their own advisors to determine the merits and
risks of such an investment.
Angel Broking Limited, its affiliates, directors, its proprietary trading and investment businesses may, from time to time, make
investment decisions that are inconsistent with or contradictory to the recommendations expressed herein. The views contained in this
document are those of the analyst, and the company may or may not subscribe to all the views expressed within.
Reports based on technical and derivative analysis center on studying charts of a stock's price movement, outstanding positions and
trading volume, as opposed to focusing on a company's fundamentals and, as such, may not match with a report on a company's
fundamentals.
The information in this document has been printed on the basis of publicly available information, internal data and other reliable
sources believed to be true, but we do not represent that it is accurate or complete and it should not be relied on as such, as this
document is for general guidance only. Angel Broking Limited or any of its affiliates/ group companies shall not be in any way
responsible for any loss or damage that may arise to any person from any inadvertent error in the information contained in this report.
Angel Broking Limited has not independently verified all the information contained within this document. Accordingly, we cannot testify,
nor make any representation or warranty, express or implied, to the accuracy, contents or data contained within this document. While
Angel Broking Limited endeavours to update on a reasonable basis the information discussed in this material, there may be regulatory,
compliance, or other reasons that prevent us from doing so.
This document is being supplied to you solely for your information, and its contents, information or data may not be reproduced,
redistributed or passed on, directly or indirectly.
Angel Broking Limited and its affiliates may seek to provide or have engaged in providing corporate finance, investment banking or
other advisory services in a merger or specific transaction to the companies referred to in this report, as on the date of this report or in
the past.
Neither Angel Broking Limited, nor its directors, employees or affiliates shall be liable for any loss or damage that may arise from or in
connection with the use of this information.
Note: Please refer to the important `Stock Holding Disclosure' report on the Angel website (Research Section). Also, please
refer to the latest update on respective stocks for the disclosure status in respect of those stocks. Angel Broking Limited and
its affiliates may have investment positions in the stocks recommended in this report.
Disclosure of Interest Statement L&T
1. Analyst ownership of the stock No
2. Angel and its Group companies ownership of the stock Yes
3. Angel and its Group companies' Directors ownership of the stock No
4. Broking relationship with company covered No
Note: We have not considered any Exposure below ` 1 lakh for Angel, its Group companies and Directors.
Ratings (Returns) : Buy (> 15%) Accumulate (5% to 15%) Neutral (-5 to 5%)
Reduce (-5% to 15%) Sell (< -15%)
October 18, 2010 14