Pooja 9892124323 : Call Girl in Juhu Escorts Service Free Home Delivery
Market Outlook - 8 October 2010
1. Market Outlook
India Research
October 8, 2010
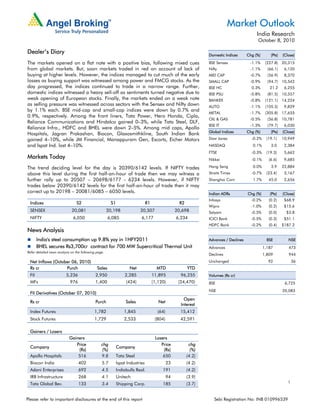
Dealer’s Diary Domestic Indices Chg (%) (Pts) (Close)
The markets opened on a flat note with a positive bias, following mixed cues BSE Sensex -1.1% (227.8) 20,315
from global markets. But, soon markets traded in red on account of lack of Nifty -1.1% (66.1) 6,120
buying at higher levels. However, the indices managed to cut much of the early MID CAP -0.7% (56.9) 8,370
losses as buying support was witnessed among power and FMCG stocks. As the SMALL CAP -0.9% (94.7) 10,542
day progressed, the indices continued to trade in a narrow range. Further, BSE HC 0.3% 21.2 6,255
domestic indices witnessed a heavy sell-off as sentiments turned negative due to BSE PSU -0.8% (81.5) 10,557
weak opening of European stocks. Finally, the markets ended on a weak note BANKEX -0.8% (121.1) 14,224
as selling pressure was witnessed across sectors with the Sensex and Nifty down AUTO -1.1% (105.5) 9,829
by 1.1% each. BSE mid-cap and small-cap indices were down by 0.7% and
METAL -1.7% (305.8) 17,655
0.9%, respectively. Among the front liners, Tata Power, Hero Honda, Cipla,
OIL & GAS -0.5% (56.8) 10,781
Reliance Communications and Hindalco gained 0–3%, while Tata Steel, DLF,
BSE IT -1.3% (79.7) 6,030
Reliance Infra., HDFC and BHEL were down 2–5%. Among mid caps, Apollo
Global Indices Chg (%) (Pts) (Close)
Hospitals, Jagran Prakashan, Biocon, Glaxosmithkline, South Indian Bank
gained 4–10%, while JM Financial, Manappuram Gen, Escorts, Eicher Motors Dow Jones -0.2% (19.1) 10,949
and Ispat Ind. lost 4–10%. NASDAQ 0.1% 3.0 2,384
FTSE -0.3% (19.3) 5,662
Markets Today Nikkei -0.1% (6.6) 9,685
The trend deciding level for the day is 20390/6142 levels. If NIFTY trades Hang Seng 0.0% 3.9 22,884
above this level during the first half-an-hour of trade then we may witness a Straits Times -0.7% (23.4) 3,167
further rally up to 20507 – 20698/6177 - 6234 levels. However, if NIFTY Shanghai Com 1.7% 45.0 2,656
trades below 20390/6142 levels for the first half-an-hour of trade then it may
correct up to 20198 – 20081/6085 – 6050 levels. Indian ADRs Chg (%) (Pts) (Close)
Infosys -0.2% (0.2) $68.9
Indices S2 S1 R1 R2
Wipro -1.0% (0.2) $15.6
SENSEX 20,081 20,198 20,507 20,698 Satyam -0.5% (0.0) $3.8
NIFTY 6,050 6,085 6,177 6,234 ICICI Bank -0.5% (0.3) $51.1
HDFC Bank -0.2% (0.4) $187.2
News Analysis
India's steel consumption up 9.8% yoy in 1HFY2011 Advances / Declines BSE NSE
BHEL secures Rs3,700cr contract for 700 MW Supercritical Thermal Unit Advances 1,187 473
Refer detailed news analysis on the following page.
Declines 1,809 944
Net Inflows (October 06, 2010) Unchanged 92 36
Rs cr Purch Sales Net MTD YTD
FII 5,236 2,950 2,285 11,895 96,255 Volumes (Rs cr)
MFs 976 1,400 (424) (1,120) (24,470) BSE 6,725
NSE 20,083
FII Derivatives (October 07, 2010)
Open
Rs cr Purch Sales Net
Interest
Index Futures 1,782 1,845 (64) 15,412
Stock Futures 1,729 2,533 (804) 42,591
Gainers / Losers
Gainers Losers
Price chg Price chg
Company Company
(Rs) (%) (Rs) (%)
Apollo Hospitals 516 9.8 Tata Steel 650 (4.2)
Biocon India 402 5.7 Ispat Industries 23 (4.2)
Adani Enterprises 692 4.5 Indiabulls Real. 191 (4.2)
IRB Infrastructure 268 4.1 Unitech 94 (3.9)
Tata Global Bev. 133 3.4 Shipping Corp. 185 (3.7) 1
Please refer to important disclosures at the end of this report Sebi Registration No: INB 010996539
2. Market Outlook | India Research
India's steel consumption up 9.8% yoy in 1HFY2011
As per provisional figures, India’s steel consumption for 1HFY2011 grew by 9.8% yoy to
29.8mn tonnes on the back of steady demand. However, domestic production increased
by 4.9% yoy to 30.6mn tonnes during the same period. From April–September 2010,
imports increased by 32.6% yoy to 4.4mn tonnes, which kept domestic prices under
pressure during June and July 2010. However, as imports declined in August and
September, domestic players were able to hike product prices by 2–3% for October
deliveries after increasing it by Rs1,000/tonne in the first week of September.
During 2QFY2011, SAIL’s sales volume increased by 8.5% yoy and 33.3% qoq to 3.2mn
tonnes. Sales volume growth was mainly on account of improved demand from the
construction and manufacturing sectors. Similarly, for Tata Steel, 2QFY2011 sales volume
increased by 14% yoy and 18.9% qoq to 1.7mn tonnes. We maintain Accumulate on Tata
Steel with a Target Price of Rs702 and Neutral on SAIL.
BHEL secures Rs3,700cr contract for 700 MW Supercritical Thermal Unit
BHEL has bagged a Rs 3,700cr turnkey contract from Karnataka Power Corporation Ltd.
for setting up the 700-MW supercritical unit at Bellary Thermal Power Station in Karnataka.
BHEL had won this order by outbidding L&T in International Competitive Bidding.
We maintain our Neutral rating on the stock.
October 8, 2010 2
3. Market Outlook | India Research
Economic and Political News
Food inflation dips marginally to 16.24%
Food inflation would ease from November with the arrival of new crop: Government
Imports of sensitive items up by 21% in April–July to Rs23,039cr
New policy on FDI in multi-brand retail soon: Commerce Ministry
Corporate News
Zydus Cadila gets US FDA nod to sale anti-blood pressure drug
S&P revises outlook of Tata Steel and its UK unit to stable
Government to decide on Cairn deal by year end
Source: Economic Times, Business Standard, Business Line, Financial Express, Mint
Events for the day
K Sera Sera Results, Dividend
REI Agro Results, Dividend
October 8, 2010 3
4. Market Outlook | India Research
Research Team Tel: 022-4040 3800 E-mail: research@angeltrade.com Website: www.angeltrade.com
DISCLAIMER
This document is solely for the personal information of the recipient, and must not be singularly used as the basis of any investment
decision. Nothing in this document should be construed as investment or financial advice. Each recipient of this document should make
such investigations as they deem necessary to arrive at an independent evaluation of an investment in the securities of the companies
referred to in this document (including the merits and risks involved), and should consult their own advisors to determine the merits and
risks of such an investment.
Angel Broking Limited, its affiliates, directors, its proprietary trading and investment businesses may, from time to time, make investment
decisions that are inconsistent with or contradictory to the recommendations expressed herein. The views contained in this document are
those of the analyst, and the company may or may not subscribe to all the views expressed within.
Reports based on technical and derivative analysis center on studying charts of a stock's price movement, outstanding positions and
trading volume, as opposed to focusing on a company's fundamentals and, as such, may not match with a report on a company's
fundamentals.
The information in this document has been printed on the basis of publicly available information, internal data and other reliable sources
believed to be true, but we do not represent that it is accurate or complete and it should not be relied on as such, as this document is for
general guidance only. Angel Broking Limited or any of its affiliates/ group companies shall not be in any way responsible for any loss or
damage that may arise to any person from any inadvertent error in the information contained in this report. Angel Broking Limited has
not independently verified all the information contained within this document. Accordingly, we cannot testify, nor make any representation
or warranty, express or implied, to the accuracy, contents or data contained within this document. While Angel Broking Limited
endeavours to update on a reasonable basis the information discussed in this material, there may be regulatory, compliance, or other
reasons that prevent us from doing so.
This document is being supplied to you solely for your information, and its contents, information or data may not be reproduced,
redistributed or passed on, directly or indirectly.
Angel Broking Limited and its affiliates may seek to provide or have engaged in providing corporate finance, investment banking or other
advisory services in a merger or specific transaction to the companies referred to in this report, as on the date of this report or in the past.
Neither Angel Broking Limited, nor its directors, employees or affiliates shall be liable for any loss or damage that may arise from or in
connection with the use of this information.
Note: Please refer to the important `Stock Holding Disclosure' report on the Angel website (Research Section). Also, please refer to the
latest update on respective stocks for the disclosure status in respect of those stocks. Angel Broking Limited and its affiliates may have
investment positions in the stocks recommended in this report.
Address: Acme Plaza, ‘A’ Wing, 3rd Floor, M.V. Road, Opp. Sangam Cinema, Andheri (E), Mumbai - 400 059.
Tel : (022) 3952 4568 / 4040 3800
Angel Broking Ltd: BSE Sebi Regn No : INB 010996539 / CDSL Regn No: IN - DP - CDSL - 234 - 2004 / PMS Regn Code: PM/INP000001546
Angel Capital & Debt Market Ltd: INB 231279838 / NSE FNO: INF 231279838 / NSE Member code -12798 Angel Commodities Broking (P) Ltd: MCX Member ID: 12685 / FMC Regn No: MCX / TCM /
CORP / 0037 NCDEX : Member ID 00220 / FMC Regn No: NCDEX / TCM / CORP / 0302
October 8, 2010 4