Solution Manual for Principles of Corporate Finance 14th Edition by Richard B...
Petronet lng 2 qfy2011ru-261010
1. Please refer to important disclosures at the end of this report 1
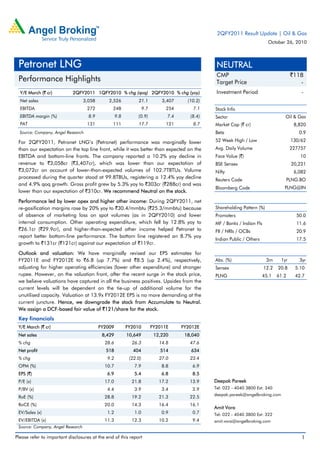
Y/E March (` cr) 2QFY2011 1QFY2010 % chg (qoq) 2QFY2010 % chg (yoy)
Net sales 3,058 2,526 21.1 3,407 (10.2)
EBITDA 272 248 9.7 254 7.1
EBITDA margin (%) 8.9 9.8 (0.9) 7.4 (8.4)
PAT 131 111 17.7 121 8.7
Source: Company, Angel Research
For 2QFY2011, Petronet LNG’s (Petronet) performance was marginally lower
than our expectation on the top line front, while it was better than expected on the
EBITDA and bottom-line fronts. The company reported a 10.2% yoy decline in
revenue to `3,058cr (`3,407cr), which was lower than our expectation of
`3,072cr on account of lower-than-expected volumes of 102.7TBTUs. Volume
processed during the quarter stood at 99.8TBUs, registering a 12.4% yoy decline
and 4.9% qoq growth. Gross profit grew by 5.3% yoy to `303cr (`288cr) and was
lower than our expectation of `310cr. We recommend Neutral on the stock.
Performance led by lower opex and higher other income: During 2QFY2011, net
re-gasification margins rose by 20% yoy to `30.4/mmbtu (`25.3/mmbtu) because
of absence of marketing loss on spot volumes (as in 2QFY2010) and lower
internal consumption. Other operating expenditure, which fell by 12.8% yoy to
`26.1cr (`29.9cr), and higher-than-expected other income helped Petronet to
report better bottom-line performance. The bottom line registered an 8.7% yoy
growth to `131cr (`121cr) against our expectation of `119cr.
Outlook and valuation: We have marginally revised our EPS estimates for
FY2011E and FY2012E to `6.8 (up 7.7%) and `8.5 (up 2.4%), respectively,
adjusting for higher operating efficiencies (lower other expenditure) and stronger
rupee. However, on the valuation front, after the recent surge in the stock price,
we believe valuations have captured in all the business positives. Upsides from the
current levels will be dependent on the tie-up of additional volume for the
unutilised capacity. Valuation at 13.9x FY2012E EPS is no more demanding at the
current juncture. Hence, we downgrade the stock from Accumulate to Neutral.
We assign a DCF-based fair value of `121/share for the stock.
Key financials
Y/E March (` cr) FY2009 FY2010 FY2011E FY2012E
Net sales 8,429 10,649 12,220 18,040
% chg 28.6 26.3 14.8 47.6
Net profit 518 404 514 634
% chg 9.2 (22.0) 27.0 23.4
OPM (%) 10.7 7.9 8.8 6.9
EPS (`) 6.9 5.4 6.8 8.5
P/E (x) 17.0 21.8 17.2 13.9
P/BV (x) 4.4 3.9 3.4 2.9
RoE (%) 28.8 19.2 21.3 22.5
RoCE (%) 20.0 14.3 16.4 16.1
EV/Sales (x) 1.2 1.0 0.9 0.7
EV/EBITDA (x) 11.3 12.3 10.2 9.4
Source: Company, Angel Research
NEUTRAL
CMP `118
Target Price -
Investment Period -
Stock Info
Sector
Bloomberg Code
Shareholding Pattern (%)
Promoters 50.0
MF / Banks / Indian Fls 11.6
FII / NRIs / OCBs 20.9
Indian Public / Others 17.5
Abs. (%) 3m 1yr 3yr
Sensex 12.2 20.8 5.10
PLNG 45.1 61.2 42.7
10
20,221
6,082
PLNG.BO
PLNG@IN
8,820
0.9
130/62
227757
Oil & Gas
Avg. Daily Volume
Market Cap (` cr)
Beta
52 Week High / Low
Face Value (`)
BSE Sensex
Nifty
Reuters Code
Deepak Pareek
Tel: 022 - 4040 3800 Ext: 340
deepak.pareek@angelbroking.com
Amit Vora
Tel: 022 - 4040 3800 Ext: 322
amit.vora@angelbroking.com
Petronet LNG
Performance Highlights
2QFY2011 Result Update | Oil & Gas
October 26, 2010
2. Petronet LNG | 2QFY2011 Result Update
October 26, 2010 2
Exhibit 1: 2QFY2011 performance
Y/E March (` cr) 2QFY2011 1QFY2011 % chg (qoq) 2QFY2010 % chg (yoy) 1HFY2011 1HFY2010 % chg (yoy)
Net sales 3,058 2,526 21.1 3,407 (10.2) 5,584 6,019 (7.2)
COGS 2,755 2,233 23.3 3,119 (11.7) 4,988 5,521 (9.7)
Other operating expenditure 31 45 34 76 63
EBITDA 272 248 9.7 254 7.1 519 436 19.3
EBITDA margin (%) 8.9 9.8 7.4 9.3 7.2
Other income 19 13 47.6 19 (2.6) 31 48 (34.9)
Depreciation 47 46 1.0 43 8.3 93 69 35.1
Interest 49 50 (0.7) 51 (3.1) 99 79 25.0
PBT 194 164 18.1 179 8.6 358 335 6.9
PBT margin (%) 6.3 6.5 5.2 6.4 5.6
Total tax 63 53 18.9 58 8.6 116 111 4.2
% of PBT 32.5 32.2 32.5 32.4 33.2
PAT 131 111 17.7 121 8.7 242 224 8.3
PAT margin (%) 4.3 4.4 3.5 4.3 3.7
Source: Company, Angel Research
Exhibit 2: 2QFY2011 Actual v/s Angel estimates
Estimates Actual Variation (%)
Net sales 3,072 3,058 (0.5)
EBITDA 264 272 3.1
EBITDA margin (%) 8.6 8.9 0.3
PBT 178 194 9.3
PAT 119 131 10.6
Source: Company, Angel Research
Volume and top line down yoy: For 2QFY2011, Petronet’s R-LNG volumes
declined by 12.4% yoy mainly on account of termination of RGPPL contract in
September 2009 (which was present in 2QFY2010). Volumes processed during the
quarter stood at 99.8TBTU and was marginally lower than our expectation of
102.7TBTUs. Tolling volumes during the quarter stood flat at 0.3TBTU as against
0.4TBTU registered in 2QFY2010. Contractual volumes were higher on a yoy basis
at 89.7TBTUs (62TBTUs) on account of commissioning of additional 2.5MMTPA of
gas supplies from Qatar in January 2010. Spot volumes stood at 9.8TBTU against
51.5TBTU (including RGPPL volumes) registered in 2QFY2010. However, on a qoq
basis, volumes increased by 4.9% (95.1TBTU in 4QFY2010) on account of nil spot
volumes in 1QFY2011, despite lower tolling volumes during the quarter. On the
revenue front, the company reported a 10.2% yoy decline in revenue to `3,058cr
(`3,407cr), which was lower than our expectation of `3,072cr. Realisation during
the quarter registered 2.4% yoy growth on account of increased prices of LNG,
which was sourced from Rasgas.
3. Petronet LNG | 2QFY2011 Result Update
October 26, 2010 3
Exhibit 3: R-LNG volumes
61.0
67.8
60.1 63.0 62.7 62.0 65.0
90.8 89.5 89.7
17.0
7.2
25.0
19.5
36.1
51.8
30.2
1.0
5.7
10.1
0.0
10.0
20.0
30.0
40.0
50.0
60.0
70.0
80.0
90.0
100.0
1QFY09
2QFY09
3QFY09
4QFY09
1QFY10
2QFY10
3QFY10
4QFY10
1QFY11
2QFY11
TBTUs
Contracted LNG Sales in TBTUs Spot cargo & Tolling volumes sales in TBTUs (Incl. RGPPL Gas)
Source: Company, Angel Research
Exhibit 4: Operating revenue – Growth trend (yoy)
105.8
(9.2) (10.1)
(3.3)
(10.2)
(20.0)
-
20.0
40.0
60.0
80.0
100.0
120.0
-
500
1,000
1,500
2,000
2,500
3,000
3,500
4,000
2QFY10 3QFY10 4QFY10 1QFY11 2QFY11
(%)
(`cr)
Total operating revenues Total operating revenues growth (RHS)
Source: Company, Angel Research
Better operating performance led by higher regas margins and lower other exp.:
Net re-gasification margins during the quarter rose by 20% yoy to `30.4/mmbtu
(`25.3/mmbtu) and were in line with our expectation on account of absence of
marketing loss on spot volumes (as in 2QFY2010) and lower internal
consumption. Recalibration of turbines resulted in lower internal consumption,
which translated into higher operational efficiency. However, net re-gasification
margins declined marginally on a qoq basis. On tolling volumes (0.3TBTU), the
company’s tolling margins stood at `32.8/mmbtu during the quarter. Gross profit
increased by 5.3% yoy to `303cr (`288cr) and was lower than our expectation of
`310cr on account of lower-than-expected volumes. OPM expanded by 144bp yoy
to 8.9% (7.4%), resulting in EBITDA/mmbtu of `27.2 (`22.3) mainly on account of
lower other operating expenditure, which stood at `26.1cr (`29.9cr). On a
sequential basis also, EBITDA/mmbtu increased to `27.2 (`26.0). Consequently,
EBITDA registered a 7.1% yoy increase to `272cr (`254cr).
4. Petronet LNG | 2QFY2011 Result Update
October 26, 2010 4
Exhibit 5: Netback margin trend
Particulars (`/TBTU) 1QFY09 2QFY09 3QFY09 4QFY09 1QFY10 2QFY10 3QFY10 4QFY10 1QFY11 2QFY11
Realisation 211 221 291 322 272 300 262 262 280 307
Raw-material cost 182 192 265 273 251 275 237 236 250 277
Reported netback margin 28.6 28.4 25.3 48.7 21.1 25.3 25.0 26.3 30.7 30.4
Source: Company, Angel Research
Exhibit 6: Operating performance trend
7.4
9.3
8.5
9.8
8.9
-
2.0
4.0
6.0
8.0
10.0
12.0
-
50
100
150
200
250
300
2QFY10 3QFY10 4QFY10 1QFY11 2QFY11
(%)
(`cr)
Operating Profit Operating Margins (RHS)
Source: Company, Angel Research
Depreciation cost increases, interest cost declines: Depreciation cost during
2QFY2011 increased by 8.3% yoy to `47cr (`43cr) due to capitalisation of the
Dahej terminal. However, interest expenditure declined by 3.1% yoy to
`49.5cr (`51.1cr).
PAT increases 8.7% yoy: During the quarter, Petronet witnessed better-than-
expected bottom-line performance, despite lower-than-expected volumes.
PAT registered an increase of 8.7% yoy to `131cr (`111cr) and was higher than
our expectation of `119cr. Growth was led by better operating performance due to
lower other expenditure and higher-than-expected other income. Other income
during the quarter stood flat yoy at `19cr, against our expectation of `12cr.
However, the same increased on a sequential basis by 47.6% to `19cr (`13cr).
Other income was higher as it included `9cr due to forex gains.
5. Petronet LNG | 2QFY2011 Result Update
October 26, 2010 5
Exhibit 7: PAT – Growth trend (yoy)
16.8
(20.8)
(52.3)
7.8 8.7
(60.0)
(50.0)
(40.0)
(30.0)
(20.0)
(10.0)
-
10.0
20.0
30.0
-
20
40
60
80
100
120
140
2QFY10 3QFY10 4QFY10 1QFY11 2QFY11
(%)
(`cr)
PAT PAT growth (RHS)
Source: Company, Angel Research
Investment arguments
LNG prices to remain subdued: One of the concerns pertaining to viability of the
LNG import model in the country was the high cost associated with imports.
However, we expect shale gas to transform the global supply and price outlook for
natural gas and competing energy options. Shale gas, which accounted for only
1% of US natural gas supply in 2000, has grown to 20% today; and by 2035, it
could be 50%. Natural gas shale boom in the US has more than doubled the
discovered gas resources and can supply more than the century’s consumption at
the current rate. Newer technologies such as hydraulic fracturing and horizontal
drilling have opened up vast new resources of natural gas from shale formation.
Thus, shale gas could act as a competitive alternative to LNG, which in turn is
likely to result in de-coupling of the global LNG and global crude oil markets.
De-coupling is likely to result in the reduction of slope of LNG contracts to crude oil
prices. Shale gas and upcoming LNG capacities would reduce the price spikes for
natural gas, which would benefit major gas consumers such as power generation
companies.
LNG import model viable going ahead: We believe LNG is likely to be a key
source of gas supplies in the medium term on account of strong gas demand in
the country. Hence, Petronet is a proxy play on the increasing gap between natural
gas supplies and demand in the country. The delay in KG basin gas ramp-up has
further helped the matters. Moreover, we expect domestic gas demand estimates
to be revised upwards on account of increasing pipeline connectivity to various
regions. Moreover, the government is making efforts to maintain long-term
viability of LNG in the overall gas mix of the country. Government could act on the
Mercados Energy Markets International report regarding uniform domestic gas
pricing. This move, if implemented, is likely to increase marketability of R-LNG in
the country.
6. Petronet LNG | 2QFY2011 Result Update
October 26, 2010 6
Outlook and valuation
For 2QFY2011, Petronet reported better-than-expected performance. Going
ahead, we believe the company will continue to deliver better set of numbers on
account of increased LNG imports, as concerns over the limited pipeline capacity
of GAIL are expected to fade out and demand for LNG is likely to grow. Capacity
of Petronet’s Dahej terminal stands at 11.5MMTPA. However, it has linkages of
7.5MMTPA for the same. Thus, if the untied capacity of 4.0MMTPA (35% of
installed capacity) is sourced, it will likely reduce the untied linkages of the
company and prove to be a strong re-rating trigger for the stock.
On the tariff front, we do not see significant risks emerging in the near future due
to absence of regulatory interference. Nonetheless, we do not expect the trend of
annual escalation to continue. In fact, we have assumed a freeze on regasification
margins from CY2012E on account of repricing of LNG, following the monthly
alignment with JCC prices. Thus, there could be upsides to our estimates if the
annual hike in the regasification margins continues beyond the forecast period.
We have marginally revised our EPS estimates for FY2011E and FY2012E to `6.8
(up 7.7%) and `8.5 (up 2.4%), respectively, adjusting for higher operating
efficiencies (lower other expenditure) and stronger rupee. However, on the
valuation front, after the recent surge in the stock price, we believe valuations have
captured in all the business positives. Upsides from the current levels will be
dependent on the tie-up of additional volume for the unutilised capacity. Valuation
at 13.9x FY2012E EPS is no more demanding at the current juncture. Hence, we
downgrade the stock from Accumulate to Neutral. We assign a DCF-based fair
value of `121/share for the stock.
12. Petronet LNG | 2QFY2011 Result Update
October 26, 2010 12
Research Team Tel: 022 - 4040 3800 E-mail: research@angeltrade.com Website: www.angeltrade.com
DISCLAIMER
This document is solely for the personal information of the recipient, and must not be singularly used as the basis of any investment
decision. Nothing in this document should be construed as investment or financial advice. Each recipient of this document should make
such investigations as they deem necessary to arrive at an independent evaluation of an investment in the securities of the companies
referred to in this document (including the merits and risks involved), and should consult their own advisors to determine the merits and
risks of such an investment.
Angel Broking Limited, its affiliates, directors, its proprietary trading and investment businesses may, from time to time, make
investment decisions that are inconsistent with or contradictory to the recommendations expressed herein. The views contained in this
document are those of the analyst, and the company may or may not subscribe to all the views expressed within.
Reports based on technical and derivative analysis center on studying charts of a stock's price movement, outstanding positions and
trading volume, as opposed to focusing on a company's fundamentals and, as such, may not match with a report on a company's
fundamentals.
The information in this document has been printed on the basis of publicly available information, internal data and other reliable
sources believed to be true, but we do not represent that it is accurate or complete and it should not be relied on as such, as this
document is for general guidance only. Angel Broking Limited or any of its affiliates/ group companies shall not be in any way
responsible for any loss or damage that may arise to any person from any inadvertent error in the information contained in this report.
Angel Broking Limited has not independently verified all the information contained within this document. Accordingly, we cannot testify,
nor make any representation or warranty, express or implied, to the accuracy, contents or data contained within this document. While
Angel Broking Limited endeavours to update on a reasonable basis the information discussed in this material, there may be regulatory,
compliance, or other reasons that prevent us from doing so.
This document is being supplied to you solely for your information, and its contents, information or data may not be reproduced,
redistributed or passed on, directly or indirectly.
Angel Broking Limited and its affiliates may seek to provide or have engaged in providing corporate finance, investment banking or
other advisory services in a merger or specific transaction to the companies referred to in this report, as on the date of this report or in
the past.
Neither Angel Broking Limited, nor its directors, employees or affiliates shall be liable for any loss or damage that may arise from or in
connection with the use of this information.
Note: Please refer to the important `Stock Holding Disclosure' report on the Angel website (Research Section). Also, please
refer to the latest update on respective stocks for the disclosure status in respect of those stocks. Angel Broking Limited and
its affiliates may have investment positions in the stocks recommended in this report.
Disclosure of Interest Statement Petronet LNG
1. Analyst ownership of the stock Yes
2. Angel and its Group companies ownership of the stock No
3. Angel and its Group companies' Directors ownership of the stock No
4. Broking relationship with company covered No
Note: We have not considered any Exposure below `1 lakh for Angel, its Group companies and Directors.
Ratings (Returns): Buy (> 15%) Accumulate (5% to 15%) Neutral (-5 to 5%)
Reduce (-5% to 15%) Sell (< -15%)