(INDIRA) Call Girl Mumbai Call Now 8250077686 Mumbai Escorts 24x7
PNB
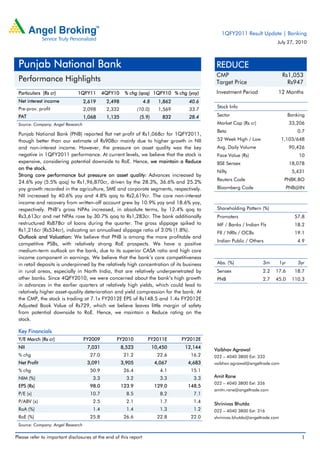
1. 1QFY2011 Result Update | Banking
July 27, 2010
Punjab National Bank REDUCE
CMP Rs1,053
Performance Highlights Target Price Rs947
Particulars (Rs cr) 1QFY11 4QFY10 % chg (qoq) 1QFY10 % chg (yoy) Investment Period 12 Months
Net interest income 2,619 2,498 4.8 1,862 40.6
Pre-prov. profit Stock Info
2,098 2,332 (10.0) 1,569 33.7
PAT 1,068 1,135 (5.9) 832 28.4 Sector Banking
Source: Company, Angel Research Market Cap (Rs cr) 33,206
Beta 0.7
Punjab National Bank (PNB) reported flat net profit of Rs1,068cr for 1QFY2011,
though better than our estimate of Rs908cr mainly due to higher growth in NII 52 Week High / Low 1,103/648
and non-interest income. However, the pressure on asset quality was the key Avg. Daily Volume 90,426
negative in 1QFY2011 performance. At current levels, we believe that the stock is Face Value (Rs) 10
expensive, considering potential downside to RoE. Hence, we maintain a Reduce BSE Sensex 18,078
on the stock.
Nifty 5,431
Strong core performance but pressure on asset quality: Advances increased by
Reuters Code PNBK.BO
24.6% yoy (5.5% qoq) to Rs1,96,870cr, driven by the 28.3%, 36.6% and 25.2%
yoy growth recorded in the agriculture, SME and corporate segments, respectively. Bloomberg Code PNB@IN
NII increased by 40.6% yoy and 4.8% qoq to Rs2,619cr. The core non-interest
income and recovery from written-off account grew by 10.9% yoy and 18.6% yoy,
respectively. PNB’s gross NPAs increased, in absolute terms, by 12.4% qoq to Shareholding Pattern (%)
Rs3,613cr and net NPAs rose by 30.7% qoq to Rs1,283cr. The bank additionally Promoters 57.8
restructured Rs878cr of loans during the quarter. The gross slippage spiked to MF / Banks / Indian Fls 18.2
Rs1,216cr (Rs534cr), indicating an annualised slippage ratio of 3.0% (1.8%).
FII / NRIs / OCBs 19.1
Outlook and Valuation: We believe that PNB is among the more profitable and
Indian Public / Others 4.9
competitive PSBs, with relatively strong RoE prospects. We have a positive
medium-term outlook on the bank, due to its superior CASA ratio and high core
income component in earnings. We believe that the bank’s core competitiveness
in retail deposits is underpinned by the relatively high concentration of its business Abs. (%) 3m 1yr 3yr
in rural areas, especially in North India, that are relatively underpenetrated by Sensex 2.2 17.6 18.7
other banks. Since 4QFY2010, we were concerned about the bank’s high growth PNB 2.7 45.0 110.3
in advances in the earlier quarters at relatively high yields, which could lead to
relatively higher asset-quality deterioration and yield compression for the bank. At
the CMP, the stock is trading at 7.1x FY2012E EPS of Rs148.5 and 1.4x FY2012E
Adjusted Book Value of Rs729, which we believe leaves little margin of safety
from potential downside to RoE. Hence, we maintain a Reduce rating on the
stock.
Key Financials
Y/E March (Rs cr) FY2009 FY2010 FY2011E FY2012E
NII 7,031 8,523 10,450 12,144
Vaibhav Agrawal
% chg 27.0 21.2 22.6 16.2 022 – 4040 3800 Ext: 333
Net Profit 3,091 3,905 4,067 4,683 vaibhav.agrawal@angeltrade.com
% chg 50.9 26.4 4.1 15.1
NIM (%) 3.3 3.2 3.3 3.3 Amit Rane
022 – 4040 3800 Ext: 326
EPS (Rs) 98.0 123.9 129.0 148.5
amitn.rane@angeltrade.com
P/E (x) 10.7 8.5 8.2 7.1
P/ABV (x) 2.5 2.1 1.7 1.4 Shrinivas Bhutda
RoA (%) 1.4 1.4 1.3 1.2 022 – 4040 3800 Ext: 316
RoE (%) 25.8 26.6 22.8 22.0 shrinivas.bhutda@angeltrade.com
Source: Company, Angel Research
Please refer to important disclosures at the end of this report 1
2. Punjab National Bank | 1QFY2011 Result Update
Exhibit 1: 1QFY2011 performance
% chg % chg
Particulars (Rs cr) 1QFY2011 4QFY2010 1QFY2010
(qoq) (yoy)
Interest earned 5,992 5,608 6.9 5207 15.1
Interest expenses 3,373 3,110 8.5 3346 0.8
Net interest income 2,619 2,498 4.8 1862 40.6
Non-interest income 872 935 (6.7) 970 (10.2)
Total income 3,490 3,433 1.7 2832 23.2
Operating expenses 1,392 1,100 26.5 1263 10.2
Pre-prov. profit 2,098 2,332 (10.0) 1569 33.7
Provisions & cont. 534 622 (14.1) 302 77.0
PBT 1,564 1,711 (8.6) 1268 23.4
Prov. for taxes 496 576 (13.9) 436 13.8
PAT 1,068 1,135 (5.9) 832 28.4
EPS (Rs) 33.9 36.0 (5.9) 26.4 28.4
Cost-to-income ratio (%) 39.9 32.0 44.6
Effective tax rate (%) 31.7 33.6 34.4
Net NPA (%) 0.7 0.5 0.2
Source: Company, Angel Research
Exhibit 2: 1QFY2011 Actual v/s Angel estimates
Particulars (Rs cr) Actual Estimates Var. (%)
Net interest income 2,619 2,429 7.8
Non-interest income 872 757 15.1
Total income 3,490 3,186 9.5
Operating expenses 1,392 1,266 9.9
Pre-prov. profit 2,098 1,920 9.3
Provisions & cont. 534 562 (4.9)
PBT 1,564 1,358 15.2
Prov. for taxes 496 450 10.1
PAT 1,068 908 17.7
Source: Company, Angel Research
July 27, 2010 2
3. Punjab National Bank | 1QFY2011 Result Update
Advances growth
Advances increased by 24.6% yoy (5.5% qoq) to Rs1,96,870cr, driven by a 28.3%,
36.6% and 25.2% yoy growth in the agriculture, SME and corporate segments,
respectively. Deposits grew by 16.6% yoy to Rs2,55,335cr in 1QFY2011. CASA
deposits grew at a healthy 24.3% yoy, taking the CASA ratio to 40.9% (40.8% in
4QFY2010 and 38.3% in 1QFY2010).
Exhibit 3: Trend in advances and deposits
(Rs cr) Deposits (LHS) Advances (LHS) Credit-Deposit ratio (%) (RHS) (%)
300,000 78
77
250,000 76
75
200,000 74
73
150,000
72
100,000 71
70
50,000 69
68
- 67
3QFY09
4QFY09
1QFY10
2QFY10
3QFY10
4QFY10
1QFY11
Source: Company, Angel Research
Exhibit 4: Domestic advances break-up (1QFY2011)
Services & Others
Agri
17%
16%
Comm. Real
Estate
Retail
6%
10%
Medium & Large MSME
Corporates 11%
40%
Source: Company, Angel Research
July 27, 2010 3
4. Punjab National Bank | 1QFY2011 Result Update
Exhibit 5: Trend in CASA deposits
(%) CASA ratio
50
40 41 41
37 39 38 38
40
30
20
10
-
3QFY09
4QFY09
1QFY10
2QFY10
3QFY10
4QFY10
1QFY11
Source: Company, Angel Research
Sequential NIMs down marginally
During 1QFY2011, NII increased by 40.6% yoy and 4.8% qoq to Rs2,619cr. The
yield on advances increased by 6bp sequentially to 10.28%, however, cost of
deposits increased at higher rate by 14bp sequentially to 5.02%. As a result,
reported NIMs declined marginally by 5bp sequentially to 3.94%. The impact of
daily interest payment on savings deposits was about 10bp.
Exhibit 6: Trend in quarterly reported NIM
(%) Reported NIM
4.5
4.0 3.9
4.0 3.7
3.6 3.6 3.6
3.5
3.5 3.3 3.2
3.1
3.0
2.5
2.0
4QFY08
1QFY09
2QFY09
3QFY09
4QFY09
1QFY10
2QFY10
3QFY10
4QFY10
1QFY11
Source: Company, Angel Research
July 27, 2010 4
5. Punjab National Bank | 1QFY2011 Result Update
Non-interest income declines yoy but improves sequentially
The non-interest income declined 10.2% yoy to Rs872cr, driven by a 66.2% yoy
reduction in treasury gains. The core non-interest income and recovery from
written-off accounts grew by 10.9% yoy and 18.6% yoy, respectively.
Asset quality under pressure
PNB’s gross NPAs increased in absolute terms by 12.4% qoq to Rs3,613cr and net
NPAs rose by 30.7% qoq to Rs1,283cr. The gross and net NPA ratios deteriorated
to 1.8% and 0.7% (as against 1.7% and 0.5% respectively, in 4QFY2010),
respectively. The bank’s provision coverage ratio including technical write-offs
stood at 77.6% (81.2% in 4QFY2010 and 92.9% in 1QFY2010). PNB has
cumulatively restructured Rs12,973cr of its loans till date (6.6% of loans, 68% of
the net worth). The bank additionally restructured Rs878cr of loans during the
quarter. The gross slippage spiked to Rs1,216cr (Rs534cr), indicating an
annualised slippage ratio of 3.0% (1.8%). Till date, Rs1,038cr worth of loans have
slipped into NPAs from the restructured accounts (8% of the total restructuring), of
which Rs263 slipped during the current quarter. Management has indicated a
broad range of 10-15% as expected slippages from the restructured accounts.
Exhibit 7: Trend in asset quality
(%) Gross NPA % (LHS) Net NPA % (LHS) Provision Coverage % (RHS) (%)
5.0 100.0
4.5
4.0 90.0
3.5 80.0
3.0
2.5 70.0
2.0
1.5 60.0
1.0 50.0
0.5
- 40.0
1QFY08
2QFY08
3QFY08
4QFY08
1QFY09
2QFY09
3QFY09
4QFY09
1QFY10
2QFY10
3QFY10
4QFY10
1QFY11
Source: Company, Angel Research, Note: NPA coverage % excluding technical write-offs
Increased NPA provisions
The bank made provisions of Rs550cr towards the NPAs in 1QFY2011, compared
to Rs462cr in 4QFY2010 and Rs269cr in 1QFY2010. Provision for investments
stood at Rs14cr, compared to a write-back of Rs50cr in 1QFY2010 (due to the low
interest rate environment in 1QFY2010). The bank’s SLR stood at 25.1%. Out of
the total investment book of Rs81,036cr, the bank’s AFS portfolio constituted
18.2%, with a modified duration of 2.2 years.
July 27, 2010 5
6. Punjab National Bank | 1QFY2011 Result Update
Operating cost under control
Employee cost increased by 52.4% sequentially to Rs995cr on account of
provisions for pension fund (Rs125cr), gratuity fund (Rs125cr) and towards
AS-15 (Rs107cr). Other operating expenses increased by 11.7% yoy to Rs397cr. As
a result, total operating cost increased by 10.2% yoy to Rs1,392cr. The cost-to-
income ratio of the bank stood at 39.9% (from 32.1% in 4QFY2010 and 44.6% in
1QFY2010).
Exhibit 8: Trend in productivity
(%) Cost-to-Income ratio
55 51
48 48 48
50
45
45 42 43 42
40 41 40
40 38
35 32
30
25
20
1QFY08
2QFY08
3QFY08
4QFY08
1QFY09
2QFY09
3QFY09
4QFY09
1QFY10
2QFY10
3QFY10
4QFY10
1QFY11
Source: Company, Angel Research
Comfortable capital adequacy
PNB’s CAR stood at a healthy 13.8% at the end of 1QFY2011, with a Tier-I ratio
of 8.7%. Tier-I capital constituted 63.1% of the bank’s CAR.
Exhibit 9: Comfortable capital adequacy
(%) Tier-I CAR Tier-II CAR
16.0
14.0
12.0
10.0
8.0
6.0
4.0
2.0
-
1QFY10
2QFY10
3QFY10
4QFY10
1QFY11
Source: Company, Angel Research
July 27, 2010 6
7. Punjab National Bank | 1QFY2011 Result Update
Investment Arguments
Relatively higher YoA could lead to relatively higher asset quality deterioration: The
yield on advances of the bank increased by 49bp in 9MFY2010 over FY2008
levels, as against an average decrease of 5bp for the PSU banks. This gap
reduced in 4QFY2010 indicating unsustainable yields for PNB. PNB has
cumulatively restructured Rs12,096cr of loans till date (6.5% of loans, 75% of the
net worth) which is higher than the industry standards. In our view, the bank’s
strategy of high growth in advances at relatively high yields could contribute to
relatively higher asset quality deterioration and NIM compression for the bank
going forward.
Strong CASA legacy, but losing market share: PNB has a structural advantage of a
high CASA ratio of 40.8%, which is driven by strong rural and semi-urban
presence, especially in North India (total of 4,707 branches and 2,910 ATMs).
That said, the bank is losing market share like other PSBs (except SBI) on account
of slow branch expansion and competition from the private banks -savings market
share down by 50bp to 7.1% over FY2007-10.
Expensive valuations: The stock is trading at 1.4x FY2012E ABV of Rs729, which is
expensive considering its 5-year range of 1.0-1.5x and median of 1.3x. While we
believe the bank can deliver healthy core RoEs of 17-18% due to its strong legacy,
actual RoEs are unsustainably high at 26.6%. In our view, super-normal RoEs
cannot be sustainably earned through higher-than-sector average risk-adjusted
yield on assets and tend to decline in subsequent years either through an increase
in NPA costs or decline in yields. We believe that current valuations fairly reflect
PNB’s structural positives, but do not provide a sufficient margin of safety from
potential near-term asset quality pressures/decline in asset yields. Hence, we
maintain a Reduce rating on the stock, with a Target Price of Rs947.
July 27, 2010 7
8. Punjab National Bank | 1QFY2011 Result Update
Exhibit 10: Key assumptions
Earlier estimates Revised estimates
Particulars (%)
FY2011E FY2012E FY2011E FY2012E
Credit growth 19.0 18.0 22.0 18.0
Deposit growth 19.0 18.0 19.0 18.0
CASA ratio 40.2 39.4 40.2 39.4
NIM 3.3 3.2 3.3 3.3
Other income growth (15.0) 15.2 (15.1) 15.1
Growth in staff expenses 17.0 19.0 17.0 19.0
Growth in other expenses 13.0 19.0 13.0 19.0
Slippages 1.8 1.7 1.8 1.7
Coverage ratio 69.2 68.9 70.4 70.1
Treasury gain/(loss) (% of investments) 0.1 0.1 0.1 0.1
Source: Company, Angel Research
Exhibit 11: Change in estimates
FY2011E FY2012E
Particulars (Rs cr) Earlier Revised Earlier Revised
% chg % chg
estimates estimates estimates estimates
NII 10,362 10,450 0.9 11,948 12,144 1.6
Non-interest income 3,030 3,026 (0.1) 3,489 3,483 (0.2)
Total income 13,392 13,477 0.6 15,437 15,627 1.2
Operating expenses 5,506 5,506 - 6,552 6,552 -
Pre-prov. profit 7,886 7,971 1.1 8,885 9,075 2.1
Provisions & cont. 1,812 1,809 (0.2) 1,946 1,980 1.7
PBT 6,074 6,162 1.5 6,939 7,095 2.3
Prov. for taxes 2,065 2,095 1.5 2,359 2,412 2.3
PAT 4,009 4,067 1.5 4,580 4,683 2.3
Source: Company, Angel Research
Exhibit 12: P/ABV band
1600 Price 0.25x 0.65x 1.05x 1.45x 1.85x
1400
1200
1000
800
600
400
200
0
Oct-02
Oct-07
Sep-05
Feb-06
Sep-10
Feb-11
Nov-04
Nov-09
May-02
May-07
Jun-04
Jun-09
Dec-06
Jan-04
Jan-09
Aug-03
Apr-05
Jul-06
Aug-08
Apr-10
Mar-03
Mar-08
Source: Company, Angel Research
July 27, 2010 8
12. Punjab National Bank | 1QFY2011 Result Update
Research Team Tel: 022 - 4040 3800 E-mail: research@angeltrade.com Website: www.angeltrade.com
DISCLAIMER
This document is solely for the personal information of the recipient, and must not be singularly used as the basis of any investment
decision. Nothing in this document should be construed as investment or financial advice. Each recipient of this document should make
such investigations as they deem necessary to arrive at an independent evaluation of an investment in the securities of the companies
referred to in this document (including the merits and risks involved), and should consult their own advisors to determine the merits and
risks of such an investment.
Angel Broking Limited, its affiliates, directors, its proprietary trading and investment businesses may, from time to time, make
investment decisions that are inconsistent with or contradictory to the recommendations expressed herein. The views contained in this
document are those of the analyst, and the company may or may not subscribe to all the views expressed within.
Reports based on technical and derivative analysis center on studying charts of a stock's price movement, outstanding positions and
trading volume, as opposed to focusing on a company's fundamentals and, as such, may not match with a report on a company's
fundamentals.
The information in this document has been printed on the basis of publicly available information, internal data and other reliable
sources believed to be true, but we do not represent that it is accurate or complete and it should not be relied on as such, as this
document is for general guidance only. Angel Broking Limited or any of its affiliates/ group companies shall not be in any way
responsible for any loss or damage that may arise to any person from any inadvertent error in the information contained in this report.
Angel Broking Limited has not independently verified all the information contained within this document. Accordingly, we cannot testify,
nor make any representation or warranty, express or implied, to the accuracy, contents or data contained within this document. While
Angel Broking Limited endeavours to update on a reasonable basis the information discussed in this material, there may be regulatory,
compliance, or other reasons that prevent us from doing so.
This document is being supplied to you solely for your information, and its contents, information or data may not be reproduced,
redistributed or passed on, directly or indirectly.
Angel Broking Limited and its affiliates may seek to provide or have engaged in providing corporate finance, investment banking or
other advisory services in a merger or specific transaction to the companies referred to in this report, as on the date of this report or in
the past.
Neither Angel Broking Limited, nor its directors, employees or affiliates shall be liable for any loss or damage that may arise from or in
connection with the use of this information.
Note: Please refer to the important `Stock Holding Disclosure' report on the Angel website (Research Section). Also, please
refer to the latest update on respective stocks for the disclosure status in respect of those stocks. Angel Broking Limited and
its affiliates may have investment positions in the stocks recommended in this report.
Disclosure of Interest Statement Punjab National Bank
1. Analyst ownership of the stock No
2. Angel and its Group companies ownership of the stock Yes
3. Angel and its Group companies' Directors ownership of the stock No
4. Broking relationship with company covered No
Note: We have not considered any Exposure below Rs 1 lakh for Angel, its Group companies and Directors.
Ratings (Returns): Buy (> 15%) Accumulate (5% to 15%) Neutral (-5 to 5%)
Reduce (-5% to 15%) Sell (< -15%)
July 27, 2010 12