(INDIRA) Call Girl Mumbai Call Now 8250077686 Mumbai Escorts 24x7
Prakash Indutries
1. 1QFY2011 Result Update | Steel
August 6, 2010
Prakash Industries BUY
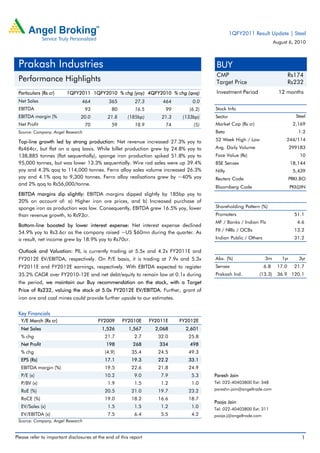
CMP Rs174
Performance Highlights Target Price Rs232
Particulars (Rs cr) 1QFY2011 1QFY2010 % chg (yoy) 4QFY2010 % chg (qoq) Investment Period 12 months
Net Sales 464 365 27.3 464 0.0
EBITDA 93 80 16.5 99 (6.2) Stock Info
EBITDA margin (% 20.0 21.8 (185bp) 21.3 (133bp) Sector Steel
Net Profit 70 59 18.9 74 (5) Market Cap (Rs cr) 2,169
Source: Company, Angel Research Beta 1.2
Top-line growth led by strong production: Net revenue increased 27.3% yoy to 52 Week High / Low 244/114
Rs464cr, but flat on a qoq basis. While billet production grew by 24.8% yoy to Avg. Daily Volume 299183
138,885 tonnes (flat sequentially), sponge iron production spiked 51.8% yoy to Face Value (Rs) 10
95,000 tonnes, but was lower 13.3% sequentially. Wire rod sales were up 39.4% BSE Sensex 18,144
yoy and 4.3% qoq to 114,000 tonnes. Ferro alloy sales volume increased 26.3% Nifty 5,439
yoy and 4.1% qoq to 9,300 tonnes. Ferro alloy realisations grew by ~40% yoy Reuters Code PRKI.BO
and 2% qoq to Rs56,000/tonne.
Bloomberg Code PKI@IN
EBITDA margins dip slightly: EBITDA margins dipped slightly by 185bp yoy to
20% on account of: a) Higher iron ore prices, and b) Increased purchase of
sponge iron as production was low. Consequently, EBITDA grew 16.5% yoy, lower Shareholding Pattern (%)
than revenue growth, to Rs93cr. Promoters 51.1
MF / Banks / Indian Fls 4.6
Bottom-line boosted by lower interest expense: Net interest expense declined
FII / NRIs / OCBs 13.2
54.9% yoy to Rs3.6cr as the company raised ~US $60mn during the quarter. As
a result, net income grew by 18.9% yoy to Rs70cr. Indian Public / Others 31.2
Outlook and Valuation: PIL is currently trading at 5.5x and 4.2x FY2011E and
FY2012E EV/EBITDA, respectively. On P/E basis, it is trading at 7.9x and 5.3x Abs. (%) 3m 1yr 3yr
FY2011E and FY2012E earnings, respectively. With EBITDA expected to register Sensex 6.8 17.0 21.7
35.2% CAGR over FY2010-12E and net debt/equity to remain low at 0.1x during Prakash Ind. (13.3) 36.9 120.1
the period, we maintain our Buy recommendation on the stock, with a Target
Price of Rs232, valuing the stock at 5.0x FY2012E EV/EBITDA. Further, grant of
iron ore and coal mines could provide further upside to our estimates.
Key Financials
Y/E March (Rs cr) FY2009 FY2010E FY2011E FY2012E
Net Sales 1,526 1,567 2,068 2,601
% chg 21.7 2.7 32.0 25.8
Net Profit 198 268 334 498
% chg (4.9) 35.4 24.5 49.3
EPS (Rs) 17.1 19.3 22.2 33.1
EBITDA margin (%) 19.5 22.6 21.8 24.9
P/E (x) 10.2 9.0 7.9 5.3 Paresh Jain
P/BV (x) 1.9 1.5 1.2 1.0 Tel: 022-40403800 Ext: 348
RoE (%) 20.5 21.0 19.7 23.2 pareshn.jain@angeltrade.com
RoCE (%) 19.0 18.2 16.6 18.7
Pooja Jain
EV/Sales (x) 1.5 1.5 1.2 1.0 Tel: 022-40403800 Ext: 311
EV/EBITDA (x) 7.5 6.4 5.5 4.2 pooja.j@angeltrade.com
Source: Company, Angel Research
Please refer to important disclosures at the end of this report 1
2. Prakash | 1QFY2011 Result Update
Exhibit 1: 1QFY2011 performance
Y/E March (Rs cr) 1QFY11 1QFY10 yoy % FY2010 FY2009 yoy %
Net sales 464 365 27.3 1,567 1,526 2.7
Raw material 284 216 31.7 890 964 (7.7)
% of net sales 61.2 59.2 56.8 63.2
Manufacturing expenses 56 44 27.8 195 162 20.5
% of net sales 12.1 12.0 12.5 10.6
Staff cost 18 14 34.1 68 54 26.1
% of net sales 3.9 3.7 4.3 3.5
Other expenditure 13 12 11.2 59 49 22.4
% of net sales 2.8 3.2 3.8 3.2
Total expenditure 372 285 30.3 1,213 1,228 (1.3)
% of net sales 80.0 78.2 77.4 80.5
Operating profit 93 80 16.5 354 298 19.1
OPM (%) 20.0 21.8 22.6 19.5
Other operating income 0 0 0 0
EBIDTA 93 80 16.5 354 298 19.1
EBITDA margins (%) 20.0 21.8 22.6 19.5
Interest 4 8 (54.9) 25 61 (57.9)
Depreciation 17 13 31.2 57 42 33.7
Other income 2 0 417.6 3 4 (23.3)
Exceptional items 0 0 (2) 6
Profit before tax 74 59 25.5 273 205 33.4
% of net sales 15.8 16.1 17.4 13.4
Tax 4 0 7 1 1,067.8
% of PBT 5.2 0.0 2.6 0.3
Adj. Net income 70 59 18.9 268 198 35.4
% of net sales 15.0 16.1 17.1 13.0
EPS (Rs) 5.2 5.1 1.9 19.3 17.1 12.3
Source: Company, Angel Research
Exhibit 2: EBITDA margin trend Exhibit 3: Net profit trend
120 30 80 20
100 25 70
60 15
80 20 50
(Rs cr)
(Rs cr)
60 15 40 10
(%)
(%)
40 10 30
20 5
20 5 10
0 0 0 0
1QFY10 2QFY10 3QFY10 4QFY10 1QFY11 1QFY10 2QFY10 3QFY10 4QFY10 1QFY11
EBITDA (LHS) EBITDA margin (RHS) Net profit (LHS) Net profit margin (RHS)
Source: Company, Angel research Source: Company, Angel research
August 6, 2010 2
3. Prakash | 1QFY2011 Result Update
Exhibit 4: Production Volume
(tonnes) 1QFY10 2QFY10 3QFY10 4QFY10 1QFY11 yoy % qoq %
Sponge Iron 62,579 81,185 81,663 109,573 95,000 51.8 (13.3)
Billet 111,307 124,162 132,096 139,435 138,885 24.8 (0.4)
Structural steel 26,025 9,576 6,139 30,260 9,000 (65.4) (70.3)
Wire Rod 83,260 103,637 109,020 107,083 114,000 36.9 6.5
Ferro Alloy 9,608 10,488 11,646 12,258 11,503 19.7 (6.2)
Power (mn units) 145 148 145 160 150 3.7 (6.3)
Source: Company, Angel Research
Exhibit 5: Sales volume
(tonnes) 1QFY10 2QFY10 3QFY10 4QFY10 1QFY11 yoy % qoq %
Billets 12,193 16,482 11,089 5,236 9,000 (26.2) 71.9
Structural steel 24,519 10,399 4,439 28,643 10,000 (59.2) (65.1)
Wire Rod 81,773 101,454 105,511 109,262 114,000 39.4 4.3
Ferro Alloy 7,361 9,008 9,699 8,932 9,300 26.3 4.1
Source: Company, Angel Research
Key Concall takeaways
During the quarter sponge iron production was lower by 13.3% qoq at 95,000
tonnes as 2 kilns were shut down for 40-45 days each on account of
maintenance activities. Consequently, power production was also lower by
6.3% qoq at 15cr units.
EBITDA margins were lower on account of: a) higher raw material cost, and
b) increased purchase of sponge iron on account of lower production.
Average iron ore cost increased by ~50% yoy to Rs5,400/tonne. Average cost
of purchase of sponge iron ore was Rs16,500/tonne as compared to
production cost of Rs11,000-11,500.
Average realisation for ferro alloys was Rs56,000/tonne, up by ~40% yoy.
Cost of production was ~Rs38,000 tonne. Landed cost of manganese ore was
Rs8,500/tonne during the quarter.
Sponge iron capacity of 0.2mn tonnes each will be added by Mar’11, Sep’11
and Mar’12 as compared to the earlier planned schedule of Mar’11, Mar’12
and Mar’13. Post the expansion, sponge iron capacity will increase to 1.2mn
tonnes from 0.6mn tonnes by Mar’12, a year earlier than the original plan.
Billet capacity of 0.3mn tonnes is expected to come by June’11, 3 months later
than the planned schedule.
Management indicated that it has modified the plan for the 625MW power
plant. Commissioning of 125MW is expected to begin from Nov’10-Mar’11 as
planned. Two units of 100MW each are expected to come on-stream by
Mar’12 and Mar’13 as compared to the earlier plan of 125MW units. Balance
capacity will come on-stream by Mar’14 and Mar’15.
During the quarter, the company incurred a capex of ~Rs135cr. Net cash at
the end of the quarter stood at Rs200cr.
Sponge iron prices have increased over the last few days. Currently, prices are
hovering in the range of Rs16,700-17,000, an increase of Rs1,500-2,000
from the lows witnessed at the end of June.
Sponge iron production in 2QFY2011 is expected to be ~1,10,000 tonnes.
August 6, 2010 3
4. Prakash | 1QFY2011 Result Update
Exhibit 6: Status of mining lease
Reserves
Raw Material Mine Location Grade Status
(mn tonnes)
Clearance received from State, awaiting forest clearance from
Iron ore Kawardha Chhattisgarh 66-67% Fe 75
Central government
Awaiting for forest and environmental clearance from State
Iron ore Sirkaguttu Orissa 65% Fe 10
government
Coal Madanpur Chhattisgarh C,D 50 Has been placed under “No Go” area
Coal Fatehpur Chhattisgarh E,F 46 At a preliminary stage
Source: Company, Angel Research
Investment Rationale
Expanding capacity to address imbalance and enhancing integration:
Currently, PIL sources ~30% of its sponge iron requirement from third parties.
In its bid to reduce this dependence on external parties, the company is
expanding its billet capacity from 0.7mn tonnes to 1.0mn tonnes by June
2011E and sponge iron capacity from 0.6mn tonnes to 1.2mn tonnes by
FY2012E. As new iron ore and coal mines are granted along with the existing
Chotia coal mine, PIL will steadily move towards a fully integrated business
model.
Net long on power from 4QFY2011E: PIL is expanding its power capacity
from 100MW to 775MW by March 2015E. The company is setting up a
625MW coal-based power plant, with each unit being set up in 12 months
starting 4QFY2011E. Thus, with the commissioning of the first 125MW unit by
4QFY2011E, PIL will become a net seller of power in FY2012E. Further, as the
company's sponge iron capacity increases, the waste heat-based power
capacity will increase from 25MW to 75MW.
Capex funding not a constraint: PIL has raised US $110mn through FCCBs
over the last six months to fund its capex plan of Rs3,300cr. As capacity gets
added in a modular structure, the company's net debt/equity is likely to be
stable at 0.1x over FY2010-12E as internal accruals will be sufficient to fund
its capex requirements.
August 6, 2010 4
5. Prakash | 1QFY2011 Result Update
Outlook and Valuation
PIL is currently trading at 5.5x and 4.2x FY2011E and FY2012E EV/EBITDA,
respectively. On P/E basis, it is trading at 7.9x and 5.3x FY2011E and FY2012E
earnings, respectively. With EBITDA expected to register 35.2% CAGR over
FY2010-12E and net debt/equity to remain low at 0.1x during the period, we
maintain our Buy recommendation on the stock, with a Target Price of Rs232,
valuing the stock at 5.0x FY2012E EV/EBITDA. Further, grant of iron ore and coal
mines could provide further upside to our estimates.
Exhibit 7: Key assumptions
FY2011E FY2012E
Sales volume (tonnes)
Billets 50,000 131,933
Finished steel 570,000 607,500
Ferro Alloys 40,656 40,656
Power (mn units) - 464
Gross average realization (Rs/tonne)
Billets 26,700 27,250
Finished steel 30,700 31,250
Ferro Alloys 60,000 65,000
Power (Rs/unit) - 4.0
Average cost (Rs/tonne)
Iron ore 6,250 6,500
Mn ore 8,500 9,000
Source: Company, Angel Research
Exhibit 8: EPS - Angel forecast v/s consensus
Year (%) Angel forecast Bloomberg consensus Variation (%)
FY11E 22.2 22.4 (1.2)
FY12E 33.1 36.2 (8.7)
Source: Bloomberg, Angel Research
August 6, 2010 5
12. Prakash | 1QFY2011 Result Update
Research Team Tel: 022 - 4040 3800 E-mail: research@angeltrade.com Website: www.angeltrade.com
DISCLAIMER
This document is solely for the personal information of the recipient, and must not be singularly used as the basis of any investment
decision. Nothing in this document should be construed as investment or financial advice. Each recipient of this document should make
such investigations as they deem necessary to arrive at an independent evaluation of an investment in the securities of the companies
referred to in this document (including the merits and risks involved), and should consult their own advisors to determine the merits and
risks of such an investment.
Angel Broking Limited, its affiliates, directors, its proprietary trading and investment businesses may, from time to time, make
investment decisions that are inconsistent with or contradictory to the recommendations expressed herein. The views contained in this
document are those of the analyst, and the company may or may not subscribe to all the views expressed within.
Reports based on technical and derivative analysis center on studying charts of a stock's price movement, outstanding positions and
trading volume, as opposed to focusing on a company's fundamentals and, as such, may not match with a report on a company's
fundamentals.
The information in this document has been printed on the basis of publicly available information, internal data and other reliable
sources believed to be true, but we do not represent that it is accurate or complete and it should not be relied on as such, as this
document is for general guidance only. Angel Broking Limited or any of its affiliates/ group companies shall not be in any way
responsible for any loss or damage that may arise to any person from any inadvertent error in the information contained in this report.
Angel Broking Limited has not independently verified all the information contained within this document. Accordingly, we cannot testify,
nor make any representation or warranty, express or implied, to the accuracy, contents or data contained within this document. While
Angel Broking Limited endeavours to update on a reasonable basis the information discussed in this material, there may be regulatory,
compliance, or other reasons that prevent us from doing so.
This document is being supplied to you solely for your information, and its contents, information or data may not be reproduced,
redistributed or passed on, directly or indirectly.
Angel Broking Limited and its affiliates may seek to provide or have engaged in providing corporate finance, investment banking or
other advisory services in a merger or specific transaction to the companies referred to in this report, as on the date of this report or in
the past.
Neither Angel Broking Limited, nor its directors, employees or affiliates shall be liable for any loss or damage that may arise from or in
connection with the use of this information.
Note: Please refer to the important `Stock Holding Disclosure' report on the Angel website (Research Section). Also, please
refer to the latest update on respective stocks for the disclosure status in respect of those stocks. Angel Broking Limited and
its affiliates may have investment positions in the stocks recommended in this report.
Disclosure of Interest Statement Prakash Industries
1. Analyst ownership of the stock No
2. Angel and its Group companies ownership of the stock No
3. Angel and its Group companies' Directors ownership of the stock No
4. Broking relationship with company covered No
Note: We have not considered any Exposure below Rs 1 lakh for Angel, its Group companies and Directors.
Ratings (Returns) : Buy (> 15%) Accumulate (5% to 15%) Neutral (-5 to 5%)
Reduce (-5% to 15%) Sell (< -15%)
August 6, 2010 12