Call Girls Moshi Call Me 7737669865 Budget Friendly No Advance Booking
04Drought_Prone_Area.pdf
1. Drought Prone Area
Droughts are a normal part of the climate that occurs all around the world, even including deserts and
rainforests. Drought is a slow on-set, year-to-year basis hazard affecting many economic sectors and people at
any one time. It has direct consequences on agriculture and food security, hydropower generation and industry,
human and animal health, livelihood security, and indirect consequences such as personal security (for example,
women walking long distances to fetch water) and access to education (for example, girls not attending school
because of increased time spent on fetching water). The hazard footprints of droughts are typically larger than
those for other hazards, which are usually constrained to floodplains, coastal regions, mountainous regions,
storm tracks or fault zones. Drought requires monitoring and because of its slow nature, it allows ample time
to observe changes in precipitation, temperature, vegetation and the overall status of surface water and
groundwater supplies in a region. In the agricultural sector, drought causes stress to vegetation and crops; hence
the extent of a drought can be reflected by changes in the vegetation condition. Drought indicators or indices
are often used to help track droughts, and these tools vary depending on the region and the season.
There are generally five types of droughts: meteorological, hydrological, agricultural, ecological and
socioeconomic. In this report, indices associated with droughts derived from remote sensing are focused. One
of such indices is the Normalized Difference Vegetation Index (NDVI). It is simple and effective and one of
the most widely used indices for detecting drought conditions. More recently, many other indices have been
developed, such as the Vegetation Condition Index (VCI), which is an indicator of the status of vegetation
cover as a function of NDVI minima and maxima encountered for a given ecosystem over many years, or the
Vegetation Health Index (VHI), which combines the VCI and land surface temperature or Temperature
Condition Index (TCI). VHI is one of the first attempts to monitor and identify drought-related agricultural
impacts using remotely sensed data. It incorporates the drought of the vegetation stressed by temperature.
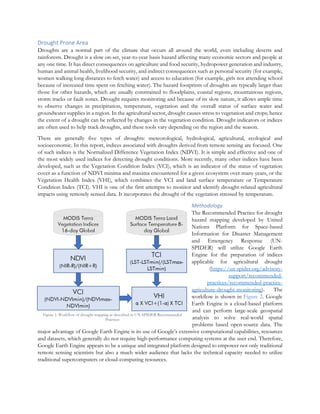
Methodology
The Recommended Practice for drought
hazard mapping developed by United
Nations Platform for Space-based
Information for Disaster Management
and Emergency Response (UN-
SPIDER) will utilize Google Earth
Engine for the preparation of indices
applicable for agricultural drought
(https://un-spider.org/advisory-
support/recommended-
practices/recommended-practice-
agriculture-drought-monitoring). The
workflow is shown in Figure 2. Google
Earth Engine is a cloud-based platform
and can perform large-scale geospatial
analysis to solve real-world spatial
problems based open-source data. The
major advantage of Google Earth Engine is its use of Google’s extensive computational capabilities, resources
and datasets, which generally do not require high-performance computing systems at the user end. Therefore,
Google Earth Engine appears to be a unique and integrated platform designed to empower not only traditional
remote sensing scientists but also a much wider audience that lacks the technical capacity needed to utilize
traditional supercomputers or cloud-computing resources.
Figure 1: Workflow of drought mapping as described in UN-SPIDER Recommended
Practices
2. Remote sensing has been widely used to monitor and perform early warnings of natural disasters via indicators
and indices. To study droughts, satellite-derived drought indicators measured from satellite-derived surface
parameters have been commonly used. Some of them are as follows:
1. Normalized Difference Vegetation Index (NDVI)
When sunlight is incident on a plant, mostly the red bandwidth in the visible part of the electromagnetic
radiation spectrum (0.4–0.7 mm) is absorbed by chlorophyll in the leaves, whereas the cell formation of leaves
reflects the bulk of near-infrared (NIR) radiation (0.7–1.1 mm). Healthy vegetation absorbs red light and reflects
NIR radiation. Usually, if there is extra reflected radiation in the NIR range than the visible, then vegetation
will be healthy (dense). NDVI is an excellent proxy of green biomass, leaf area index, and patterns of
production. The NDVI range varies from −1 to +1, with values near zero representing no green vegetation
and values near +1 showing the highest possible density of vegetation. Areas of barren rock, sand, and snow
produce NDVI values of <0.1, while shrub and grassland typically produce NDVI values of 0.2–0.3, and
temperate and tropical rainforests produce values in the 0.6–0.8 range. The NDVI is calculated with the
following formula:
NDVI = NIR – RED / NIR + RED
2. Vegetation Condition Index (VCI)
The VCI is an indicator of the status of vegetation cover as a function of NDVI minima and maxima
encountered for a given ecosystem over many years. It is a better indicator of water stress conditions than the
NDVI. The deviation of the vegetation condition is an indicator of the intensity of the impact of drought on
vegetation growth. The VCI is calculated using the following formula:
VCIj = (NDVIj - NDVImin) / (NDVImax - NDVImin) × 100
Where NDVImax and NDVImin are the maximum and minimum NDVI values in a multi-year dataset. The ‘j’ is
the NDVI value for the current month.
3. Temperature Condition Index (TCI)
Land surface temperature (LST) derived from thermal radiance bands is a good indicator of the energy balance
of the Earth’s surface, because temperatures rise quickly under water stress. The TCI acts as an initial indicator
of water stress and drought. It is calculated using the following formula.
TCIj = (LSTj - LSTmin) / (LSTmax - LSTmin) × 100
Where, LSTmax and LSTmin are the maximum and minimum LST values in a multi-year dataset. The ‘j’ is the
LST value for the current month.
4. Vegetation Health Index (VHI)
The VHI is a combination of the constructed VCI and TCI and can be used effectively for drought assessments.
It can be calculated using the following formula.
VHI = α × VCI + (1 - α) × TCI
where α is the weight to measure the contribution of the VCI and TCI for assessing the status of drought.
Generally, α is set as 0.5 because it is difficult to distinguish the contribution of the surface temperature and
the NDVI when measuring drought stress. The output raster of the previous steps was categorized into the
drought severity zones so that the extent of drought could be analyzed in the affected region. VHI values vary
between 0 and 1 and the raster image was classified as per the criteria mentioned in Table 9.
3. Table 1: Criteria to categorize drought classes
Values Drought
<0.1 Extreme
<0.2 Severe
<0.3 Moderate
<0.4 Mild
>=0.4 No
The drought hazard index maps produced from the algorithm can be overlaid with detailed available land use
maps or agricultural/crop maps in GIS applications such as QGIS or ArcGIS for further analysis.
The requirements to use the Recommended practice are as follows:
1. Google Earth Engine account is required to use the code.
2. Some storage left on Google Drive (20 MB- 1GB, depending on the size of the study area)
3. A stable internet connection is required as the processing is done on a cloud-based platform and the
results are run through Google Earth Engine’s own JavaScript code.
4. Polygon or administrative boundary of the study area will be helpful.
5. Historical records of drought or dry season dates are required to assign dates in the code.
The input data required for flood mapping is shown in Table 10.
Table 2: Input data table for estimating the drought hazard
Variable Sensor/Dataset Spatial resolution Extent
NDVI MODIS Terra Vegetation Indices(16-day) 250 m Global
LST MODIS Terra Land Surface Temperature (8-day) 250 m Global