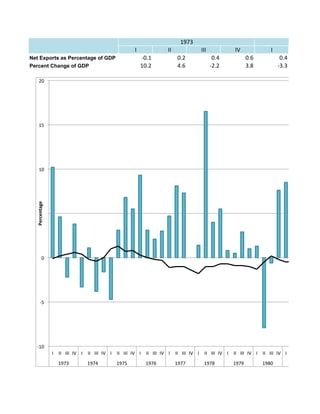
SlideShare une entreprise Scribd logo
1  sur  24
Télécharger pour lire hors ligne
I II III IV I
Net Exports as Percentage of GDP -­‐0.1 0.2 0.4 0.6 0.4
Percent Change of GDP 10.2 4.6 -­‐2.2 3.8 -­‐3.3
	
  
1973 19
-­‐10	
  
-­‐5	
  
0	
  
5	
  
10	
  
15	
  
20	
  
I	
   II	
   III	
   IV	
   I	
   II	
   III	
   IV	
   I	
   II	
   III	
   IV	
   I	
   II	
   III	
   IV	
   I	
   II	
   III	
   IV	
   I	
   II	
   III	
   IV	
   I	
   II	
   III	
   IV	
   I	
   II	
   III	
   IV	
   I	
  
1973	
   1974	
   1975	
   1976	
   1977	
   1978	
   1979	
   1980	
  
Percentage	
  
II III IV I II III IV
-­‐0.2 -­‐0.4 0 1 1.3 0.7 0.8
1.1 -­‐3.8 -­‐1.6 -­‐4.7 3.1 6.8 5.5
1974 1975
II	
   III	
   IV	
   I	
   II	
   III	
   IV	
   I	
   II	
   III	
   IV	
   I	
   II	
   III	
   IV	
   I	
   II	
   III	
   IV	
   I	
   II	
   III	
   IV	
   I	
   II	
   III	
   IV	
   I	
   II	
   III	
   IV	
   I	
   II	
  
1981	
   1982	
   1983	
   1984	
   1985	
   1986	
   1987	
   1988	
   1989	
  
I II III IV I II III
0.3 0 -­‐0.2 -­‐0.3 -­‐1.1 -­‐1 -­‐1
9.3 3.1 2.1 3 4.7 8.1 7.3
1976 1977
II	
   III	
   IV	
   I	
   II	
   III	
   IV	
   I	
   II	
   III	
   IV	
   I	
   II	
   III	
   IV	
   I	
   II	
   III	
   IV	
   I	
   II	
   III	
   IV	
   I	
   II	
   III	
   IV	
   I	
   II	
   III	
   IV	
   I	
   II	
   III	
  
1989	
   1990	
   1991	
   1992	
   1993	
   1994	
   1995	
   1996	
   1997	
  
Quarters	
  1973-­‐2013	
  
Quarterly	
  Data	
  from	
  1973	
  to	
  2013	
  
Percent	
  Change	
  of	
  GDP	
  and	
  Net	
  Exports	
  as	
  a	
  Percentage	
  of	
  GDP	
  
IV I II III IV I II
-­‐1.4 -­‐1.8 -­‐1 -­‐1 -­‐0.7 -­‐0.7 -­‐0.9
0 1.4 16.5 4 5.5 0.8 0.5
7 1978 1979
III	
   IV	
   I	
   II	
   III	
   IV	
   I	
   II	
   III	
   IV	
   I	
   II	
   III	
   IV	
   I	
   II	
   III	
   IV	
   I	
   II	
   III	
   IV	
   I	
   II	
   III	
   IV	
   I	
   II	
   III	
   IV	
   I	
   II	
   III	
  
1997	
   1998	
   1999	
   2000	
   2001	
   2002	
   2003	
   2004	
   2005	
  
III IV I II III IV I
-­‐0.9 -­‐1 -­‐1.3 -­‐0.5 0.2 -­‐0.2 -­‐0.5
2.9 1 1.3 -­‐7.9 -­‐0.6 7.6 8.5
1979 1980 1981
III	
   IV	
   I	
   II	
   III	
   IV	
   I	
   II	
   III	
   IV	
   I	
   II	
   III	
   IV	
   I	
   II	
   III	
   IV	
   I	
   II	
   III	
   IV	
   I	
   II	
   III	
   IV	
   I	
   II	
   III	
   IV	
   I	
   II	
   III	
   IV	
  
2005	
   2006	
   2007	
   2008	
   2009	
   2010	
   2011	
   2012	
   2013	
  
Percent	
  Change	
  of	
  GDP	
  
Net	
  Exports	
  as	
  Percentage	
  of	
  GDP	
  
II III IV I II III IV
-­‐0.4 -­‐0.2 -­‐0.4 -­‐0.5 -­‐0.1 -­‐0.9 -­‐0.9
-­‐2.9 4.7 -­‐4.6 -­‐6.5 2.2 -­‐1.4 0.4
19821981
-­‐10	
  
-­‐5	
  
0	
  
5	
  
10	
  
15	
  
20	
  
IV	
  
Percent	
  Change	
  
rcentage	
  of	
  GDP	
  
I II III IV I II III
-­‐0.7 -­‐1.3 -­‐1.8 -­‐1.9 -­‐2.4 -­‐2.6 -­‐2.5
5.3 9.4 8.1 8.5 8.2 7.2 4
1983 1984
IV I II III IV I II
-­‐2.6 -­‐2.2 -­‐2.7 -­‐2.7 -­‐3 -­‐2.8 -­‐2.8
3.2 4 3.7 6.4 3 3.8 1.9
4 1985 1986
III IV I II III IV I
-­‐3 -­‐2.9 -­‐3 -­‐3 -­‐3 -­‐2.9 -­‐2.4
4.1 2.1 2.8 4.6 3.7 6.8 2.3
1986 1987 1988
II III IV I II III IV
-­‐2 -­‐1.9 -­‐2 -­‐1.8 -­‐1.6 -­‐1.3 -­‐1.4
5.4 2.3 5.4 4.1 3.2 3 0.9
1988 1989
I II III IV I II III
-­‐1.5 -­‐1.2 -­‐1.2 -­‐1.3 -­‐0.8 -­‐0.4 -­‐0.3
4.5 1.6 0.1 -­‐3.4 -­‐1.9 3.1 1.9
1990 1991
IV I II III IV I II
-­‐0.4 -­‐0.3 -­‐0.5 -­‐0.6 -­‐0.7 -­‐0.8 -­‐0.9
1.8 4.8 4.5 3.9 4.1 0.8 2.4
1 1992 1993
III IV I II III IV I
-­‐1 -­‐1 -­‐1.1 -­‐1.2 -­‐1.3 -­‐1.4 -­‐1.4
2 5.4 4 5.6 2.4 4.6 1.4
19941993 1995
II III IV I II III IV
-­‐1.4 -­‐1 -­‐0.9 -­‐1.1 -­‐1.2 -­‐1.4 -­‐1.1
1.4 3.5 2.9 2.7 7.2 3.7 4.3
1995 1996
I II III IV I II III
-­‐1.3 -­‐1 -­‐1.1 -­‐1.3 -­‐1.5 -­‐1.8 -­‐1.9
3.1 6.2 5.2 3.1 4 3.9 5.3
1997 1998
IV I II III IV I II
-­‐1.9 -­‐2.2 -­‐2.6 -­‐2.8 -­‐3 -­‐3.5 -­‐3.5
6.7 3.2 3.3 5.1 7.1 1.2 7.8
8 1999 2000
III IV I II III IV I
-­‐3.8 -­‐3.8 -­‐3.7 -­‐3.4 -­‐3.4 -­‐3.3 -­‐3.5
0.5 2.3 -­‐1.1 2.1 -­‐1.3 1.1 3.7
2000 2001 2002
II III IV I II III IV
-­‐3.8 -­‐3.9 -­‐4.3 -­‐4.5 -­‐4.4 -­‐4.3 -­‐4.3
2.2 2 0.3 2.1 3.8 6.9 4.8
2002 2003
I II III IV I II III
-­‐4.6 -­‐5 -­‐5.2 -­‐5.4 -­‐5.3 -­‐5.3 -­‐5.5
2.3 3 3.7 3.5 4.3 2.1 3.4
2004 2005
IV I II III IV I II
-­‐5.9 -­‐5.7 -­‐5.7 -­‐5.8 -­‐5.1 -­‐5.1 -­‐5.1
2.3 4.9 1.2 0.4 3.2 0.2 3.1
20065 2007
III IV I II III IV I
-­‐4.9 -­‐4.8 -­‐5.2 -­‐5.1 -­‐5.2 -­‐4.1 -­‐2.7
2.7 1.4 -­‐2.7 2 -­‐1.9 -­‐8.2 -­‐5.4
2007 2008 2009
II III IV I II III IV
-­‐2.4 -­‐2.8 -­‐3 -­‐3.3 -­‐3.5 -­‐3.6 -­‐3.3
-­‐0.5 1.3 3.9 1.7 3.9 2.7 2.5
2009 2010
I II III IV I II III
-­‐3.7 -­‐3.8 -­‐3.7 -­‐3.8 -­‐3.9 -­‐3.7 -­‐3.3
-­‐1.5 2.9 0.8 4.6 2.3 1.6 2.5
2011 2012
IV I II III IV
-­‐3.2 -­‐3.2 -­‐3.2 -­‐3 -­‐2.7
0.1 2.7 1.8 4.5 3.5
20132

Contenu connexe

En vedette

En vedette (8)

Who Are You? Branding Your Nonprofit
Who Are You? Branding Your NonprofitWho Are You? Branding Your Nonprofit
Who Are You? Branding Your Nonprofit
 
2016_englishcv
2016_englishcv2016_englishcv
2016_englishcv
 
CHEVROLET QATAR 2016 SPECIAL OFFERS FOR CORPORATES FLEETS
CHEVROLET QATAR 2016 SPECIAL OFFERS FOR CORPORATES FLEETSCHEVROLET QATAR 2016 SPECIAL OFFERS FOR CORPORATES FLEETS
CHEVROLET QATAR 2016 SPECIAL OFFERS FOR CORPORATES FLEETS
 
FattoreMamma - Profile
FattoreMamma - ProfileFattoreMamma - Profile
FattoreMamma - Profile
 
Plaquette bbchoo
Plaquette bbchooPlaquette bbchoo
Plaquette bbchoo
 
B
BB
B
 
Industrial training report
Industrial training reportIndustrial training report
Industrial training report
 
‘India and Africa – collaboration for growth’
‘India and Africa – collaboration for growth’   ‘India and Africa – collaboration for growth’
‘India and Africa – collaboration for growth’
 

Similaire à Data Gathering Project Net Exports

Unctad sl fdi statistics 2006
Unctad sl fdi statistics 2006Unctad sl fdi statistics 2006
Unctad sl fdi statistics 2006Chris Jasabe
 
11.price and income elasticities of disaggregated import demand
11.price and income elasticities of disaggregated import demand11.price and income elasticities of disaggregated import demand
11.price and income elasticities of disaggregated import demandAlexander Decker
 
Fhlb presentation
Fhlb presentationFhlb presentation
Fhlb presentationNar Res
 
Annual Growth Rates of Real GDP Per Capita(in percents)Ending .pdf
Annual Growth Rates of Real GDP Per Capita(in percents)Ending .pdfAnnual Growth Rates of Real GDP Per Capita(in percents)Ending .pdf
Annual Growth Rates of Real GDP Per Capita(in percents)Ending .pdfshalini518936
 
May 2015 Jobs Report Observations (Grant Toch)
May 2015 Jobs Report Observations (Grant Toch)May 2015 Jobs Report Observations (Grant Toch)
May 2015 Jobs Report Observations (Grant Toch)Grant Toch
 

Similaire à Data Gathering Project Net Exports (9)

Unctad sl fdi statistics 2006
Unctad sl fdi statistics 2006Unctad sl fdi statistics 2006
Unctad sl fdi statistics 2006
 
11.price and income elasticities of disaggregated import demand
11.price and income elasticities of disaggregated import demand11.price and income elasticities of disaggregated import demand
11.price and income elasticities of disaggregated import demand
 
Fhlb presentation
Fhlb presentationFhlb presentation
Fhlb presentation
 
G7 Labour Market Dashboard
G7 Labour Market DashboardG7 Labour Market Dashboard
G7 Labour Market Dashboard
 
Annual Growth Rates of Real GDP Per Capita(in percents)Ending .pdf
Annual Growth Rates of Real GDP Per Capita(in percents)Ending .pdfAnnual Growth Rates of Real GDP Per Capita(in percents)Ending .pdf
Annual Growth Rates of Real GDP Per Capita(in percents)Ending .pdf
 
May 2015 Jobs Report Observations (Grant Toch)
May 2015 Jobs Report Observations (Grant Toch)May 2015 Jobs Report Observations (Grant Toch)
May 2015 Jobs Report Observations (Grant Toch)
 
Indec def
Indec defIndec def
Indec def
 
Def
DefDef
Def
 
Petroleum Stats
Petroleum StatsPetroleum Stats
Petroleum Stats
 

Data Gathering Project Net Exports

  • 1. I II III IV I Net Exports as Percentage of GDP -­‐0.1 0.2 0.4 0.6 0.4 Percent Change of GDP 10.2 4.6 -­‐2.2 3.8 -­‐3.3   1973 19 -­‐10   -­‐5   0   5   10   15   20   I   II   III   IV   I   II   III   IV   I   II   III   IV   I   II   III   IV   I   II   III   IV   I   II   III   IV   I   II   III   IV   I   II   III   IV   I   1973   1974   1975   1976   1977   1978   1979   1980   Percentage  
  • 2. II III IV I II III IV -­‐0.2 -­‐0.4 0 1 1.3 0.7 0.8 1.1 -­‐3.8 -­‐1.6 -­‐4.7 3.1 6.8 5.5 1974 1975 II   III   IV   I   II   III   IV   I   II   III   IV   I   II   III   IV   I   II   III   IV   I   II   III   IV   I   II   III   IV   I   II   III   IV   I   II   1981   1982   1983   1984   1985   1986   1987   1988   1989  
  • 3. I II III IV I II III 0.3 0 -­‐0.2 -­‐0.3 -­‐1.1 -­‐1 -­‐1 9.3 3.1 2.1 3 4.7 8.1 7.3 1976 1977 II   III   IV   I   II   III   IV   I   II   III   IV   I   II   III   IV   I   II   III   IV   I   II   III   IV   I   II   III   IV   I   II   III   IV   I   II   III   1989   1990   1991   1992   1993   1994   1995   1996   1997   Quarters  1973-­‐2013   Quarterly  Data  from  1973  to  2013   Percent  Change  of  GDP  and  Net  Exports  as  a  Percentage  of  GDP  
  • 4. IV I II III IV I II -­‐1.4 -­‐1.8 -­‐1 -­‐1 -­‐0.7 -­‐0.7 -­‐0.9 0 1.4 16.5 4 5.5 0.8 0.5 7 1978 1979 III   IV   I   II   III   IV   I   II   III   IV   I   II   III   IV   I   II   III   IV   I   II   III   IV   I   II   III   IV   I   II   III   IV   I   II   III   1997   1998   1999   2000   2001   2002   2003   2004   2005  
  • 5. III IV I II III IV I -­‐0.9 -­‐1 -­‐1.3 -­‐0.5 0.2 -­‐0.2 -­‐0.5 2.9 1 1.3 -­‐7.9 -­‐0.6 7.6 8.5 1979 1980 1981 III   IV   I   II   III   IV   I   II   III   IV   I   II   III   IV   I   II   III   IV   I   II   III   IV   I   II   III   IV   I   II   III   IV   I   II   III   IV   2005   2006   2007   2008   2009   2010   2011   2012   2013   Percent  Change  of  GDP   Net  Exports  as  Percentage  of  GDP  
  • 6. II III IV I II III IV -­‐0.4 -­‐0.2 -­‐0.4 -­‐0.5 -­‐0.1 -­‐0.9 -­‐0.9 -­‐2.9 4.7 -­‐4.6 -­‐6.5 2.2 -­‐1.4 0.4 19821981 -­‐10   -­‐5   0   5   10   15   20   IV   Percent  Change   rcentage  of  GDP  
  • 7. I II III IV I II III -­‐0.7 -­‐1.3 -­‐1.8 -­‐1.9 -­‐2.4 -­‐2.6 -­‐2.5 5.3 9.4 8.1 8.5 8.2 7.2 4 1983 1984
  • 8. IV I II III IV I II -­‐2.6 -­‐2.2 -­‐2.7 -­‐2.7 -­‐3 -­‐2.8 -­‐2.8 3.2 4 3.7 6.4 3 3.8 1.9 4 1985 1986
  • 9. III IV I II III IV I -­‐3 -­‐2.9 -­‐3 -­‐3 -­‐3 -­‐2.9 -­‐2.4 4.1 2.1 2.8 4.6 3.7 6.8 2.3 1986 1987 1988
  • 10. II III IV I II III IV -­‐2 -­‐1.9 -­‐2 -­‐1.8 -­‐1.6 -­‐1.3 -­‐1.4 5.4 2.3 5.4 4.1 3.2 3 0.9 1988 1989
  • 11. I II III IV I II III -­‐1.5 -­‐1.2 -­‐1.2 -­‐1.3 -­‐0.8 -­‐0.4 -­‐0.3 4.5 1.6 0.1 -­‐3.4 -­‐1.9 3.1 1.9 1990 1991
  • 12. IV I II III IV I II -­‐0.4 -­‐0.3 -­‐0.5 -­‐0.6 -­‐0.7 -­‐0.8 -­‐0.9 1.8 4.8 4.5 3.9 4.1 0.8 2.4 1 1992 1993
  • 13. III IV I II III IV I -­‐1 -­‐1 -­‐1.1 -­‐1.2 -­‐1.3 -­‐1.4 -­‐1.4 2 5.4 4 5.6 2.4 4.6 1.4 19941993 1995
  • 14. II III IV I II III IV -­‐1.4 -­‐1 -­‐0.9 -­‐1.1 -­‐1.2 -­‐1.4 -­‐1.1 1.4 3.5 2.9 2.7 7.2 3.7 4.3 1995 1996
  • 15. I II III IV I II III -­‐1.3 -­‐1 -­‐1.1 -­‐1.3 -­‐1.5 -­‐1.8 -­‐1.9 3.1 6.2 5.2 3.1 4 3.9 5.3 1997 1998
  • 16. IV I II III IV I II -­‐1.9 -­‐2.2 -­‐2.6 -­‐2.8 -­‐3 -­‐3.5 -­‐3.5 6.7 3.2 3.3 5.1 7.1 1.2 7.8 8 1999 2000
  • 17. III IV I II III IV I -­‐3.8 -­‐3.8 -­‐3.7 -­‐3.4 -­‐3.4 -­‐3.3 -­‐3.5 0.5 2.3 -­‐1.1 2.1 -­‐1.3 1.1 3.7 2000 2001 2002
  • 18. II III IV I II III IV -­‐3.8 -­‐3.9 -­‐4.3 -­‐4.5 -­‐4.4 -­‐4.3 -­‐4.3 2.2 2 0.3 2.1 3.8 6.9 4.8 2002 2003
  • 19. I II III IV I II III -­‐4.6 -­‐5 -­‐5.2 -­‐5.4 -­‐5.3 -­‐5.3 -­‐5.5 2.3 3 3.7 3.5 4.3 2.1 3.4 2004 2005
  • 20. IV I II III IV I II -­‐5.9 -­‐5.7 -­‐5.7 -­‐5.8 -­‐5.1 -­‐5.1 -­‐5.1 2.3 4.9 1.2 0.4 3.2 0.2 3.1 20065 2007
  • 21. III IV I II III IV I -­‐4.9 -­‐4.8 -­‐5.2 -­‐5.1 -­‐5.2 -­‐4.1 -­‐2.7 2.7 1.4 -­‐2.7 2 -­‐1.9 -­‐8.2 -­‐5.4 2007 2008 2009
  • 22. II III IV I II III IV -­‐2.4 -­‐2.8 -­‐3 -­‐3.3 -­‐3.5 -­‐3.6 -­‐3.3 -­‐0.5 1.3 3.9 1.7 3.9 2.7 2.5 2009 2010
  • 23. I II III IV I II III -­‐3.7 -­‐3.8 -­‐3.7 -­‐3.8 -­‐3.9 -­‐3.7 -­‐3.3 -­‐1.5 2.9 0.8 4.6 2.3 1.6 2.5 2011 2012
  • 24. IV I II III IV -­‐3.2 -­‐3.2 -­‐3.2 -­‐3 -­‐2.7 0.1 2.7 1.8 4.5 3.5 20132