Jordan Telecommunications Market Indicators and Projections 2011 - TABLE OF CONTENTS
•
0 likes•227 views

These country indicators tables compile around 30 main market indicators on the fixed, cellular and Internet markets. The time horizon includes 5 year historical and 5 year projections for each main indicator

Recommended
More Related Content
Viewers also liked
More from Arab Advisors Group
More from Arab Advisors Group (20)
Recently uploaded
Recently uploaded (20)
Jordan Telecommunications Market Indicators and Projections 2011 - TABLE OF CONTENTS
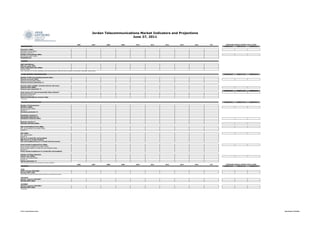
- 1. Jordan Telecommunications Market Indicators and Projections June 27, 2011 2006 2007 2008 2009 2010 2011 2012 2013 2014 2015 COMPOUND ANNUAL GROWTH RATE (CAGR) DEMOGRAPHICS CAGR 06-10 CAGR 11-15 CAGR 06-15 Population (000s) Population growth (000s) Population growth % Number of Households (000s) Households growth (000s) Household size ECONOMY GDP (US$ Millions) GDP per capita (US$) Total credit/debit cards (000s) Growth (000s) Note: Estimation for the total credit/debit cards market figures for 2009 and 2010 are based on Visa Jordan's estimated market shares. IT AND INTERNET INFRASTRUCTURE CAGR 06-10 CAGR 11-15 CAGR 06-15 Number of ISPs (not including Internet Cafes) Internet Accounts (000s) Internet accounts added (000s) Internet accounts penetration % Account usage multiplier (includes Internet café users) Internet Users (000s) Internet users penetration % CAGR 06-10 CAGR 11-15 CAGR 06-15 Total country Int'l Internet bandwidth Mbps (Utilized)* Bandwidth added mbps Bandwidth growth % Internet bandwidth per account in kbps *Estimated TELECOMS INFRASTRUCTURE CAGR 06-10 CAGR 11-15 CAGR 06-15 Number of fixed operators Mainlines (000s) Mainlines added (000s) Growth % Mainlines penetration % Residential mainlines % Household penetration % Residential mainlines (000s) Business mainline % Business mainlines (000s) DSL and Broadband Lines (000s) DSL and broadband lines added (000s) Growth % G th DSL (000s) DSL Added (000s) Growth % DSL as % of total DSL and broadband DSL lines as % of total mainlines DSL and broadband lines as % of total Internet accounts Fixed wireless broadband lines (000s) Fixed wireless broadband lines added (000s) Fixed wireless added % of total DSL and broadband added Growth % Fixed wireless broadband as % of total DSL and broadband Number of Cellular Operators Cellular lines (000s) Cellular lines added (000s) Growth % Cellular penetration % ` Note: Internet accounts do not include 3G mobile broadband 2006 2007 2008 2009 2010 2011 2012 2013 2014 2015 COMPOUND ANNUAL GROWTH RATE (CAGR) REVENUES CAGR 06-10 CAGR 11-15 CAGR 06-15 PSTN PSTN revenues (US$ 000)* Monthly ARPU (US$) Note: PSTN revenues are listed without mobile-to-international revenues CELLULAR Cellular revenues (US$ 000)* Monthly ARPU (US$) INTERNET Internet revenues (US$ 000)* Monthly ARPU (US$) *Estimated © 2011 Arab Advisors Group Reproduction Prohibited
- 2. Population Internet accounts Total country bandwidth Mainlines (Fixed lines) Cellular lines This report has been delivered to Client as part of the subscription to the Arab Advisors Group Strategic Research Service to be used exclusively by its employees. Disclaimer Although the information in this report has been obtained from sources that Arab Advisors Group believes to be reliable, we do not guarantee its accuracy, and such information may be incomplete or condensed. All opinions and estimates included in this report constitute our judgment as of this date and are subject to change without notice. This report is for information purposes only and is not intended as an offer or solicitation with respect to the purchase or sale of any security. No part of this document may be reproduced without the written permission of Arab Advisors Group. © 2011 Arab Advisors Group Reproduction Prohibited