2. previously showed that genetically deleting neuronal PTEN
(phosphatase and tensin homolog), a tumor suppressor and neg-
ative regulator of the mTOR (mammalian target of rapamycin)
signaling pathway, promotes CST regeneration after experimen-
tal spinal cord injury (Liu et al., 2010). mTOR globally regulates
protein synthesis and cell growth (Ma and Blenis, 2009). Neuro-
nal mTOR activity is downregulated as development proceeds
and, intriguingly, is further downregulated after axonal injury in
the adult (Park et al., 2008; Liu et al., 2010). This further dimin-
ished mTOR activity presumably makes injured neurons less ca-
pable of axonal growth than their uninjured counterparts and
potentially renders them less responsive to a reduction in extrin-
sic growth inhibition.
Although both regeneration and sprouting may serve as im-
portant anatomical substrates for functional recovery, their reg-
ulation by neuron-intrinsic and -extrinsic factors may differ.
Here we codeleted PTEN and Nogo as proof-of-principle exper-
iments to target neuron-intrinsic and -extrinsic factors simulta-
neously. We hypothesized that elevating intrinsic growth ability
by deleting PTEN may render injured adult CST neurons more
responsive to a reduction in extrinsic growth inhibition. Our
results illustrate that neuron-intrinsic and -extrinsic factors reg-
ulate axon regeneration and sprouting in complex ways and that
intrinsic growth ability is an important determinant of neuronal
responsiveness to changes in extrinsic growth inhibition.
Materials and Methods
Mutant mice
The Nogo null mutant (null for all the three major isoforms of Nogo,
Nogo-A-C) has been described previously (Lee et al., 2009). The PTEN
conditional allele (PTENflox
, or PTENf
) was obtained from The Jackson
Laboratory (B6.129S4-Ptentm1Hwu
/J; stock #006440) (Lesche et al., 2002).
The single-mutant mice, after being backcrossed to C57BL/6 for at least 9
generations, were bred to each other to obtain compound heterozygous
mutants. These mice were then intercrossed to obtain PTENf/f
;NogoϪ/Ϫ
and PTENf/f
;Nogoϩ/ Ϫ
mice, which were then crossed to each other to
obtain experimental mice of the same genotypes. AAV-Cre or control
virus AAV-GFP were injected into the sensorimotor cortex of P1 or
young adult (4- to 6-week-old) mice to obtain the following four exper-
imental groups: control mice (PTENf/f
;Nogoϩ/ Ϫ
, AAV-GFP), Nogo
single-mutant mice (PTENf/f
;NogoϪ/Ϫ
, AAV-GFP), PTEN single-
mutant mice (PTENϪ/Ϫ
;Nogoϩ/ Ϫ
, AAV-Cre), and PTEN/Nogo double-
mutant mice (PTENϪ/Ϫ
;NogoϪ/Ϫ
, AAV-Cre).
Viral production and injection
AAV-Cre and control AAV-GFP (Liu et al., 2010) were produced at the
Salk Institute Viral Vector Core. Viral concentrations were titered by
qPCR. AAV-Cre reached a titer of 0.5 ϫ 1012
TU/ml and AAV-GFP 0.7 ϫ
1012
TU/ml. For neonatal AAV injections, postnatal day 1 (P1) PTENf/f
;
NogoϪ/Ϫ
and PTENf/f
;Nogoϩ/ Ϫ
mice were cryo-anesthetized, placed on
an ice-cold pad, and injected with 1 l of either AAV-GFP or AAV-Cre
into the right sensorimotor cortex. A modified 10 l of Hamilton syringe
attached to a fine glass pipette was mounted on a stereotaxic device for
injection. After injection, pups were placed on a 37°C warming pad and
covered with some home cage bedding to decrease the risk of rejection by
the mother. Pups were returned to their mothers once they regained
consciousness, normal color, and behavior.
For young adult AAV injections, 4- to 6-week-old PTENf/f
;NogoϪ/Ϫ
and PTENf/f
;Nogoϩ/ Ϫ
mice were anesthetized with freshly prepared 2.5%
Avertin (Sigma). A total of 1.2 l of AAV-GFP or AAV-Cre was injected
into the sensorimotor cortex at 6 sites (0.2 l/site). For the dorsal he-
misection model, the right sensorimotor cortex targeting the left
hindlimb was injected (0.1, 0.6, and 1.1 mm posterior to the bregma; 1.0
and 1.4 mm lateral, 0.7 mm deep). For the pyramidotomy model, the
right sensorimotor cortex targeting the left forelimb was injected (0.5 and
0.1 mm anterior, and 0.3 mm posterior to the bregma; 1.2 and 2.2 mm
lateral, 0.7 mm deep).
Surgical procedures for injury production and axon tracing
Dorsal hemisection spinal cord injury, pyramidotomy, and biotinylated
dextran amine (BDA) tracer injection into the sensorimotor cortex were
performed as described previously (Lee et al., 2010; Liu et al., 2010), with
minor modifications as highlighted below. Adult female mice were used
for spinal cord injury experiments; adult male mice were used for pyra-
midotomy. In total, 169 mice of various genotypes were used in surgical
experiments. Surgical procedures for spinal cord injury or pyramidot-
omy were performed 6 weeks after AAV injections in P1 mice and 4 weeks
after AAV injections in young adult mice. For consistency throughout
the study, all pyramidotomy surgeries were performed by one surgeon;
all dorsal hemisection surgeries were performed by another surgeon.
Surgeons performing the surgeries were blinded to the genotypes.
Pyramidotomy. Mice were anesthetized with 2.5% Avertin and an in-
cision made on the left side of the trachea. Skull base was exposed, and
craniotomy of the occipital bone was performed using laminectomy for-
ceps to expose the underlying pyramidal tract of adult male mice (Starkey
et al., 2005). A micro feather scalpel was used to puncture the dura and
lesion the entire left pyramidal tract. Wound was closed with 6.0 sutures
and Dermabond. mice were perfused 4 weeks after injury.
Dorsal hemisection spinal cord injury. A laminectomy at T8 was per-
formed to expose the spinal cord. The dura was punctured bilaterally
with a 30G needle at appropriate locations. A pair of superfine iridectomy
scissors was then used to cut the dorsal half of the spinal cord at a depth
of 0.8 mm. Finally, a micro feather ophthalmic scalpel was used to retrace
the lesion to ensure its completeness. The muscle layers were sutured
with 6.0 sutures, and the skin was secured with wound clips and Derma-
bond. Mice were perfused 6 weeks after injury.
BDA tracing. Two weeks before death (i.e., 2 weeks after pyramidot-
omy, or 4 weeks after dorsal hemisection), mice received stereotaxic
injection of BDA (10%, Invitrogen) to label CST axons by anterograde
tracing. The same injection volumes and coordinates were used for BDA
as for young adult AAV injections (see above).
Behavioral assessment
All behavioral tests were performed and quantified by observers blinded
to the genotypes. Three different behavioral tests were performed for
each injury model.
1. Rearing test (for pyramidotomy only). This test assesses the forepaw
preference for touching and leaning against the wall when mice explore
around in a new cage while standing on their hindlimbs (i.e., rear limbs)
(Starkey et al., 2005; Lee et al., 2010). A 15 min videotape was taken. An
observer blinded to the genotypes scored forepaw usage for weight sup-
port against the cage wall while rearing on its hindlimbs for the first 25
times. Mice were tested before injury (day Ϫ1) and on day 2, 7, 14, 21,
and 28 after injury. The percentage of using left forepaw only, right
forepaw only, or both forepaws for weight support while rearing on
hindlimbs was measured. Incidences of using both forepaws were subdi-
vided by analyzing the video in slow motion into right forepaw touching
the wall first, left forepaw touching the wall first, and both forepaws
touching the wall simultaneously (when it was indistinguishable which
forepaw touched the wall first).
2. Tape removal test (for pyramidotomy only). This test was performed
as described previously (Starkey et al., 2005) with some modifications.
Mice were habituated to the testing environment by being handled as
they would during testing to decrease the risk of anxiety. This consisted of
handling the mice and touching their forepaws as it would be done to
attach a sticker for the actual test. Mice were then left for 2 min in a
cylinder. In actual tests, precut round stickers (Office Depot, 1⁄4” diame-
ter) were applied in 2 trials for each forepaw, alternating between left and
right. A video camera was used to videotape mice until the sticker was
removed, or for a maximum length of 2 min. Mice were tested on day Ϫ1
(negative 1, as preinjury baseline), 2, 7, 14, 21, and 28 after injury, by the
same experimenters, at about the same time of the day. An observer
blinded to the mouse genotypes later analyzed the video recordings. The
sensory score is the amount of time (in seconds) for a mouse to notice the
sticker (as indicated by shaking the paw, bringing paw to the mouth,
scrubbing the paw on the head); the motor score is the time (in seconds)
for a mouse to remove the sticker after noticing it.
6414 • J. Neurosci., April 22, 2015 • 35(16):6413–6428 Geoffroy et al. • Nogo and PTEN in Injury-Induced Spinal Axon Growth
3. 3. Ladder rung test (for both pyramidotomy and dorsal hemisection).
This test was performed as described previously (Metz and Whishaw,
2009) with some modifications. Briefly, mice were habituated and
trained to run on the apparatus for 5 consecutive days before injury. On
the day before injury and on selected days after injury, mice were tested.
An irregular rung pattern (with uneven spacing between rungs) is used
each time to prevent the mice from compensating for their limb impair-
ment by learning a particular pattern. The same set of irregular patterns
was used for all the mice based on the time point relative to the injury
(such that on day Ϫ1, all mice were tested using Pattern 1; on day 2 after
injury, Pattern 2; day 7, Pattern 3, etc.). A video camera was positioned
from the side of a horizontal ladder at a slight ventral angle, so the
positions of all four limbs could be recorded simultaneously. Testing
consisted of having the mice walk for a minimum of 6 passages in front of
the video camera to obtain sufficient numbers of steps (a minimum of 30
steps) for analysis. For each injury model, all recordings were performed
by the same experimenters, at approximately the same time of the day.
The video recordings were analyzed by an observer blinded to the geno-
types using frame-by-frame analysis at 30 f/s as described previously
(Metz and Whishaw, 2009). A foot fault scoring system provided a score
from 0 (total miss step) to 6 (perfect placement) for each consecutive step
for individual paws, giving the percentage of missteps as well as an aver-
age score. For dorsal hemisection, the percentage of correct steps instead
of missteps was plotted.
4. Basso Mouse Scale (BMS) (for dorsal hemisection only). The BMS
assesses the locomotion behaviors of mice in an open field (Basso et al.,
2006). Mice were observed for 5 min by two observers. Many features
were noted, including ankle movements, stepping pattern, coordination,
paw placement, trunk instability, and tail position, with a minimum
score of 0 (no movement) to a maximum score of 9 (normal locomo-
tion). Mice were tested before injury (day Ϫ1) and at day 1, 7, 14, 21, 28,
35, and 42 after spinal cord injury. Mice with a BMS score of Ͼ3 (some
stepping) at 1 d after injury were excluded from the analysis.
5. Rotarod (for dorsal hemisection only). Mice were placed on a rod
(Ugo Basile) rotating at increasing speeds from 5 to 50 rpm in 3 min with
constant acceleration as described previously (Lee et al., 2010). The la-
tency to fall (in seconds) was averaged between two trials per session.
Mice were first acclimated to the test for two sessions for 5 d the week
before injury and one additional session 1 d before injury (baseline).
Mice were then tested at day 1, 7, 14, 21, 28, 35, and 42 after spinal cord
injury.
Tissue processing
Tissue processing was performed as described with minor modifications
(Lee et al., 2009, 2010). Mice were given lethal dose of Fatal plus, and
perfused transcardially with 4% PFA. Brain and spinal cord were dis-
sected out, and the tissues were postfixed overnight at 4°C in the same
fixative solution. Tissues were incubated in 30% sucrose for 3 d for
cryo-protection. The bulk of the brain, medulla, and different segments
of the spinal cord were embedded in OCT compound, and snapped
frozen on dry ice. For the pyramidotomy groups, C3-C7 spinal cord was
embedded for transverse sections. For dorsal hemisection, an ϳ8 mm
segment from 4 mm rostral and 4 mm caudal to the injury was embedded
for sagittal sections; the spinal cord tissues just rostral and caudal to this
8 mm segment were embedded for transverse sections to evaluate axon
labeling efficiency (based on the rostral tissue sections) and lesion com-
pleteness (based on the caudal tissue sections). Tissues were sectioned
with a cryostat at 20 m thickness for further processing.
Transverse sections of the medullary pyramids were processed to ob-
tain the total number of CST axons labeled to control for labeling effi-
ciency (see below). For the dorsal hemisection groups, floating step serial
(every other) sagittal sections centered at the injury site were stained for
BDA and GFAP. Sections were incubated in Vectastain ABC solution
(Vector Laboratories) overnight at 4°C, washed in PBS, and mounted on
gelatin-coated slides. BDA was detected with TSA Plus Fluorescein Sys-
tem (10 min, room temperature, 1:200, PerkinElmer). Sections were
costained with polyclonal rabbit anti-GFAP (overnight incubation,
1:500, Dako) after blocking in PBS with 0.4% Triton X-100 and 5% horse
serum for 2 h at room temperature. The next day, sections were washed
and incubated with secondary anti-Rabbit AlexaFluor-488 (Invitrogen)
for 1 h at room temperature. After several washes with PBS, sections were
coverslipped with Fluoromount-G (Southern Biotechnology). For im-
munohistochemistry, purified polyclonal rabbit anti-Nogo-A (1:500)
as described previously (Zheng et al., 2003), rat anti-GFAP (1:500, Invit-
rogen), rat anti-myelin basic protein (MBP, 1:500, Millipore), mouse
anti-CNPase (1:50, Sigma), mouse anti-NG2 (1:50, Millipore), mouse
anti-NeuN (1:100, Millipore), chicken anti-HF-H (1:200, Millipore),
and rat anti-CD68 (1:400, AbD Serotec) were used. For the pyramidot-
omy groups, medullas and transverse sections of the cervical C7 were
processed similarly, but without GFAP costaining. Selected transverse
sections of cervical spinal cord (C7) were immunostained for PKC␥
(Santa Cruz Biotechnology, 1:100) to examine the completeness of the
lesion (see Fig. 1G,H) for every single animal, as described previously
(Lee et al., 2010). Mice with incomplete lesion were excluded from the
study. A total of 5 of 103 mice stained for PKC␥ were removed, including
2 control, 1 Nogo KO, and 2 PTEN KO mice. Coronal brain sections were
stained for pS6 (Cell Signaling Technology) as described previously (Liu
et al., 2010).
Quantification of axons
Images were taken with a digital camera mounted on a Zeiss epifluores-
cence microscope using the 10ϫ, 20ϫ, or 100ϫ (medulla only) objective
lenses. Axon densities and/or numbers were quantified using ImageJ.
Both the initial observation of the stained sections and later quantifica-
tion of axon densities/numbers were conducted in a blinded fashion in
which the observers did not have a priori knowledge of the genotypes of
the sections being examined or quantified. The average total number of
axons labeled in the medulla did not differ significantly among geno-
types: (1) 3228 Ϯ 295 (control), 3082 Ϯ 322 (Nogo KO), 2793 Ϯ 210
(PTEN KO), and 2724 Ϯ 284 (double KO) with the dorsal hemisection
model and neonatal AAV injection; (2) 3086 Ϯ 258 (control), 3317 Ϯ 263
(Nogo KO), 2917 Ϯ 312 (PTEN KO), and 2989 Ϯ 530 (double KO) with
the pyramidotomy model and neonatal AAV injection; (3) 2831 Ϯ 356
(control), 2778 Ϯ 282 (Nogo KO), 2609 Ϯ 138 (PTEN KO), and 2687 Ϯ
204 (double KO) with the dorsal hemisection model and young adult
AAV injection; (2) 2814 Ϯ 450 (control), 2550 Ϯ 352 (Nogo KO), 2574 Ϯ
299 (PTEN KO), and 2740 Ϯ 297 (double KO) with the pyramidotomy
model and young adult AAV injection (all numbers are given as mean Ϯ
SEM). Three mice that received AAV-GFP injection as young adults
followed by BDA injection 2 weeks later were assessed for GFP/BDA
colabeling efficiency in the medulla as exemplified in Figure 1B. The axon
numbers with GFP/BDA colabeling, BDA labeling, and GFP labeling are
as follows: Mouse 1, 499, 2333, 2137; Mouse 2, 653, 1552, 1856; Mouse 3,
869, 2800, 3732. For statistical analyses, we used GraphPad Prism 5 soft-
ware. A D’Agostino-Pearson normality test was initially performed be-
fore appropriate one-way or two-way ANOVA followed by Bonferroni’s
post hoc test.
CST sprouting after pyramidotomy. Sprouting Axon Density Index and
Sprouting Axon Number Index were quantified. Images of transverse
cervical (C7) spinal cord sections were taken. Axon density in each side of
the gray matter (denervated or not) was measured after subtraction of the
background using ImageJ, as described previously (Grider et al., 2006).
Five randomly selected sections between C6/C7 per animal were quanti-
fied and averaged. The ratio of contralateral (denervated) and ipsilateral
counts was taken as the measure for Sprouting Axon Density Index.
To quantify the Sprouting Axon Number Index, lines were drawn
through the central canal and across the dorsoventral axis, at 50 m from
the midline, then every 100 m laterally in the denervated side of the gray
matter. Numbers of axons crossing theses lines were averaged from five
sections and normalized against total axon count in medulla (Lee et al.,
2010) to obtain the Sprouting Axon Number Index, which was plotted as
a function of the distance from the midline.
CST regeneration after dorsal hemisection spinal cord injury. We as-
sessed the severity of the injuries by measuring the maximal depth of the
lesions. We did not observe any significant differences in lesion depths
among the different genotypes: 711 Ϯ 21 (control), 702 Ϯ 22 (Nogo KO),
673 Ϯ 35 (PTEN KO), and 700 Ϯ 19 (double KO) (mean Ϯ SEM). The
density of axons rostral to the injury site was quantified by measuring the
Geoffroy et al. • Nogo and PTEN in Injury-Induced Spinal Axon Growth J. Neurosci., April 22, 2015 • 35(16):6413–6428 • 6415
4. BDA staining intensity as described previously
(Liu et al., 2010). A series of rectangles of 100
m wide covering the entire dorsoventral axis
of the spinal cord were superimposed onto sag-
ittal sections, starting from the injury site (de-
limited by GFAP staining) all the way to 1.5
mm rostral to the injury. After subtraction of
the background, intensity was measured in ev-
ery rectangle using ImageJ; and the pixel value
of each segment was normalized against the in-
tensity at 1.5 mm rostral to injury. The ratio
was taken as the Rostral Axon Density Index
and was plotted as function of the distance to
the injury. Three adjacent sagittal sections con-
taining the main CST were quantified and av-
eraged for each animal.
The number of axons present in all regions
containing BDA-labeled axons caudal to injury
was quantified to assess regeneration. Vertical
lines 100 m apart were drawn caudal to the
injury site covering the dorsoventral axis of the
spinal cord, and the total number of axons
between two adjacent lines was quantified.
The axon numbers on every other sagittal
section throughout the mediolateral axis
were summed up, normalized against the total
number of axons labeled in the medulla (Lee et
al., 2010), and expressed as a function of the
distance from the injury site to obtain the Cau-
dal Axon Number Index. BDA-labeled axons
exiting the GFAP sparse lesion core and enter-
ing the GFAP dense astroglial reactive area im-
mediately caudal to the injury were considered
regenerated. In addition, the total number of
axons present within the lesion core was quan-
tified and normalized to the number of axons
at the medulla level.
Results
The primary goal of this study was to as-
sess whether manipulating both neuron-
intrinsic (PTEN) and extrinsic (Nogo)
factors could further increase the sprouting
and regeneration of CST axons following
injury beyond what is already observed
with manipulating either factor alone.
While definitions of axon regeneration
versus sprouting vary in the literature
(Cafferty et al., 2008), here we used the
injury status of the neurons as the primary
criterion in distinguishing regeneration
from sprouting: regeneration is axonal
growth from injured neurons and sprout-
ing is axonal growth from uninjured neu-
rons (Tuszynski and Steward, 2012;
Geoffroy and Zheng, 2014). We used two
different injury models, a unilateral pyr-
amidotomy model and a dorsal he-
misection spinal cord injury (Fig. 1A),
to assess CST sprouting and regenera-
tion, respectively (Starkey et al., 2005;
Zheng et al., 2006). Age-, sex-, and ge-
netic background-matched littermates (backcrossed Ն9 genera-
tions into C57BL/6) were used to facilitate a direct comparison
among different genotypes. In addition, PTEN deletion was ini-
tiated in either neonatal or young adult mice in separate experi-
ments to examine the effect of the timing of PTEN deletion. We
followed functional recovery with several behavioral assays, in-
cluding the ladder rung, rearing, and tape removal tests after
pyramidotomy and the open field locomotion (BMS score), ro-
Figure 1. Schematic representation of the injury models to study CST axon sprouting and regeneration and pS6 upregulation in
PTEN-deletedmice.A,Dorsalviewofthebrainandpartofthespinalcordillustratingtheunilateralpyramidotomyinjurymodel(left)and
thedorsalhemisectionspinalcordinjury(right).Unilateralpyramidotomy(redline)seversallCSTaxonsoriginatingfromtheleftsideofthe
brain(grayline,nottracedwithBDA)atthepyramidallevelbeforetheaxonscrossthemidline,leadingtodenervationoftherightsideofthe
spinalcord.AxontracerBDAisinjectedintotherightsensorimotorcortex(blueshadedarea)tolabeltheuninjuredCSTaxons(blueline),
whichmaysprout(greenlines)acrossthemidlineintothedenervatedsideinthecervicalcord.DorsalhemisectionatT8(redline)severs
thevastmajorityofCSTaxonsinthecordbilaterally.AxontracerBDAisinjectedintotherightsensorimotorcortex(blueshadedarea)tolabel
theinjuredCSTaxons(blueline)ontheleftsideofthespinalcordtodetectanyregeneration(greenlines)belowtheinjurysite.Theother
sideoftheCSTisalsoinjuredbutnottracedwithBDA(grayline).Inbothmodels,AAV-Cre(orAAV-GFPcontrol)isalsoinjectedintotheright
sensorimotorcortex(blueshadedarea)inneonataloryoungadultmicetoinitiatePTENdeletion,beforeinjury.B,Exampleofamedulla
sectionfromamouseinjectedwithcontrolAAV-GFPatayoungadultagefollowedbyBDAinjection4weekslater,showingsignificantoverlap
betweenGFPandBDAlabeling(inthisanimal,ϳ42%ofBDA-labeledCSTaxonsinthemedullawereGFPpositive).C,D,Representativeimagesof
coronalbrainsections4weeksafterunilateralAAV-CreinjectionintotherightcortexofP1(C)or4-week-old(D)ROSA26-loxP-STOP-loxP-tdTomatof/f
mice,illustratingawiderdistributionofAAV-CremediatedtdTomatoreportergeneactivationinP1-injectedmicethaninyoungadult-injectedmice.
E, E, F, F, Representative images of coronal brain sections 4 weeks after unilateral AAV injection into the right cortex of young adult PTENf/f
;
Nogoϩ/Ϫ
mice,showingpS6andNeuNcostaining(E,F)orpS6signalsonly(E,F).E1,E2,F1,F2,High-magnificationimagesoftheregions
depictedinEandF.NotethehigherlevelofpS6andthelargersomasizeassociatedwithpS6immunoreactivityontherightinjectedsidewith
AAV-Cre.G,H,PKC␥staining4weeksafterunilateralpyramidotomyshowinganexampleofasuccessfulinjury(G)andanexampleofanincomplete
lesionthatwasremovedfromthestudy(H).Scalebars:B,100m,C–F,1mm;E1–F2,20m;G,H,200m.
6416 • J. Neurosci., April 22, 2015 • 35(16):6413–6428 Geoffroy et al. • Nogo and PTEN in Injury-Induced Spinal Axon Growth
5. tarod, and ladder rung tests after dorsal hemisection spinal cord
injury. In addition, our study represented the first time where PTEN
deletion and Nogo deletion could be compared side by side in their
effect on axon regeneration and sprouting after CNS injury.
We applied unilateral AAV-Cre (adeno-associated virus car-
rying a Cre expression construct) injection into the sensorimotor
cortex of PTENf/f
(homozygous floxed, PTEN conditional mu-
tant) mice (Lesche et al., 2002) to induce PTEN deletion as
described previously (Liu et al., 2010). We evaluated the effective-
ness of AAV infection in two ways. First, we estimated the per-
centage of GFP-positive axons among axon tracer BDA-labeled
CST axons in the medulla at ϳ30% in mice that received control
AAV-GFP injection as young adults (4–6 weeks old) followed by
BDA injection later (21%, 31%, and 42% for the three mice
assessed, with the last example shown in Fig. 1B). Second, we
injected AAV-Cre into the conditional ROSA26-loxP-STOP-
loxP-tdTomatof/f
reporter mice (Madisen et al., 2010) at either the
neonatal (postnatal day 1 [P1]) or young adult stage. This led to
strong tdTomato expression, with a wider diffusion of the virus in
the P1 infected brains than in the young adult infected brains
(Fig. 1C,D). Subsequent BDA injection in these mice allowed us
to quantify the percentage of BDA-labeled axons at the medulla
that coexpressed tdTomato. This percentage was higher in P1
infected mice (ϳ70%) than in young adult infected mice
(ϳ45%). We anticipate that these num-
bers are more indicative of the efficiency
of AAV-Cre mediated PTEN deletion
among BDA-labeled axons because Cre
mediated gene deletion/activation is ex-
pected to be more efficient than axon la-
beling with the virally encoded GFP. As
described previously (Liu et al., 2010),
unilateral injection of AAV-Cre into the
(right) sensorimotor cortex of PTENf/f
mice led to the upregulation of phospho-S6
(pS6),adownstreamindicatorofmTORac-
tivity, and an accompanied increase in neu-
ronal soma size, as exemplified with mice
that received AAV-Cre injection at the
young adult stage and a pyramidotomy in-
jury later (Fig. 1E–F2).
Nogo deletion did not further increase
CST sprouting that is already enhanced
by neonatal PTEN deletion
Initiating PTEN deletion at P1 has previ-
ously been shown to promote robust CST
sprouting across the midline after unilat-
eral pyramidotomy in adult mice (Liu et
al., 2010). We therefore first examined the
effects of Nogo and PTEN codeletion on
CST sprouting after pyramidotomy in
mice where PTEN deletion had been ini-
tiated by AAV-Cre injection at P1. Six
weeks later, a pyramidotomy was per-
formed on the left side of the medullary
pyramids, which severs CST axons on this
side just before they cross the midline
(Fig. 1A). Lesion completeness was veri-
fied by PKC␥ immunostaining on trans-
verse sections at the cervical level 7 (C7)
(Fig. 1G,H), as described previously (Lee
et al., 2010). Two weeks later, we injected
BDA into the right sensorimotor cortex to label the uninjured
CST axons to visualize their sprouting across the midline into the
denervated side of the spinal cord (Fig. 1A). Mice were perfused 2
additional weeks later. No significant differences in the total
number of BDA-labeled CST axons at the medulla level were
noted among different genotypes (for details, see Materials and
Methods).
For simplicity, the following nomenclatures are used to de-
scribe the four genotypes: (1) control mice (i.e., control) are
PTENf/f
;Nogoϩ/ Ϫ
mice injected with AAV-GFP control virus; (2)
PTEN-deleted mice (i.e., PTEN knock-out [KO]) are PTENf/f
;
Nogoϩ/ Ϫ
mice injected with AAV-Cre; (3) Nogo-deleted mice
(i.e., Nogo KO) are PTENf/f
;NogoϪ/Ϫ
mice injected with AAV-
GFP; and (4) PTEN/Nogo doubly deleted mice (i.e., double KO)
are PTENf/f
;NogoϪ/Ϫ
mice injected with AAV-Cre. The Nogo
mutant allele carries an ϳ40 kb genomic deletion within the Nogo
locus that is a null for all known Nogo isoforms, as described
previously (Lee et al., 2009).
To assess axon sprouting across the midline, we applied two
different quantitative measures on C7 transverse sections: the
Sprouting Axon Density Index as the ratio of total BDA labeling
intensity in the gray matter of the denervated side over that of the
intact side and the Sprouting Axon Number Indices as the total
numbers of axons crossing a series of vertical lines within the
Figure 2. CST axon sprouting after unilateral pyramidotomy with neonatal PTEN deletion. A–D, Representative images of C7
spinal cord transverse sections from mice of different genotypes after a left pyramidotomy. PTEN deletion was initiated on P1 by
injectingAAV-Cre(orAAV-GFPascontrol)intothesensorimotorcortexofPTENf/f
mice.*Locationofcentralcanal.Scalebars:A–D,
300m;A–D,100m(Higher-magnificationimagesofboxedareasinA–D).E,SproutingAxonDensityIndex,measuringthe
ratio of axon tracer BDA staining intensity in the denervated over nondenervated gray matter. F, Sprouting Axon Number Index,
measuring the numbers of axons crossing specific distances in the denervated gray matter of the spinal cord, normalized against
thetotalnumberofCSTaxonslabeledinthemedulla.Nϭ15(control),Nϭ13(NogoKO),Nϭ16(PTENKO),Nϭ9(doubleKO).
ForSproutingAxonDensityIndexandSproutingAxonNumberIndex,fiverandomsectionscollectedfromC6toC7werequantified.
*p Ͻ 0.05. ***p Ͻ 0.001. One-way (E) or two-way (F–H) ANOVA followed by Bonferroni’s post hoc test. ns, Not significant.
Geoffroy et al. • Nogo and PTEN in Injury-Induced Spinal Axon Growth J. Neurosci., April 22, 2015 • 35(16):6413–6428 • 6417
6. denervated gray matter at defined dis-
tances from the midline normalized to the
total CST axon number labeled in the
medulla.
Nogo-deleted mice exhibited a trend
for increased CST sprouting compared
with the control mice (Fig. 2A,B) based
on both the Sprouting Axon Density In-
dex (Fig. 2E; control, 0.066 Ϯ 0.006; Nogo
KO, 0.088 Ϯ 0.013, representing a ϳ33%
increase. p ϭ 0.13) and the Sprouting
Axon Density Indices at 50 and 150 m
from the midline (Fig. 2F; e.g., control,
0.009 Ϯ 0.001; Nogo KO, 0.012 Ϯ 0.001 at
50 m, p ϭ 0.059) that approached statis-
tical significance. This is in line with our
previous study where a modest increase of
CST sprouting (Ͻ50%) was observed in
Nogo-deleted mice (Lee et al., 2010). Ini-
tiating PTEN deletion at P1 led to signifi-
cantly more CST sprouting than control
mice by both measures (Fig. 2C,E,F),
again consistent with our previous PTEN
study (Liu et al., 2010). The Sprouting
Axon Density Index in PTEN-deleted
mice (0.142 Ϯ 0.014) was ϳ2ϫ greater
than control mice and ϳ1.5ϫ greater
than Nogo-deleted mice (Fig. 2E). The
Sprouting Axon Number Indices on the
denervated side were significantly higher
in PTEN-deleted mice than control or
Nogo-deleted mice, from 50 to 450 m off
midline (Fig. 2F; e.g., 0.017 Ϯ 0.002 at 50
m). However, additional Nogo deletion
did not noticeably further increase the
level of sprouting already enhanced by
PTEN deletion (Fig. 2D), as quantified by
either the Sprouting Axon Density Index
(Fig. 2E; double KO, 0.152 Ϯ 0.02) or the
Sprouting Axon Number Indices (Fig.
2F; e.g., 0.020 Ϯ 0.003 for double KO at
50 m).
To our knowledge, this was the first time
Nogo-deletedmiceandPTEN-deletedmice
were compared side by side for CST sprout-
ing in the same study, especially as age-,
sex-, and genetic background-matched
littermates. Together, these data indicate
thatmodulatingtheneuron-intrinsicPTEN
signaling pathway may lead to a more ro-
bust axon sprouting response from unin-
jured CST neurons than modulating Nogo-
mediated extrinsic inhibition. In addition,
Nogo deletion does not lead to a detectable
leveloffurtherenhancementinCSTsprout-
ing in mice where PTEN deletion has been
initiated at P1.
Axonal sprouting has been associated
with behavioral improvement in the litera-
ture (Bradbury and McMahon, 2006). To assess the functional con-
sequenceofenhancedCSTsproutinginNogoand/orPTEN-deleted
mice, we examined forelimb function recovery by uneven spacing
ladder rung, rearing, and tape removal tests. We used these tests
because the same or similar tests have been shown to reveal a persis-
tent deficit after pyramidotomy in mice (Starkey et al., 2005).
In the ladder rung test, unilateral lesion of the CST signifi-
cantly increased the percentage of missteps on the injured side 2 d
Figure3. AssessingrecoveryofforelimbfunctionafterneonatalPTENdeletionandunilateralpyramidotomy.A–D,LadderRungtest.Therewas
anincreaseinthenumberofmisstepsfortheinjuredside(B,rightforepaw)comparedwiththeuninjuredside(A,leftforepaw).Noimprovementin
thepercentageofmissteps(B)ortheaveragewalkingscore(D)wasobservedduringtheperiodofrecoveryforallgenotypes.E–H,Taperemovaltest.
Sensoryandmotorscoresfortherightforepaw(injuredside,E,F)andtheleft(uninjuredside,G,H)forthetaperemovalassay.Sensoryscoreisthe
timetakenbyamousetonoticeastickytapeplacedundertheforepaw;motorscoreisthetimetakentoremovethetapeafterthemousenoticesit.
Allmiceimprovedmotorfunctionovertimefortheinjuredside,butPTENKOanddoubleKOmiceexhibitedanacceleratedimprovement7dafter
injurycomparedwithcontrolmice.Unliketheright,injuredside,therewaslittlesensoryormotordeficitontheleft,uninjuredsideafterunilateral
pyramidotomy,whichservedasacontrol.Nϭ15(control),Nϭ13(NogoKO),Nϭ16(PTENKO),Nϭ9(doubleKO).B,D,*Timepointwhenall
genotypesaresignificantlydifferent(pϽ0.05)frompreinjurylevels(dayϪ1).Two-wayANOVAfollowedbyBonferroni’sposthoctest.
6418 • J. Neurosci., April 22, 2015 • 35(16):6413–6428 Geoffroy et al. • Nogo and PTEN in Injury-Induced Spinal Axon Growth
7. after injury (Fig. 3B). For all four genotypes, this difference per-
sisted for the 4 week testing period, and no differences among
genotypes were observed at any of the time points. There was a
slight deficit in the percentage of missteps on the uninjured side
that persisted for the duration of the experiment in all genotypes
(Fig. 3A). We also used a forepaw digit scoring system (Metz and
Whishaw, 2009) to assess more subtle differences in functional
deficits and recovery (Fig. 3C,D). There was a slight dip in the
average score on the uninjured side at day 2 that restored to
preinjury level at later time points (Fig. 3C). In contrast, the
injured side showed a significant and persistent deficit from 2 to
28 d after injury (Fig. 3D). Again, no differences among geno-
types were observed at any time point examined. In the rearing
test, we assessed forepaw preferences for touching the wall during
vertical exploration while mice were stand-
ing on their hindlimbs. No differences were
observed among genotypes for any of
the quantifications performed (data not
shown).
The tape removal test has both a sen-
sory and a motor component for forelimb
function. Unilateral lesion of the CST im-
paired the ability of mice to sense a sticker
attached to their injured forepaw, as re-
flected by the worse sensory score (i.e., a
longer time for mice to notice the sticker)
after injury in all four genotypes (Fig. 3E).
Despite some level of spontaneous recov-
ery, this impairment persisted over the 4
week testing period for all genotypes, with
no significant differences among geno-
types for any of the time points tested.
Likewise, the motor score, given by the
latency to remove the tape after sensation,
revealed a significant impairment specifi-
cally for the injured (right) side, which re-
covered over time in all genotypes (Fig.
3F). Interestingly, at day 7 after injury,
PTEN and PTEN/Nogo-deleted mice dis-
played a significantly improved motor
score (i.e., faster removal once the mouse
senses the tape), whereas Nogo-deleted
mice exhibited a nonsignificant trend for
faster tape removal, compared with con-
trol mice (Fig. 3F; control, 50 Ϯ 19 s;
Nogo KO, 32 Ϯ 8 s; PTEN KO, 24 Ϯ 10 s;
double KO, 14 Ϯ 5 s). At later time points,
mice of all genotypes recovered to a simi-
lar degree and approached or equaled pre-
injury levels. Thus, it appears that PTEN
and PTEN/Nogo-deleted mice exhibited
an accelerated recovery that allowed them
to reach a plateau sooner than control
mice, which also recovered over time.
Nogo deletion did not further enhance
CST sprouting that is already enhanced
by young adult PTEN deletion
As neonatal PTEN deletion may result in
confounding gene compensation and de-
velopmental alterations, we also initiated
PTEN deletion in young adult mice (4–6
weeks old). Four weeks later, pyramidot-
omy was performed and sprouting of BDA-labeled CST axons
was examined four additional weeks later as described above.
Qualitatively similar results were obtained as those from the neo-
natal PTEN deletion study above (Fig. 4A–DЈ). There was a mod-
est and nonsignificant increase in the Sprouting Axon Density
Index in Nogo-deleted mice compared with the control mice
(Fig. 4E; control, 0.043 Ϯ 0.003; Nogo KO, 0.063 Ϯ 0.006, repre-
senting a ϳ47% increase; p ϭ 0.13). Both PTEN and PTEN/
Nogo-deleted mice presented a significant increase in the
Sprouting Axon Density Index compared with either control or
Nogo-deleted mice (Fig. 4E). The Density Index of either PTEN
or PTEN/Nogo-deleted mice was ϳ3ϫ that of the control mice
and ϳ2ϫ that of the Nogo-deleted mice (PTEN, 0.124 Ϯ 0.008;
double KO, 0.136 Ϯ 0.037). Thus, deleting PTEN in young adult
Figure4. CSTaxonsproutingafterunilateralpyramidotomywithyoungadultPTENdeletion.A–D,RepresentativeimagesofC7
spinal cord transverse sections from mice of different genotypes after a left pyramidotomy. PTEN deletion was initiated in young
adult mice by injecting AAV-Cre (or AAV-GFP control) into the sensorimotor cortex of 4- to 6-week-old PTENf/f
mice. *Location of
central canal. Scale bars: A–D, 300 m; A–D, 100 m. E, F, Quantification of Sprouting Axon Density Index (E) and Sprouting
Axon Number Index (F). G, H, Tape removal assay showing the sensory score (G) and the motor score (H) for the right forepaw
(injured side). N ϭ 8 (control), N ϭ 10 (Nogo KO), N ϭ 8 (PTEN KO), N ϭ 8 (double KO). For Sprouting Axon Density Index and
SproutingAxonNumberIndex,fiverandomsectionscollectedfromC6toC7werequantified.*pϽ0.05.One-way(E)ortwo-way
(F) ANOVA followed by Bonferroni’s post hoc test. ns, Not significant.
Geoffroy et al. • Nogo and PTEN in Injury-Induced Spinal Axon Growth J. Neurosci., April 22, 2015 • 35(16):6413–6428 • 6419
8. mice also promoted CST axon sprouting
after injury. However, codeleting Nogo
and PTEN did not further increase CST
sprouting compared with PTEN deletion
alone (Fig. 4E).
Quantification using the Sprouting
Axon Number Indices confirmed these
results: Nogo-deleted mice exhibited a
modest, statistically nonsignificant in-
crease in CST sprouting compared with
control mice across the different distances
(Fig. 4F; e.g., control, 0.007 Ϯ 0.002;
Nogo KO, 0.010 Ϯ 0.002 at 50 m),
whereas both PTEN and PTEN/Nogo-
deleted mice showed significantly en-
hanced CST sprouting (Fig. 4F; e.g.,
PTEN KO, 0.016 Ϯ 0.002 at 50 m; dou-
ble KO, 0.018 Ϯ 0.003 at 50 m). Both
PTEN and PTEN/Nogo-deleted mice had
slightly Ͼ2ϫ the amount of CST sprout-
ing as in control mice and slightly Ͻ2ϫ
the amount of sprouting as in Nogo-
deleted mice from the midline all the way
to 450 m on the denervated side. Again,
there were no noticeable differences be-
tween PTEN and PTEN/Nogo-deleted
mice, indicating that codeleting Nogo and
PTEN did not further enhance CST
sprouting compared with deleting PTEN
alone.
To determine whether there was any
functional improvement associated with
enhanced CST sprouting, we performed
the same battery of behavioral tests as in
the neonatal PTEN deletion study above.
We found that the behavioral deficit in
rearing and ladder rung tests persisted in
mice of all genotypes, and there was no
difference in recovery among the geno-
types (data not shown). As in the neonatal
PTEN deletion study, the tape removal
assay did not show improvement of the
sensory score for PTEN or PTEN/Nogo-
deleted mice compared with control or
Nogo-deleted mice for any of the time
points examined (Fig. 4G). However,
there was a trend for an improved motor
Figure5. CSTaxonregenerationafterdorsalhemisectionspinalcordinjurywithneonatalPTENdeletion.A–D,Representative
imagesofthoracicspinalcordsagittalsectionsfrommiceofdifferentgenotypesafteraT8dorsalhemisection.PTENdeletionwas
initiated in neonatal mice. Scale bar, 200 m. Arrow indicates injury site. Note the larger gap between BDA-labeled CST axon
endingsandtheinjurysiteinAandBcomparedwiththatinCandD.E,AxonDensityIndexrostraltotheinjurysite,quantifiedas
the staining intensity of axon tracer BDA in function to the distance from the injury site, averaged for three adjacent sagittal
4
sectionscontainingthemainCSTandnormalizedagainstthe
levelat1.5mmrostraltoinjuryforeachmouse.F,AxonNum-
berIndexcaudaltotheinjurysite,quantifiedasthenumberof
axons crossing specific distances, summed from every other
sagittal section throughout the mediolateral axis and then
normalized against the total number of CST axons labeled in
themedullaforeachmouse.Axonsneedtoexittheinjurysite
and extend into the GFAP dense area caudal to the injury site
to be considered regenerated. G, Axon Number Index within
the GFAP sparse lesion core. H, Cumulative Axon Number In-
dexpast1mmcaudaltotheinjury.Nϭ14(control),Nϭ11
(NogoKO),Nϭ11(PTENKO),Nϭ9(doubleKO).*pϽ0.05.
**pϽ0.01.***pϽ0.001.Two-way(E,F)orone-way(G,H)
ANOVA followed by Bonferroni’s post hoc test.
6420 • J. Neurosci., April 22, 2015 • 35(16):6413–6428 Geoffroy et al. • Nogo and PTEN in Injury-Induced Spinal Axon Growth
9. score in PTEN and PTEN/Nogo-deleted mice at day 7 after injury
(control, 54 Ϯ 15 s; Nogo KO, 49 Ϯ 12 s; PTEN KO, 22 Ϯ 14 s;
double KO, 28 Ϯ 9 s. p ϭ 0.14) but not at later time points (Fig.
4H). Together, these data are consistent with the neonatal PTEN
deletion study and point to an accelerated motor recovery asso-
ciated with enhanced CST sprouting in PTEN and PTEN/Nogo-
deleted mice.
Nogo deletion further enhanced CST regeneration elicited by
neonatal PTEN deletion
Although both neonatal and young adult PTEN deletion led to
enhanced CST sprouting across the midline, this was not further
enhanced by Nogo deletion. However, it remains possible that
PTEN and Nogo deletions may cooperate in enhancing axon
regeneration from injured CST neurons, as elevating neuron-
intrinsic growth ability may render injured neurons more sensi-
tive to a reduction in growth inhibition, as we hypothesized. As
described for the pyramidotomy model, we first initiated PTEN
deletion in neonatal mice, because this paradigm had previously
been shown to produce the most robust effect on CST regenera-
tion (Liu et al., 2010). At 6 weeks of age, mice underwent a dorsal
hemisection spinal cord injury at thoracic level 8 (T8) as de-
scribed previously (Zheng et al., 2006; Lee et al., 2010; Liu et al.,
2010). Four weeks later, CST axons were traced with unilateral
BDA injection in the sensorimotor cortex (on the side where
AAV-Cre or control AAV-GFP had been injected), followed by
two additional weeks of survival time (Fig.
1A). We first looked at transverse sections
4 mm caudal to the injury site to ensure
completeness of the lesion. There were no
mice with spared CST axons in the dorsal
main CST (Zheng et al., 2006). A total of
three mice with labeled dorsolateral CST
axons below the level of injury, possibly
spared, were excluded from the analyses
below.
In mice, after a penetrating spinal cord
injury such as a dorsal hemisection, a
GFAP sparse lesion core forms at the in-
jury site that is surrounded by a GFAP
dense area, which reflects reactive astro-
gliosis (Herrmann et al., 2010). Injured
CST axons typically die back for hun-
dreds of micrometers at the injury site.
Examination of the tissue rostral to in-
jury on sagittal sections by observers
blinded to the genotypes immediately
revealed clear distinctions between
groups of mice that turned out to be
PTEN dependent. Whereas the typical
axon die-back was observed in control
and Nogo-deleted mice, both PTEN and
PTEN/Nogo-deleted mice exhibited ex-
tensive CST labeling deep into the GFAP
dense area immediately rostral to the le-
sion core (Fig. 5A–DЈ). We quantified this
observation by measuring the BDA label-
ing intensity at different distances rostral
to the injury site to obtain the axon Den-
sity Indices. Consistent with the blind ob-
servation mentioned above, PTEN and
PTEN/Nogo-deleted mice presented sig-
nificantly higher axon Density Indices
than control and Nogo-deleted mice from the rostral end of the
lesion core all the way to 0.5 mm rostral to injury (Fig. 5E). We
have previously shown that this increased rostral axon density in
PTEN-deleted mice is due to enhanced CST regeneration but not
a reduction in the initial die-back following injury (Liu et al.,
2010). However, no difference in axon Density Index was ob-
served between PTEN-deleted and PTEN/Nogo-deleted mice, in-
dicating that the neuron-intrinsic growth ability following PTEN
deletion is the main driver for axon growth rostral to injury.
Furthermore, as reported previously (Liu et al., 2010), large bul-
bous endings of BDA-labeled axons characteristic of the retrac-
tion bulbs were much less noticeable in PTEN-deleted groups
than non–PTEN-deleted groups (data not shown).
At, around, and beyond the injury site, Nogo-deleted mice did
not exhibit any significant CST regeneration compared with con-
trol mice (Fig. 5A–BЈ), consistent with our previous studies (Lee
et al., 2009, 2010). Occasionally, few axons were observed to pass
beyond the injury site via the ventral white matter (data not
shown), but this occurred in both Nogo-deleted and control mice
and presumably reflected a low baseline level of spontaneous
regeneration (Steward et al., 2008). In contrast, BDA-labeled ax-
ons could readily be seen across and beyond the injury site, and
extending into the GFAP dense area caudal to the injury site in
PTEN and PTEN/Nogo-deleted mice (Fig. 5C–DЈ). These axons
often took a route in the dorsal part of the spinal cord after they
passed the injury site (Fig. 5C–DЈ), supporting the notion that
Figure6. AssessingrecoveryofhindlimbfunctionafterneonatalPTENdeletionandT8dorsalhemisectionspinalcordinjury.A,
B, Open field locomotion test, giving the BMS score (A) and the BMS subscore (B). C, Rotarod test. Latency to fall is plotted as a
percentageofthepreinjurylevel.D,Ladderrungtest,plottingthepercentageofcorrectsteps.Nϭ14(control),Nϭ11(NogoKO),
N ϭ 11 (PTEN KO), N ϭ 9 (double KO). For all the tests performed, there were no significant difference among genotypes at any
time point. Two-way ANOVA followed by Bonferroni’s post hoc test.
Geoffroy et al. • Nogo and PTEN in Injury-Induced Spinal Axon Growth J. Neurosci., April 22, 2015 • 35(16):6413–6428 • 6421
10. they had been regenerated rather than spared. To assess axon
regeneration, we quantified the axon Number Index as the num-
ber of axons crossing specific distances in relevance to the injury
site, summed from every other sagittal section throughout the
mediolateral axis and then normalized against the total number
of CST axons labeled in the medulla for each mouse.
Within the GFAP sparse lesion core, while there were barely
any axons detected within the lesion core in control
or Nogo-deleted mice, both PTEN and PTEN/Nogo-deleted mice
exhibited a high number of CST axons in the lesion core (Fig. 5G).
There was a trend for a higher number of CST axons within the
lesion core in PTEN/Nogo-deleted mice compared with PTEN-
deleted mice that approached significance (PTEN KO, 0.027 Ϯ
0.010; double KO, 0.044 Ϯ 0.011. p ϭ 0.087).
Caudal to the injury site, there were minimal numbers of ax-
ons in control or Nogo-deleted mice (Fig. 5F). In contrast, both
Figure7. CharacterizationofNogo-AexpressionafterT8dorsalhemisectionspinalcordinjury.A–C,Representativeimagesofspinalcordsagittalsectionsfromawild-type(WT)mousecostained
forGFAPandNogo-A7dafterT8dorsalhemisection.B,C,Larger-magnificationimagesofboxes(B,C,ϳ100mand1mm,respectively,fromtheinjurysite,markedbyanarrow)inA.D,E,Nogo
KO as negative control for Nogo-A immunoreactivity.F, Quantification of Nogo-A immunoreactivity (arbitrary unit) at 100 and 500m caudal to the injury site, normalized to Nogo-A immunore-
activity at 1 mm caudal to injury. Three mice were analyzed per time point, with three sections examined per mouse. G–L, Confocal images sagittal section of wild-type spinal cords examining
coexpression of Nogo-A with various cellular markers at (G, H) or close to (I–L) the injury site 7 d after injury.G–H؆, *Injury site.G, MBP, myelin marker. Arrowindicates coexpression. Arrowhead
indicatescloselyjuxtaposedsignals.H,NF-H,markerforneurons,includingneuronalprocesses.Arrowindicatescoexpressioninneuronalsoma.Arrowheadindicatescolocalizationinaxon.I,CD-68,
macrophage/microgliamarker.NocolocalizationwithNogo-A.J,NG2,markerforNG2oroligodendrocyteprecursorcells.Arrowindicatescoexpressingcells.ArrowheadindicatesNogo-A-positive
but NG2-negative cells. K, CNPase, oligodendrocyte marker. Arrow indicates coexpressing cells in the white matter. Arrowhead indicates coexpressing cells in the gray matter. L, NeuN, Neuronal
nuclear antigen. Arrow indicates coexpressing cells in the gray matter. Scale bars: A, D, 200 m; B, C, E, G–H؆, I–L؆, 20 m.
6422 • J. Neurosci., April 22, 2015 • 35(16):6413–6428 Geoffroy et al. • Nogo and PTEN in Injury-Induced Spinal Axon Growth
11. PTEN and PTEN/Nogo-deleted mice ex-
hibited significantly higher numbers of ax-
ons beyond the injury site (Fig. 5F).
Interestingly, whereas most regenerating
axonsinPTEN-deletedmicedroppedoffby
ϳ1 mm beyond injury at 6 weeks after in-
jury, some CST axons clearly extended be-
yond 1.5 mm in PTEN/Nogo doubly
deleted mice. Thus, PTEN/Nogo-deleted
miceappearedtoextendtheiraxonsforlon-
ger distances than PTEN-deleted mice (Fig.
5F). Indeed, beyond 1 mm caudal to injury
(approximately half of the maximal regen-
eration length), the cumulative axon Num-
ber Index was significantly higher in PTEN/
Nogo-deleted mice than PTEN-deleted
mice (0.022 Ϯ 0.013 and 0.002 Ϯ 0.001, re-
spectively, p Ͻ 0.05; Fig. 5H). At 1250 m
caudaltotheinjury,ϳ55%ofPTEN/Nogo-
deleted mice had regenerating axons,
whereas only 27% of PTEN-deleted mice
did, reinforcing the notion that additional
Nogo deletion increased regeneration in
PTEN-deleted mice.
Because of the significant increase of
axonregenerationinthePTENandPTEN/
Nogo-deleted mice, we tested whether this
regeneration was linked with improved
functional recovery. Several behavioral tests
wereperformed,includingtheopenfieldlo-
comotiontest(theBMSscoreandsubscore)
(Basso et al., 2006), the rotarod test (Lee et
al., 2010), and the uneven spacing ladder
rung test (Metz and Whishaw, 2009). None
of these tests revealed an improved func-
tional recovery for PTEN or PTEN/Nogo-
deleted mice (Fig. 6), despite their
significantly enhanced CST regeneration.
Nogo-A is upregulated at and around
the injury site
The data above suggest that Nogo may act
at and/or around the injury site specifi-
cally to suppress axonal growth. To ex-
amine this possibility, we analyzed
Nogo-A expression pattern at and
around the injury site over time after T8
Figure 8. CST axon regeneration after dorsal hemisection spinal cord injury with young adult PTEN deletion. A–D, Represen-
tativeimagesofthoracicspinalcordsagittalsectionsfrommiceofdifferentgenotypesafteraT8dorsalhemisection.PTENdeletion
was initiated in 4- to 6-week-old mice. Scale bar, 200 m. Arrow indicates injury site. Note the larger gap between BDA-labeled
CST axon endings and the injury site in A and B compared with that in C and D. E, Axon Density Index rostral to the injury site,
quantifiedasthestainingintensityofaxontracerBDAinfunctiontothedistancefromtheinjurysite,averagedforthreeadjacent
4
sagittal sections containing the main CST and normalized
againstthelevelat1.5mmrostraltoinjuryforeachmouse.F,
AxonNumberIndexcaudaltotheinjurysite,quantifiedasthe
number of axons crossing specific distances, summed from
every other sagittal section throughout the mediolateral axis
and then normalized against the total number of CST axons
labeled in the medulla for each mouse. Axons need to exit the
injurysiteandextendintotheGFAPdenseareacaudaltothein-
jury site to be considered regenerated. G, Axon Number Index
within the lesion core. H, Cumulative Axon Number Index past
0.75mmcaudaltotheinjury.Nϭ8(control),Nϭ6(NogoKO),
Nϭ14(PTENKO),Nϭ9(doubleKO).*pϽ0.05.**pϽ0.01.
***pϽ0.001.Two-way(E,F)orone-way(G,H)ANOVAfollowed
byBonferroni’sposthoctest.ns,Notsignificant.
Geoffroy et al. • Nogo and PTEN in Injury-Induced Spinal Axon Growth J. Neurosci., April 22, 2015 • 35(16):6413–6428 • 6423
12. dorsal hemisection injury, as there were
conflicting data on whether Nogo-A is up-
regulated after injury (Huber et al., 2002;
Wang et al., 2002). In wild-type mice, in
addition to the diffuse pattern of normal
Nogo-A expression in the gray and white
matter, Nogo-A was also upregulated at
and around the dorsal hemisection injury
site (Fig. 7A–C). As a control, Nogo-A im-
munoreactivity was not detected beyond
background levels anywhere in the cord
before or at any of the time points exam-
ined after injury in Nogo KO mice (e.g.,
compare Fig. 7D with 7A; and 7E with 7B).
To quantify this upregulation, we mea-
sured Nogo-A immunoreactivity inten-
sity at 100 and 500 m away from the
GFAP sparse lesion core over multiple
time points after dorsal hemisection in-
jury. Nogo-A expression around the in-
jury site rapidly increased at 4 d and
peaked at 7 d after injury (Fig. 7F). The
level of Nogo-A immunoreactivity
dropped significantly by day 28, but this
region remained slightly more immuno-
reactive for Nogo-A relative to the distant
areas or preinjury levels even at 42 d after
injury (data not shown). Together, this
temporal and spatial expression pattern of
Nogo-A indicates that a local upregula-
tion of Nogo-A at and around the injury
site may limit the number of axons grow-
ing in this region, and that its removal
might allow CST axons from PTEN de-
leted neurons to regenerate further.
We next characterized the cell type or-
igin of Nogo-A upregulation, focusing on day 7 after injury when
Nogo-A expression appeared to be at its maximum. Nogo-A and
GFAP did not colocalize. Rather, Nogo-A positive processes and
GFAP-positive processes interdigitated at and around the injury
site (e.g., Fig. 7B), indicating distinct cell type origins for the two
proteins. Likewise, the increase of Nogo-A expression at the in-
jury site was neither associated with macrophages/microglia as
indicated by CD68 immunoreactivity (Fig. 7I–IЉ) nor with men-
ingeal fibroblasts as indicated by fibronectin immunoreactivity
(data not shown).
Nogo-A has been previously associated with oligodendrocyte
markers (Wang et al., 2002; Simonen et al., 2003). Indeed, we
found CNPase-positive cells coexpressing Nogo-A in both the
white and gray matter, as illustrated in high-magnification con-
focal images (Fig. 7K–KЉ). As previously shown (Huber et al.,
2002), MBP and Nogo-A were mostly nonoverlapping, but a
small amount of overlap could be seen along with prevalent jux-
taposed signals (Fig. 7G–GЉ). NG2-positive cells occasionally co-
expressed Nogo-A (Fig. 7J–JЉ).
Consistent with previous reports on neuronal and axonal ex-
pression of Nogo-A (Wang et al., 2002; Vajda et al., 2015), we
found some NF-H (neurofilament heavy) and Nogo-A coexpres-
sion at the vicinity of the injury site in both cell bodies and axon-
like processes (Fig. 7H–HЉ). In the gray matter close to the injury
site, strong Nogo-A expression was also clearly associated with a
subset of NeuN-positive cells where Nogo-A was predominantly
cytoplasmic and NeuN was predominantly nuclear (Fig. 7L–LЉ).
Together, these data indicate that Nogo-A upregulation around
the injury site was of oligodendroglial and neuronal origins
but not of astrocytic, macrophagial/microglial, or fibroblastic
origins.
Nogo deletion further enhanced CST regeneration elicited by
young adult PTEN deletion
Neonatal PTEN deletion elicited a robust regenerative response
in CST neurons, which may have produced a ceiling effect on the
regeneration observed, blunting the effect of Nogo deletion. In
addition, assessing the effect of adult PTEN deletion is more im-
portant, as neonatal PTEN deletion may lead to gene compensa-
tion and developmental alterations that could confound the
interpretation of regeneration data. We therefore also tested the
effect of deleting PTEN in young adult mice in combination with
Nogo deletion.
Similar to what is described above after neonatal PTEN dele-
tion, we observed a clear distinction in the density of BDA-
labeled CST axons just rostral to the injury site that proved to be
PTEN dependent (Fig. 8A–DЈ). The usual die-back pattern for
hundreds of micrometers rostral to the injury site in control and
Nogo-deleted mice were supplanted by robust growth at high
density into the GFAP dense area of reactive astrogliosis, abutting
the GFAP sparse lesion core (Fig. 8A–DЈ). Quantitative analyses
confirmed that PTEN and PTEN/Nogo-deleted mice exhibited sig-
nificantly higher axon Density Indices than control and Nogo-
deleted mice, starting from the rostral end of the lesion core all
Figure9. AssessingrecoveryofhindlimbfunctionafteryoungadultPTENdeletionandT8dorsalhemisectionspinalcordinjury.
A,B,Openfieldlocomotiontest,givingtheBMSscore(A)andtheBMSsubscore(B).C,Rotarodtest.Latencytofallisplottedasa
percentageofthepreinjurylevel.D,Ladderrungtest,plottingthepercentageofcorrectsteps.Nϭ8(control),Nϭ6(NogoKO),
N ϭ 14 (PTEN KO), N ϭ 9 (double KO). For all the tests performed, there were no significant difference among genotypes at any
time point. Two-way ANOVA followed by Bonferroni’s post hoc test.
6424 • J. Neurosci., April 22, 2015 • 35(16):6413–6428 Geoffroy et al. • Nogo and PTEN in Injury-Induced Spinal Axon Growth
13. the way to 0.6 mm rostral to injury. However, further deleting
Nogo did not increase CST axon growth rostral to the injury site
(Fig. 8E), as we had observed with neonatal PTEN deletion (see
above). It is noteworthy that the values of axon Density Indices
are comparable with those from the neonatal PTEN-deleted
groups, suggesting a similar effect on axon growth rostral to in-
jury between neonatal and young adult PTEN deletion.
Within the injury site, PTEN-deleted mice had substantially
more CST axons than control or Nogo-deleted mice. PTEN/
Nogo doubly deleted mice had a slightly higher number of axons
than PTEN-deleted mice, but this difference did not reach statis-
tical significance (Fig. 8G; PTEN KO, 0.036 Ϯ 0.08; double KO,
0.050 Ϯ 0.010. p ϭ 0.16). Caudal to the injury, PTEN and PTEN/
Nogo-deleted mice exhibited significantly more axons than con-
trol or Nogo-deleted mice, and the number of regenerating axons
appeared to drop more quickly in PTEN-deleted mice than
PTEN/Nogo-deleted mice (Fig. 8F). When only axons growing
beyond 0.75 mm past the injury site (approximately half of the
maximal regeneration length observed) were quantified, there
was a noticeable difference between PTEN and PTEN/Nogo-
deleted mice that approached significance (PTEN KO, 0.0013 Ϯ
0.006; double KO, 0.016 Ϯ 0.011. p ϭ 0.065) (Fig. 8H). At 0.75
mm caudal to the injury, 55% of PTEN/Nogo-deleted mice still
had regenerating axons, whereas only 21% of PTEN-deleted mice
did. Even though this was not a side-by-side comparison, the
level of regeneration as quantified by distance and axon number
was apparently lower in young adult PTEN-deleted mice than
neonatal PTEN-deleted mice (compare Figs. 5F and 8F). Regard-
less of whether PTEN deletion was initiated at the neonatal or
young adult stage, additionally deleting
Nogo further enhanced CST regeneration
that was elicited by PTEN deletion.
Finally, we determined whether this
increase of CST regeneration was paral-
leled with improved functional recovery.
As described for the neonatal PTEN dele-
tion study, we performed the open field
locomotion (BMS), rotarod, and uneven
spacing ladder rung tests (Fig. 9). None of
these tests detected improved functional
recovery in PTEN or PTEN/Nogo-deleted
mice despite their significantly enhanced
CST regeneration.
Discussion
Here we tested the hypothesis that manip-
ulating both neuron-intrinsic and
-extrinsic factors may further enhance
axon sprouting and regeneration after
CNS injury by genetically codeleting
PTEN and Nogo. In an apparent paradox
with our previous studies of Nogo and
PTEN single deletion mice (Lee et al.,
2010; Liu et al., 2010), additionally delet-
ing Nogo in PTEN-deleted mice further
enhanced CST regeneration but not
sprouting. These data indicate that
neuron-intrinsic and -extrinsic factors
regulate axon regeneration and sprouting
in complex ways and provide proof-of-
principle evidence that manipulating
both can further improve axon regenera-
tion. Despite clear enhancement in axonal
growth, no or only limited improvement
in behavioral recovery was detected, highlighting the need for
additional strategies to fully use the enhanced axonal growth for
functional gains.
A comparison of PTEN versus Nogo deletion on CST
regeneration and sprouting
Our study represents the first side-by-side comparison between
PTEN deletion and Nogo deletion on CST regeneration and
sprouting, using age-, sex-, and background-matched litter-
mates. Nogo deletion had a modest effect on CST sprouting
(Ͻ50% enhancement), in general agreement with our previous
study (Lee et al., 2010). Such a modest effect may not always be
detected with statistical significance due to the inherent variabil-
ity in CST labeling and baseline sprouting. Nevertheless, the
trend for enhanced CST sprouting in Nogo-deleted mice is con-
sistently observed across independent studies (Cafferty and Strit-
tmatter, 2006; Lee et al., 2010). Other extrinsic inhibitors, such as
chondroitin sulfate proteoglycans, may functionally compensate
for the loss of Nogo (Starkey et al., 2012). A modest level of
enhancement in sprouting, if widespread, may still have signifi-
cant functional consequences. Deleting Nogo had no detectable
effect on CST regeneration, consistent with our previous findings
(Zheng et al., 2003; Lee et al., 2009, 2010). Although there are
conflicting reports in the literature (Kim et al., 2003; Simonen et
al., 2003; Zheng et al., 2003; Cafferty et al., 2007; Steward et al.,
2007; for review, see Lee and Zheng, 2012), our results echo ge-
netic studies of other components in the myelin inhibitory path-
ways, including MAG, OMgp, NgR1, p75NTR
, and PirB (Bartsch
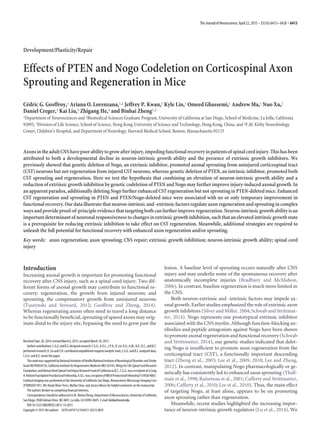
Figure 10. Neurons of different intrinsic growth abilities are differentially sensitive to extrinsic inhibition: a working hypoth-
esis.Circlerepresentsneuronalcellbody.Lineindicatesaxon.Axongrowthfromneuronsofdifferentintrinsicgrowthabilitiesgets
inhibited at different concentrations of extrinsic inhibitors, as indicated by the places at which axon growth stops along a hypo-
theticupwardgradientofextrinsicinhibitorsfromlefttoright.Neuronswithareduced(red),basal(yellow),andelevated(green)
levelofintrinsicgrowthabilityareinhibitedbyareduced,basal,andelevatedlevelofextrinsicinhibitors,respectively.Forthered
neuron (e.g., injured adult CST neurons), a reduced level of extrinsic inhibition (Nogo deletion) may still be too challenging for
axonal growth (regeneration); this neuron will appear unresponsive to a reduction in extrinsic inhibition. For the yellow neuron
(e.g., uninjured adult CST neurons), reducing extrinsic inhibition from a basal level (Nogo deletion) would help axonal growth
(sprouting). For the green neuron (e.g., PTEN-deleted CST neurons), reducing extrinsic growth inhibition from “elevated” to
“basal”(Nogodeletion)wouldhelpaxonalgrowth(regeneration);reducingextrinsicgrowthinhibitionfrom“basal”to“reduced”
(Nogo deletion) may not impact on axonal growth (sprouting). This complex interplay between neuron-intrinsic and -extrinsic
controlmayalsoexplaintheapparentlymorerobusteffectofPTEN/NogocodeletionwithneonatalPTENdeletioncomparedwith
young adult PTEN deletion.
Geoffroy et al. • Nogo and PTEN in Injury-Induced Spinal Axon Growth J. Neurosci., April 22, 2015 • 35(16):6413–6428 • 6425
14. et al., 1995; Kim et al., 2004; Song et al., 2004; Zheng et al., 2005;
Ji et al., 2008; Nakamura et al., 2011).
In contrast, PTEN deletion had a strong effect on both CST
sprouting and regeneration. Deleting PTEN in young adult mice
enhances CST sprouting, reinforcing development-independent
function of PTEN in regulating injury-induced axonal growth.
Either neonatal or young adult PTEN deletion increased CST
sprouting by twofold to threefold. Although PTEN deletion
clearly and consistently promotes CST regeneration, the degree
of regeneration in the current study may not appear as visually
striking as in our previous study (Liu et al., 2010). A number of
variables influence the observed CST regeneration after PTEN
deletion, including gene deletion efficiency, injury type and
depth, survival time after injury, axon tracing efficiency, and
staining intensity. Even in the same study, the degree of regener-
ation observed may vary in different injury experiments due to
such variables (Liu et al., 2010).
Initiating PTEN deletion in young adult mice led to less CST
regeneration than initiating PTEN deletion in neonatal mice.
AAV infection is more efficient and covers a larger cortical area in
neonatal mice. Our unpublished data using the ROSA26-lsl-
tdTomato reporter line indicate that AAV infection rate is signif-
icantly higher among the BDA-labeled axons in P1 infected mice
than in young adult infected mice (ϳ70% vs ϳ45%). In addition,
the regeneration-inducing effect of PTEN deletion may decline
with increasing age. This could be due to changes in extrinsic
inhibitors, in neuronal responses to extrinsic inhibitors, and/or in
other neuron-intrinsic pathways that regulate axon regeneration in
an age-dependent manner (Byrne et al., 2014).
Concentration-dependent inhibitory effect of Nogo
Additionally deleting Nogo did not further enhance CST sprout-
ing but further increased CST regeneration in PTEN-deleted
mice. The effect of Nogo deletion was most noticeable at and
around the injury site where regenerating CST axons traveled
further in Nogo/PTEN doubly deleted mice. Intriguingly,
Nogo-A expression was also upregulated in neurons and oligo-
dendroglia at and around the injury site after dorsal hemisection.
Together, our data are consistent with the scenario that PTEN-
deleted CST neurons are not sensitive to the widespread, basal
level of Nogo-A throughout the cord but remain sensitive to the
highly concentrated Nogo-A at and around a spinal cord injury
site. Consequently, the absence of this Nogo-A upregulation (by
Nogo deletion) may allow regenerating axons in PTEN-deleted
mice to grow further past the injury site. In contrast, sprouting
CST axons in PTEN-deleted mice may have a sufficiently high
level of growth ability that they could simply ignore the wide-
spread, basal level of Nogo-A. Thus, it appears that a higher con-
centration of Nogo-A is required to inhibit axon growth from
CST neurons upon PTEN deletion.
Neuron-intrinsic growth state determines neuronal
responsiveness to changes in extrinsic inhibition
In the presence of PTEN, deleting Nogo has a detectable effect on
the sprouting of uninjured CST neurons but not the regeneration
of injured CST neurons. In the absence of PTEN where CST
regeneration and sprouting are already enhanced, additionally
deleting Nogo further increases CST regeneration but not sprout-
ing. This complex pattern of regulation of CST regeneration and
sprouting by axotomy, PTEN, and Nogo prompted us to propose
a working model where the level of neuron-intrinsic growth abil-
ity determines neuronal sensitivity to extrinsic growth inhibition
and consequently neuronal responsiveness to changes in extrin-
sic inhibition (Fig. 10).
Intact adult CST neurons, with a basal level of intrinsic axon
growth ability (Fig. 10, yellow neuron), are sensitive to the basal
level of extrinsic growth inhibitors. Reducing this inhibition (e.g.,
by Nogo deletion) can enhance axon sprouting from these neu-
rons. Axonal injury downregulates neuron-intrinsic growth abil-
ity of CST neurons (Fig. 10, red neuron). These neurons then
become sensitive even to a reduced level of extrinsic inhibition
such that they are unable to regrow axons even in the absence of
Nogo. Following PTEN deletion, neurons acquire an elevated
level of intrinsic growth ability (Fig. 10, green neuron), and con-
sequently are only sensitive to an elevated level of growth inhibi-
tion, such as that provided by upregulated Nogo-A at and around
an injury site. A reduction of extrinsic inhibition by Nogo dele-
tion may thus further enhance CST regeneration. Meanwhile,
these neurons are no longer sensitive to the basal level of extrinsic
inhibitors encountered by sprouting axons such that Nogo dele-
tion does not further enhance sprouting. Therefore, both axonal
injury and molecular manipulations of signaling pathways (e.g.,
PTEN/mTOR) can alter neuron-intrinsic growth state, which in
turn regulates neuronal responsiveness to changes in extrinsic
inhibitors. This seemingly complex interplay between neuron-
intrinsic and -extrinsic control of injury-induced axonal growth
may unify many divergent observations in the field of CNS axon
repair. The recognition that a certain level of neuron-intrinsic
growth state is required before altering extrinsic influence can
become effective may prove to be a guiding principle in develop-
ing therapeutic strategies to promote axonal repair after spinal
cord injury.
Limited functional recovery associated with enhanced CST
sprouting but not regeneration
CST sprouting and regeneration were significantly enhanced in
PTEN and PTEN/Nogo-deleted mice. Associated with the en-
hanced sprouting was a modest, temporary improvement in one
of three behavioral assays, whereas no improvement over control
mice was observed in any of the three behavioral assays with the
regeneration model. Thus, clear enhancement of CST regenera-
tion and sprouting is not necessarily accompanied by robust and
persistent improvement in behavioral recovery.
There are several considerations when interpreting these re-
sults. First, there is significant baseline sprouting from CST and
other tracts (Raineteau et al., 2001, 2002; Morris et al., 2011;
Hurd et al., 2013) that are associated with spontaneous functional
recovery after pyramidotomy. Second, our tests might not be
sensitive and/or specific enough to detect more subtle but persis-
tent functional improvement in PTEN and PTEN/Nogo-deleted
mice. Third, the number of regenerating CST axons in PTEN and
PTEN/Nogo-deleted mice is still low (no more than a few percent
compared with pre injury), and the distance of regeneration lim-
ited (Ͻ2 mm in 6 weeks). Fourth, deleting PTEN in both sides of
the cortex may be required to promote functional recovery after
spinal cord injury.
Regardless, the lack of robust behavioral improvement in
mice where CST sprouting and regeneration are clearly enhanced
after injury indicates the need for additional strategies to pro-
mote functional recovery. Recent studies implicated the impor-
tance of task-relevant rehabilitation (García-Alías et al., 2009), of
the relative timing between growth promoting treatment and
rehabilitative training (Maier et al., 2009; Marsh et al., 2011; Zhao
et al., 2013; Wahl et al., 2014), and of an enhanced level of spinal
cord excitability in combination with rehabilitative training (van
6426 • J. Neurosci., April 22, 2015 • 35(16):6413–6428 Geoffroy et al. • Nogo and PTEN in Injury-Induced Spinal Axon Growth
15. den Brand et al., 2012; Angeli et al., 2014). These mechanisms
remain to be explored to take full advantage of the anatomical
substrates provided by enhanced CST regeneration and sprout-
ing following manipulations of both neuron-intrinsic and
-extrinsic factors as described here.
References
Angeli CA, Edgerton VR, Gerasimenko YP, Harkema SJ (2014) Altering spi-
nal cord excitability enables voluntary movements after chronic complete
paralysis in humans. Brain 137:1394–1409. CrossRef Medline
Bartsch U, Bandtlow CE, Schnell L, Bartsch S, Spillmann AA, Rubin BP,
Hillenbrand R, Montag D, Schwab ME, Schachner M (1995) Lack of
evidence that myelin-associated glycoprotein is a major inhibitor of ax-
onal regeneration in the CNS. Neuron 15:1375–1381. CrossRef Medline
Basso DM, Fisher LC, Anderson AJ, Jakeman LB, McTigue DM, Popovich PG
(2006) Basso Mouse Scale for locomotion detects differences in recovery
after spinal cord injury in five common mouse strains. J Neurotrauma
23:635–659. CrossRef Medline
Bradbury EJ, McMahon SB (2006) Spinal cord repair strategies: why do they
work? Nat Rev Neurosci 7:644–653. CrossRef Medline
Byrne AB, Walradt T, Gardner KE, Hubbert A, Reinke V, Hammarlund M
(2014) Insulin/IGF1 signaling inhibits age-dependent axon regenera-
tion. Neuron 81:561–573. CrossRef Medline
Cafferty WB, Strittmatter SM (2006) The Nogo-Nogo receptor pathway
limits a spectrum of adult CNS axonal growth. J Neurosci 26:12242–
12250. CrossRef Medline
Cafferty WB, Kim JE, Lee JK, Strittmatter SM (2007) Response to corre-
spondence: Kim et al., “axon regeneration in young adult mice lacking
Nogo-A/B. Neuron 38:187–199.” Neuron 54, 195–199. CrossRef Medline
Cafferty WB, McGee AW, Strittmatter SM (2008) Axonal growth therapeu-
tics: regeneration or sprouting or plasticity? Trends Neurosci 31:215–220.
CrossRef Medline
Cafferty WB, Duffy P, Huebner E, Strittmatter SM (2010) MAG and OMgp
synergize with Nogo-A to restrict axonal growth and neurological recov-
ery after spinal cord trauma. J Neurosci 30:6825–6837. CrossRef Medline
García-Alías G, Barkhuysen S, Buckle M, Fawcett JW (2009) Chondroiti-
nase ABC treatment opens a window of opportunity for task-specific
rehabilitation. Nat Neurosci 12:1145–1151. CrossRef Medline
Geoffroy CG, Zheng B (2014) Myelin-associated inhibitors in axonal
growth after CNS injury. Curr Opin Neurobiol 27C:31–38. CrossRef
Medline
Grider MH, Chen Q, Shine HD (2006) Semi-automated quantification of
axonal densities in labeled CNS tissue. J Neurosci Methods 155:172–179.
CrossRef Medline
Herrmann JE, Shah RR, Chan AF, Zheng B (2010) EphA4 deficient mice
maintain astroglial-fibrotic scar formation after spinal cord injury. Exp
Neurol 223:582–598. CrossRef Medline
Huber AB, Weinmann O, Bro¨samle C, Oertle T, Schwab ME (2002) Pat-
terns of Nogo mRNA and protein expression in the developing and adult
rat and after CNS lesions. J Neurosci 22:3553–3567. Medline
Hurd C, Weishaupt N, Fouad K (2013) Anatomical correlates of recovery in
single pellet reaching in spinal cord injured rats. Exp Neurol 247:605–
614. CrossRef Medline
Ji B, Case LC, Liu K, Shao Z, Lee X, Yang Z, Wang J, Tian T, Shulga-Morskaya
S, Scott M, He Z, Relton JK, Mi S (2008) Assessment of functional re-
covery and axonal sprouting in oligodendrocyte-myelin glycoprotein
(OMgp) null mice after spinal cord injury. Mol Cell Neurosci 39:258–
267. CrossRef Medline
Kim JE, Li S, GrandPre´ T, Qiu D, Strittmatter SM (2003) Axon regeneration
in young adult mice lacking Nogo-A/B. Neuron 38:187–199. CrossRef
Medline
Kim JE, Liu BP, Park JH, Strittmatter SM (2004) Nogo-66 receptor prevents
raphespinal and rubrospinal axon regeneration and limits functional re-
covery from spinal cord injury. Neuron 44:439–451. CrossRef Medline
Lee JK, Zheng B (2012) Role of myelin-associated inhibitors in axonal repair
after spinal cord injury. Exp Neurol 235:33–42. CrossRef Medline
Lee JK, Chan AF, Luu SM, Zhu Y, Ho C, Tessier-Lavigne M, Zheng B (2009)
Reassessment of corticospinal tract regeneration in Nogo-deficient mice.
J Neurosci 29:8649–8654. CrossRef Medline
Lee JK, Geoffroy CG, Chan AF, Tolentino KE, Crawford MJ, Leal MA, Kang B,
Zheng B (2010) Assessing spinal axon regeneration and sprouting in
Nogo-, MAG-, and OMgp-deficient mice. Neuron 66:663–670. CrossRef
Medline
Lesche R, Groszer M, Gao J, Wang Y, Messing A, Sun H, Liu X, Wu H (2002)
Cre/loxP-mediated inactivation of the murine Pten tumor suppressor
gene. Genesis 32:148–149. CrossRef Medline
Liu K, Lu Y, Lee JK, Samara R, Willenberg R, Sears-Kraxberger I, Tedeschi A,
Park KK, Jin D, Cai B, Xu B, Connolly L, Steward O, Zheng B, He Z
(2010) PTEN deletion enhances the regenerative ability of adult cortico-
spinal neurons. Nat Neurosci 13:1075–1081. CrossRef Medline
Lu Y, Belin S, He Z (2014) Signaling regulations of neuronal regenerative
ability. Curr Opin Neurobiol 27C:135–142. CrossRef Medline
Ma XM, Blenis J (2009) Molecular mechanisms of mTOR-mediated trans-
lational control. Nat Rev Mol Cell Biol 10:307–318. CrossRef Medline
Madisen L, Zwingman TA, Sunkin SM, Oh SW, Zariwala HA, Gu H, Ng LL,
Palmiter RD, Hawrylycz MJ, Jones AR, Lein ES, Zeng H (2010) A robust
and high-throughput Cre reporting and characterization system for the
whole mouse brain. Nat Neurosci 13:133–140. CrossRef Medline
Maier IC, Ichiyama RM, Courtine G, Schnell L, Lavrov I, Edgerton VR,
Schwab ME (2009) Differential effects of anti-Nogo-A antibody treat-
ment and treadmill training in rats with incomplete spinal cord injury.
Brain 132:1426–1440. CrossRef Medline
Marsh BC, Astill SL, Utley A, Ichiyama RM (2011) Movement rehabilitation
after spinal cord injuries: emerging concepts and future directions. Brain
Res Bull 84:327–336. CrossRef Medline
Metz GA, Whishaw IQ (2009) The ladder rung walking task: a scoring sys-
tem and its practical application. J Vis Exp 28:pii1204. CrossRef Medline
Morris R, Tosolini AP, Goldstein JD, Whishaw IQ (2011) Impaired arpeg-
gio movement in skilled reaching by rubrospinal tract lesions in the rat: a
behavioral/anatomical fractionation. J Neurotrauma 28:2439–2451.
CrossRef Medline
Nakamura Y, Fujita Y, Ueno M, Takai T, Yamashita T (2011) Paired
immunoglobulin-like receptor B knockout does not enhance axonal re-
generation or locomotor recovery after spinal cord injury. J Biol Chem
286:1876–1883. CrossRef Medline
Park KK, Liu K, Hu Y, Smith PD, Wang C, Cai B, Xu B, Connolly L, Kramvis
I, Sahin M, He Z (2008) Promoting axon regeneration in the adult CNS
by modulation of the PTEN/mTOR pathway. Science 322:963–966.
CrossRef Medline
Raineteau O, Fouad K, Noth P, Thallmair M, Schwab ME (2001) Functional
switch between motor tracts in the presence of the mAb IN-1 in the adult
rat. Proc Natl Acad Sci U S A 98:6929–6934. CrossRef Medline
Raineteau O, Fouad K, Bareyre FM, Schwab ME (2002) Reorganization of
descending motor tracts in the rat spinal cord. Eur J Neurosci 16:1761–
1771. CrossRef Medline
Schwab ME, Strittmatter SM (2014) Nogo limits neural plasticity and re-
covery from injury. Curr Opin Neurobiol 27:53–60. CrossRef Medline
Silver J, Miller JH (2004) Regeneration beyond the glial scar. Nat Rev Neu-
rosci 5:146–156. CrossRef Medline
Simonen M, Pedersen V, Weinmann O, Schnell L, Buss A, Ledermann B, Christ
F, Sansig G, van der Putten H, Schwab ME (2003) Systemic deletion of the
myelin-associated outgrowth inhibitor Nogo-A improves regenerative and
plastic responses after spinal cord injury. Neuron 38:201–211. CrossRef
Medline
Song XY, Zhong JH, Wang X, Zhou XF (2004) Suppression of p75NTR does
not promote regeneration of injured spinal cord in mice. J Neurosci 24:
542–546. CrossRef Medline
StarkeyML,BarrittAW,YipPK,DaviesM,HamersFP,McMahonSB,Bradbury
EJ (2005) Assessing behavioural function following a pyramidotomy lesion
of the corticospinal tract in adult mice. Exp Neurol 195:524–539. CrossRef
Medline
Starkey ML, Bartus K, Barritt AW, Bradbury EJ (2012) Chondroitinase ABC
promotes compensatory sprouting of the intact corticospinal tract and
recovery of forelimb function following unilateral pyramidotomy in adult
mice. Eur J Neurosci 36:3665–3678. CrossRef Medline
Steward O, Zheng B, Banos K, Yee KM (2007) Response to: Kim et al., “axon
regeneration in young adult mice lacking Nogo-A/B. Neuron 38, 187–
199.” Neuron 54:191–195. CrossRef Medline
Steward O, Zheng B, Tessier-Lavigne M, Hofstadter M, Sharp K, Yee KM
(2008) Regenerative growth of corticospinal tract axons via the ventral
column after spinal cord injury in mice. J Neurosci 28:6836–6847.
CrossRef Medline
Thallmair M, Metz GA, Z’Graggen WJ, Raineteau O, Kartje GL, Schwab ME
Geoffroy et al. • Nogo and PTEN in Injury-Induced Spinal Axon Growth J. Neurosci., April 22, 2015 • 35(16):6413–6428 • 6427
16. (1998) Neurite growth inhibitors restrict plasticity and functional recov-
ery following corticospinal tract lesions. Nat Neurosci 1:124–131.
CrossRef Medline
Tuszynski MH, Steward O (2012) Concepts and methods for the study of
axonal regeneration in the CNS. Neuron 74:777–791. CrossRef Medline
Vajda F, Jordi N, Dalkara D, Joly S, Christ F, Tews B, Schwab ME, Pernet V
(2015) Cell type-specific Nogo-A gene ablation promotes axonal regen-
eration in the injured adult optic nerve. Cell Death Diff 22:323–335.
CrossRef Medline
van den Brand R, Heutschi J, Barraud Q, DiGiovanna J, Bartholdi K, Huerli-
mann M, Friedli L, Vollenweider I, Moraud EM, Duis S, Dominici N,
Micera S, Musienko P, Courtine G (2012) Restoring voluntary control
of locomotion after paralyzing spinal cord injury. Science 336:1182–1185.
CrossRef Medline
Wahl AS, Omlor W, Rubio JC, Chen JL, Zheng H, Schro¨ter A, Gullo M,
Weinmann O, Kobayashi K, Helmchen F, Ommer B, Schwab ME (2014)
Neuronal repair: asynchronous therapy restores motor control by rewir-
ing of the rat corticospinal tract after stroke. Science 344:1250–1255.
CrossRef Medline
Wang X, Chun SJ, Treloar H, Vartanian T, Greer CA, Strittmatter SM (2002)
Localization of Nogo-A and Nogo-66 receptor proteins at sites of axon-
myelin and synaptic contact. J Neurosci 22:5505–5515. Medline
Zhao RR, Andrews MR, Wang D, Warren P, Gullo M, Schnell L, Schwab ME,
Fawcett JW (2013) Combination treatment with anti-Nogo-A and
chondroitinase ABC is more effective than single treatments at enhancing
functional recovery after spinal cord injury. Eur J Neurosci 38:2946–
2961. CrossRef Medline
Zheng B, Ho C, Li S, Keirstead H, Steward O, Tessier-Lavigne M (2003)
Lack of enhanced spinal regeneration in Nogo-deficient mice. Neuron
38:213–224. CrossRef Medline
Zheng B, Atwal J, Ho C, Case L, He XL, Garcia KC, Steward O, Tessier-
Lavigne M (2005) Genetic deletion of the Nogo receptor does not re-
duce neurite inhibition in vitro or promote corticospinal tract
regeneration in vivo. Proc Natl Acad Sci U S A 102:1205–1210. CrossRef
Medline
Zheng B, Lee JK, Xie F (2006) Genetic mouse models for studying inhibitors
of spinal axon regeneration. Trends Neurosci 29:640–646. CrossRef
Medline
6428 • J. Neurosci., April 22, 2015 • 35(16):6413–6428 Geoffroy et al. • Nogo and PTEN in Injury-Induced Spinal Axon Growth