In a time of historically low bond returns and high realized and potential equity market
volatility, two strategies that investors are turning to are commodity trading advisors (CTAs)
and global macro hedge funds. In adopting these strategies, it is important for investors to
distinguish the similarities and differences between these strategies. CTAs in a hedge fund
portfolio can be both a complement to and a substitute for a global macro allocation.
Beginners Guide to TikTok for Search - Rachel Pearson - We are Tilt __ Bright...
Asset Alliance understanding managed futures
1. Hedgeharbor Navigator
June 2012
Understanding Managed Futures
In a time of historically low bond returns and high realized and potential equity market
volatility, two strategies that investors are turning to are commodity trading advisors (CTAs)
and global macro hedge funds. In adopting these strategies, it is important for investors to
distinguish the similarities and differences between these strategies. CTAs in a hedge fund
portfolio can be both a complement to and a substitute for a global macro allocation.
Overview of Managed Futures Evolution of the Futures Markets
Managed futures strategies are the general category of The futures markets were originally a way for producers
investment strategies into which CTAs fall. These and consumers of commodities to hedge price risk in an
managers implement a wide variety of trading economy weighted more heavily toward agriculture
strategies, but the common element of each is that they than it is today. As the United States and global
apply these systems primarily to futures contracts, over- economies have shifted away from an agricultural
the-counter spot and forward contracts (in the case of focus, so has the composition of the futures markets.
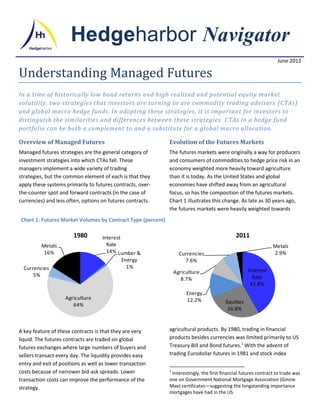
currencies) and less often, options on futures contracts. Chart 1 illustrates this change. As late as 30 years ago,
the futures markets were heavily weighted towards
Chart 1: Futures Market Volumes by Contract Type (percent)
1980 Interest 2011
Metals Rate Metals
16% 14% Lumber & Currencies 2.9%
Energy 7.6%
Currencies 1%
Agriculture Interest
5% Rate
8.7%
41.8%
Energy
Agriculture 12.2% Equities
64%
26.8%
A key feature of these contracts is that they are very agricultural products. By 1980, trading in financial
liquid. The futures contracts are traded on global products besides currencies was limited primarily to US
futures exchanges where large numbers of buyers and Treasury Bill and Bond futures.1 With the advent of
sellers transact every day. The liquidity provides easy trading Eurodollar futures in 1981 and stock index
entry and exit of positions as well as lower transaction
costs because of narrower bid-ask spreads. Lower 1
Interestingly, the first financial futures contract to trade was
transaction costs can improve the performance of the one on Government National Mortgage Association (Ginnie
strategy. Mae) certificates—suggesting the longstanding importance
mortgages have had in the US.
2. Table 1: Examples of Contracts that CTAs trade
Currencies
Equity Indexes Interest Rates Government Bonds (vs. US Dollar)
S&P 500 Eurodollar 30-Year US Treasury Bond Canadian Dollar
CAC-40 Fed Funds Rate German Bunds British Pound
DAX Short Sterling Japanese Government Bonds Euro
NASDAQ
Grains &
Energy Metals Soft Commodities Livestock
Crude Oil Gold Corn Live Cattle
Natural Gas Silver Soybeans Lean Hogs
Unleaded- Gasoline Copper Coffee Pork Bellies
Electricity Tin Wheat Feeder Cattle
Aluminum Sugar
futures in 1982, the futures industry took a decided turn variety of underlying asset classes with a diverse
toward financial instruments trading. These contracts geographic focus. Although global macro managers may
along with the Treasury Bill and Bond contracts also trade individual equities, as well as ETFs and cash
permitted financial market participants to hedge and bonds, futures are an important way they express a
speculate on a variety of financial risks. view in the markets they trade. As Table 1 illustrates,
futures contracts can cover the government bond
The development of these new futures contracts-
markets as well as the equity markets in a variety of
combined with the agricultural and industrial contracts
countries. In addition, the physical commodities—such
already in existence opened vast new opportunities for
as oil, gold or wheat—that managers in both strategies
traders in these instruments. Government regulation of
use are traded on global markets. As such, the price
the futures markets—part of which created the CTA
movements of these commodities reflect overall global
designation for an asset manager—also played a role in
economic strength or weakness, as well as the relative
the growth of the managed futures industry.
economic conditions of one versus others.
Prior to the development of futures markets in
In addition to trading similar instruments, the strategies
extensive and diverse underlying assets, futures traders
of CTAs and global macro managers can be assigned to
could still implement trading systems in the markets
similar categories. Both types of managers can take long
that did exist. Likewise, global macro managers could
and short positions in the markets that they trade. Both
implement their views in cash markets for government
can trade systematic strategies, discretionary strategies
bonds and equities, but while using already existing
or a combination of the two. Systematic strategies
futures markets for instruments such as precious
utilize quantitative models to identify trade
metals. The development of the futures markets,
opportunities and to make decisions about entry and
however, made taking positions in these markets easier
exit points for trades. Discretionary strategies rely on
and more capital efficient because margin requirements
the managers’ judgment to make trading decisions.2
on the futures exchanges enable managers to gain the
desired exposures to the markets with less upfront In order to identify the differences between CTAs and
commitment. The liquidity of the futures markets also global macro managers, it is necessary to make some
permitted manages to put on and take off positions generalizations. CTA managers often focus on the price
with relative ease. movements and trading volumes that individual
commodities display. If they utilize technical analysis as
How CTA and global macro strategies are
alike and different
2
Both CTAs and global macro hedge funds often trade For a fuller discussion of the strategies and styles that CTAs
the same instruments, namely futures contracts on a employ, see the Asset Alliance presentation, The Benefits of
Managed Futures, 2012
3. part of their trading strategy, price and volume data macro managers might not look at technical
may be the only data they look at. Even if CTAs view indicators—but they both observe and respond to the
commodity prices within a more fundamental, supply- same set of prices. Those prices in turn are influenced
demand framework, it will often be the case that they by the factors that the managers are responding to.
look at price movements most heavily in the trades that
One implication of the above observation is that CTAs
they make.
can be considered a subset of a larger trading strategy
Global macro managers in contrast, will often make that includes both CTAs and global macro manager. For
trading decisions with the context of an array of this reason, many investors include both CTAs and
macroeconomic data. The will base their view on “pure” global macro manages in their allocations to a
whether to take long or short positions in government global macro portfolio.
debt or equities in a particular country based on overall
CTA performance in different market
changes in such economic data. This is not to say that
environments
global macro managers ignore asset prices; clearly they
We shift our focus now to the performance of CTAs
do not. It is simply generally true that they base their
during different market environments. As any financial
trades on more than just prices.
market observer over the last two decades can attest,
Both types of managers can adopt relative value the market environment has varied greatly. The
strategies in their trading, meaning that they will take a environment in each market period has presented
long position in one instrument or market and a short different challenges to each asset class and strategy of
position in another. In such a case, each strategy will be investing.
basing their trade on the expectation that the spread
Although the division of the last twenty years into
between the instruments will tighten or widen,
different sub-periods is somewhat arbitrary, we have
depending on the type of position they have taken.
chosen to delineate the different environment into
Even in this case, however, the focus of their analysis
periods marked by crises. For that reason we chose the
will be different. CTAs generally will be focused on
following periods to examine the performance of CTAs:
historical relationships between the two instruments
themselves, while global macro traders will base their 1990-1998—the run-up to the Russian/Asian debt
judgments on spread widening or tightening on crises
macroeconomic relationships. 1998-2007—the period between the above crisis
Despite these differences in approach, however, for and the global financial crisis
both types of managers, the prices that both types of 2007-2012—the global financial crisis and its
managers observe and at which they trade are aftermath.
influenced by the same set of factors. Some CTAs might
Chart 2 depicts the performance of CTAs with respect to
not look at macroeconomic data, and some global other asset classes and to hedge funds generally in each
Chart 2: 1990-1998 1998-2007 2007-2012
20% 20% 16%
S&P
18% HFRI 18% 14%
500 TR
16% Index 16%
14% GSCI 12%
14% HFRI
12% Total 10% Bond
Compound ROR
Compound ROR
10% 12% Index Return
Barclay Barclay
Compound ROR
8% Index
8% 10% Bond CTA
CTA GSCI
6% Bond Index 8% Index 6% Index
Total Barclay S&P 500
4% Index 6% 4% S&P
Return TR GSCI
2% 4% CTA 500 TR
2% Total
0% Index HFRI
2% Return
-2% 0% Index
-4% 0%
-2% 0% 10% 20% 30%
-6% -2% 0% 10% 20% 30%
-4% -4%
0% 5% 10% 15% 20%
-6% -6%
Standard Deviation Standard Deviation Standard Deviation
4. of these two periods. In the first two periods, CTAs alpha that CTAs produce—that is the uncorrelated
produced a comparable compound returns to bonds, return relative to the benchmark under comparison—is
but with somewhat higher volatility. In all three periods, significant across the board. These data are monthly
CTAs produced lower volatility than either equities or numbers, so for example, from 2007-2012, CTAs
commodities. In the third period, CTAs have produced a monthly uncorrelated return of 0.4 percent
outperformed equities, commodities and hedge funds relative to the S&P 500.
overall. It is interesting to note that the risk and return
Table 2: Diversification benefits of CTAs
performance of CTAs has been much more stable during
Barclays GSCI HFRI Fund
these periods than have equities, commodities or S&P Aggregate Total Weighted
overall hedge funds. These charts demonstrate that 500 TR Bond Index Return Composite Index
while it is true that CTAs do not always outperform 1990-1998
Correlation -8.9% 14.0% 13.1% -10.8%
standard asset classes or hedge funds, the performance
Alpha 0.8% 0.4% 0.7% 0.9%
of the strategy overall is much more similar to the
1998-2007
performance of bonds than are other strategies.
Correlation -22.6% 27.9% 27.9% -3.7%
Diversification benefits of CTAs Alpha 0.5% 0.1% 0.4% 0.5%
2007-2012
A number of analyses have focused on the
Correlation -6.0% 0.8% 19.3% 18.9%
diversification benefits of CTAs in an overall portfolio.
Alpha 0.4% 0.4% 0.4% 0.4%
We focus here on two indicators of this diversification
benefit—correlation and alpha.
Final thoughts
Table 2 presents these two statistics for the same three
time periods as in the risk-return comparison above. As In this article we have shown how CTAs compare as an
the table shows, CTAs have exhibited a low or negative investment strategy to global macro hedge fund
correlation to equities in all three periods that we strategies. In general, CTAs can be considered either a
examine. CTAs are also negatively correlated to a broad substitute or a complement to global macro
hedge fund index in two of the three periods—the strategies—despite the differences in the approaches—
aftermath of the global financial crisis being the because the instruments they trade are responding to
exception. CTAs also show a low correlation to both the same conditions in the global economy. We have
bonds and commodities in all three periods. Recent also seen how the performance and diversification
months represent examples of the lack of correlation. In characteristics of CTAs can add value in an overall asset
May, when the S&P 500 Index was down 6.1 percent, allocation. We have also seen that over the period since
the Barclay CTA Index rose 2.7%; In contrast, for June 1990, the performance of CTAs contrasts with the
the CTA Index fell 1.62% whereas the S&P rose 4.1 performance of commodities in having lower volatility.
percent. The staff of Hedgeharbor will be glad to discuss further
As more evidence that CTAs provide diversification, the how one or more CTA managers can add benefit an
alpha that they produce relative to other investments is existing portfolio—whether or not it already contains a
significant in each of the time periods we consider. The hedge fund allocation. We look forward to discussing
this issue further.