1. Microsimulating the distributional effects of carbon taxation:
Its impacts on equity
Audrey Berry
Centre International de la Recherche sur l’Environnement et le Développement, 45 Avenue de la Belle Gabrielle 94130 Nogent-sur-Marne, France
berry@centre-cired.fr
It is possible to correct this regressive impact, if the tax is accompanied by
measures which compensate for loss of income.
A carbon tax was introduced in France in 2014.
It affects all fossil fuels except electricity
(already covered by the EU ETS). The tax level
rises over time to achieve the 2030 and 2050
GHG emission reduction targets.
Revenues generated by the
carbon tax offer an
opportunity to design a
progressive carbon taxation
package:
- aim at budget neutrality for
households
- respect equity principles
between affected groups of
the population
How? For each recycling option, the objective is to evaluate the minimum
amount of cash transfer which makes the carbon tax become
progressive, based on the Suits index of progressivity.
Combining a flat recycling scheme with a cash transfer targeted at
the income poor could correct for regressivity by recycling between
17 and 60% of the revenue generated by the French carbon tax.
mean = 0.39%
0,68%
0,46%
0,43%
0,42%
0,37% 0,37%
0,33% 0,32%
0,28%
0,23%
0.00%
0,10%
0,20%
0,30%
0,40%
0,50%
0,60%
0,70%
0,80%
1 2 3 4 5 6 7 8 9 10
%ofdisposableincome
Income decile
carbon tax for housing carbon tax for travelling total carbon tax
Households can be offered monetary
compensations. Options for recycling of tax revenue
differ in terms of size and eligibility:
flat recycling: same amount transferred to
every household
size-based recycling: the amount transferred
is adjusted to the household composition
targeted recycling (income poor): only
households with an income below the poverty line
are eligible
combination: flat recycling + targeted at the
income poor
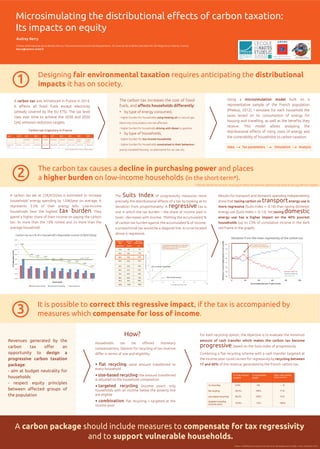
The carbon tax causes a decline in purchasing power and places
a higher burden on low-income households (in the short-term*).
A carbon package should include measures to compensate for tax regressivity
and to support vulnerable households.
A carbon tax set at 22€/tCO2eq is estimated to increase
households’ energy spending by 120€/year on average. It
represents 3.5% of their energy bills. Low-income
households bear the highest tax burden. They
spend a higher share of their income on paying the carbon
tax: 3x more than the 10% richest and 2x more than the
average household.
Designing fair environmental taxation requires anticipating the distributional
impacts it has on society.1
2
3
Using a microsimulation model built on a
representative sample of the French population
(Phebus, 2012), I simulate for each household the
taxes levied on its consumption of energy for
housing and travelling, as well as the benefits they
receive. This model allows analysing the
distributional effects of rising costs of energy and
the vulnerability of households to carbon taxation.
Results for transport and domestic spending independently
show that taxing carbon on transportenergy use is
more regressive (Suits Index = -0.18) than taxing domestic
energy use (Suits Index = -0.13). Yet taxing domestic
energy use has a higher impact on the 40% poorest
households (up to 23% of cumulative income in the dark
red frame in the graph).
The Suits Index of progressivity measures more
precisely the distributional effects of a tax by looking at its
deviation from proportionality. A regressive tax is
one in which the tax burden – the share of income paid in
taxes - decreases with income. Plotting the accumulated %
of carbon tax burden against the accumulated % of income,
a proportional tax would be a diagonal line. A curve located
above is regressive.
The carbon tax increases the cost of fossil
fuels, and affects households differently:
• by type of energy consumed,
- higher burden for households using heating oil vs natural gas.
Electricity consumption are not affected.
- higher burden for households driving with diesel vs gasoline.
• by type of households,
- higher burden for low income households
- higher burden for households constrained in their behaviour:
poorly insulated housing, no alternative for car use, etc.
0 20 40 60 80 100
-4-3-2-10123
Lorenz curves for the carbon tax
Accumulated percent of total income
Differenceinaccumulatedpercentoftaxburden
Domestic carbon tax
Transport carbon tax
Total carbon tax
Deviation from the mean regressivity of the carbon tax
Carbon tax trajectory in France
Data Tax parameters Simulation Analysis
Carbon tax as a % of a household’s disposable income (22€/tCO2eq)
*without taking into account recycling of carbon tax revenue, meaning only direct & non-equilibrium impacts.
Chaire « Modélisation prospective au service du développement durable », Paris, December 2016