
Recommandé
Recommandé
Contenu connexe
Similaire à Annual Outlook 2023.pdf
Similaire à Annual Outlook 2023.pdf (20)
Dernier
Dernier (20)
Annual Outlook 2023.pdf
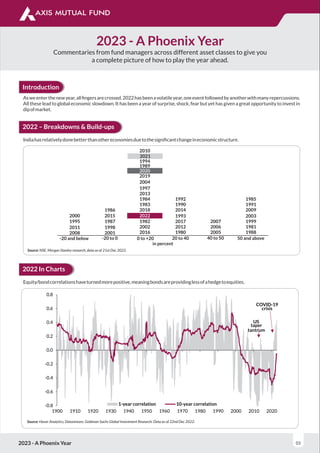
- 1. 2023 - A Phoenix Year Commentaries from fund managers across different asset classes to give you a complete picture of how to play the year ahead. Introduction Asweenterthenewyear,allfingersarecrossed.2022hasbeenavolatileyear,oneeventfollowedbyanotherwithmanyrepercussions. All these lead to global economic slowdown. It has been a year of surprise, shock, fear but yet has given a great opportunity to invest in dipofmarket. 2022 – Breakdowns & Build-ups 2023 - A Phoenix Year 01 Source: NSE, Morgan Stanley research, data as of 21st Dec 2022. 2022 In Charts Equity/bondcorrelationshaveturnedmorepositive,meaningbondsareprovidinglessofahedgetoequities. Source: Haver Analytics, Datastream, Goldman Sachs Global Investment Research. Data as of 22nd Dec 2022. -0.8 -0.6 -0.4 -0.2 0.0 0.2 0.4 0.6 0.8 1900 1910 1920 1930 1940 1950 1960 1970 1980 1990 2000 2010 2020 1-year correlation 10-year correlation US taper tantrum COVID-19 crisis -20 and below -20 to 0 0 to +20 in percent 20 to 40 40 to 50 50 and above 2008 2011 1995 2000 2001 1998 1987 2015 1986 2016 2002 1982 2018 1983 1984 2013 1997 1980 2012 2017 1993 2014 1990 1992 2005 2006 2007 1988 1981 1999 2003 2009 1991 1985 2022 2004 2019 2020 1989 1994 2021 2010 Indiahasrelativelydonebetterthanothereconomiesduetothesignificantchangeineconomicstructure.
- 2. 2023 - A Phoenix Year 02 PremiumforIndiahasincreasedovertheyearsinallaccountsonbackofimprovedROE. 2022 2021 2020 ValuationsataGlance India EM Premium India EM Relative India EM Relative 24.7 12.3 2.0 26.9 14.0 1.9 36.7 21.7 1.7 PE 23.0 12.2 1.9 23.0 12.4 1.9 23.3 14.9 1.6 FwdPE 3.6 1.6 2.2 3.8 1.9 2.0 3.3 2.0 1.6 PB 1.3% 3.4% -2.1% 1.0% 2.4% -1.3% 1.0% 2.0% -1.0% DivYield 14.4% 12.9% 1.5% 14.2% 13.4% 0.8% 8.9% 9.2% -0.3% ROE Source:AxisMFResearch,GS. Pastperformancemayormaynotbesustainedinthefuture. Equity Markets in India Source: Axis AMC Research, News Reports. Data as of 21st December 2022. Equity markets this year saw a roller coaster ride driven by global tailwinds and rising favour for the India growth story. Amidst turbulenceintherestoftheEMbasket,Indiastoodoutasafavoureddestinationforglobalinvestors. Domestic Flow support Source: Bloomberg, NSDL, BSE website, I-Sec Research Domestic flows worked as saviour from outflows of foreign investors which kept the equity market resilient. FPI flows continued to be relatively stable even after the hawkish stance. The flows have been driven by domestic economy sectors such as financials, consumer discretionary,industrials,FMCG,healthcareandtelecom.However,sectorsdrivenbyglobalfactorssuchasenergyandITweresoldby FPIs. 15,000 15,500 16,000 16,500 17,000 17,500 18,000 18,500 19,000 Dec-21 Jan-22 Feb-22 Mar-22 Apr-22 May-22 Jun-22 Jul-22 Aug-22 Sep-22 Oct-22 Nov-22 Dec-22 NIFTY & Newsflow Gov. imposes windfall tax imposed on Oil producers Economic survey, F23 Budget tabled by Finance Minister in the parliament Russia Ukraine crisis escalates with Russia attacking Ukraine RBI hikes repo rate by 50 bps to 4.9% New Government formed in Maharashtra New ODI regulations: Govt allows investment in financial services abroad RBI Forex Reserves at lowest level in over 2 years INR/USD at 83, all time high RBI hikes policy rates by 35 bps to 6.25% Crude oil prices Surge to $130/bbl amid Intensifying Russia-Ukraine war US Fed approves 0.25% hike Food CPI accelerated to 8.6% YoY in Sep from 7.6% in Aug, highest since Dec-2020
- 3. 2023 - A Phoenix Year 03 Gratus Maximus India Source: Bloomberg, Citi Research Markets have had a wild ride this year and likely to end at square one. We witnessed some serious ‘airtime’ (Ref rollercoasters) as investors who up until last year were comfortably coasting one way UP! As the world faces many challenges they have experienced a rollercoasterinvestmentrideandtestedpatienceofmany. - By Jinesh Gopani - Head Equity – Axis Mutual Fund Valuation India’sabsoluteandrelativevaluationsremainnearmulti-yearhighs.NIFTYEPSgrowthexpectationsstandat13%/13%forFY23Eand 14%/17%forFY24Erespectively.Onayieldgapbasis,themarketlooksstretchedonvaluations. NIFTY: 1Y Forward Valuation Bond Yield Gap Source: Bloomberg, Citi Research Source: CMIE, Morgan Stanley research Credit Growth Credit growth story remains strong for India with Loan growth for PSU banks at 15% and Pvt banks at 20%+. Consensus positive on Banks,morethanNBFCsonconcernsoverrisingdeposit/liabilitycost.creditgrowthistrackingat17.9%asofOctober2022vs.6.8%in October2021and7.1%pre-pandemic.Further,industrycreditgrowthhasrisento12.6%YoYinSeptember2022,itshighestsinceApril 2014. The growth so far has been driven by Retail and SME loans, which are currently outpacing large-ticket loans, but there could be some moderation in housing loan growth ahead, given rising rates. Large industries’ loan growth has been improving as well (8% YoY as of Nov’22 vs 1% in FY22); it is expected to sustain given the rise in industrial capacity utilization and the improvement in outlook for public&privatecapexrecovery. Source: CEIC, RBI, Citi Research Capex Cycle Public capex in the current fiscal year is expected to reach its highest level since FY09, push is likely to continue in the pre-election year in 2023. Increase in public sector spending augments private sector spending as well. Hence, cash flow generation remained healthy in FY22andsupportedtheearlyphaseofprivatecapexrecovery.Also,assetturnsinselectsectorsareabovehistoricallevels,whichraises thechancesofcapex.Private-sectorcapexintentionsareseeingsignsofimprovement-4QMAVofnewprivateprojectannouncements isatitshighestlevelsince4QFY09.
- 4. 2023 - A Phoenix Year 04 Source: Budget documents, Citi Research Estimates Source: CMIE, Citi Research Source: CMIE, Citi Research Source: Bloomberg, Citi Research Earnings Earnings expectations for FY23E have started to see downward revisions since 2HCY22 – reversing a trend of upgrades (Oct’20- Dec’21) and flattish revisions (Jan’22-Jun’22) seen since 2HFY21. Consequently, FY23E EPS is down 4% in 2HCY22 while FY24E EPS hasalsoseenmarginaldeclines(2%in2HCY22).NIFTYEPSgrewat~12%CAGRoverFY15-23E. NIFTY Trailing 12M earnings growth trend Source: Bloomberg, Citi Research NIFTY Earnings Revision Trend
- 5. Rural Revival Source: CMIE, RBI, Company Data, CSO, CEIC, Haver Analytics, Morgan Stanley Research. From a demand perspective, improvement in rural consumption trends is one of the key factors. We believe rural demand starts to recover – Urban demand indicators such as passenger vehicle sales growth was largely steady while rural demand indicators such as twowheelersales,tractor,fertilizersalesandagriculturecreditshowedsomepickup. 2023 - A Phoenix Year 05 Rural Economy Tracker Holds Up View for 2023 In 2023, we expect growth trends to remain decent. Themes that the markets will look out for include rural recovery, private capex, sustainabilityofcreditgrowth,globalslowdownimpacts,rates,andinflation.Flowsprovidesupport–resilientdomestic&improvingFII flows – along with a weaker USD. India’s macroeconomic stability, relatively resilient EPS growth and conducive flow environment justifyIndia’spremiumvaluations,buttheupsidepotentialappearslimited. Key Focus Areas for 2023 • Consumption – Rural Recovery: Better winter crop, potential pre-election budgetary support for the rural economy, early green shootsinruralemployment/wages.Ruralconsumptioncouldbeatrickshot • Capex Cycle and Credit Growth: Public capex cycle has improved in FY23; we would watch for private capex recovery, given improving capacity utilization, a favourable policy environment (PLI Schemes + ongoing China+1 strategy), strong corporate b/s andcashflows,largeindustries’loangrowth. • Margin Risks: Bottom-up earnings expectations for FY24E are baking in margin expansion as well as decent growth momentum. RisksaretothedownsidegivenFY24EConsensusNIFTYEPSiswellabovetherecentacross-cyclegrowth. • Flows and Global Backdrop: USD decline is favourable for EM inflows & India should benefit (especially passive flows – India’s weightinbenchmarkisatlifehighs).ActiveportfolioscontinuetoremainsignificantlyunderweighttoEMbenchmarkweights.
- 6. Source: Style data provided by Bernstein Quant Research 31/01/2012 30/04/2012 31/07/2012 31/10/2012 31/01/2013 30/04/2013 31/07/2013 31/10/2013 31/01/2014 30/04/2014 31/07/2014 31/10/2014 31/01/2015 30/04/2015 31/07/2015 31/10/2015 31/01/2016 30/04/2016 31/07/2016 31/10/2016 31/01/2017 30/04/2017 31/07/2017 31/10/2017 31/01/2018 30/04/2018 31/07/2018 31/10/2018 31/01/2019 30/04/2019 31/07/2019 31/10/2019 31/01/2020 30/04/2020 31/07/2020 31/10/2020 31/01/2021 30/04/2021 31/07/2021 31/10/2021 31/01/2022 30/04/2022 31/07/2022 Longer term premium (Discount) to markets Quality basket Valua ons rela ve to market Expensive Cheap However, this also provides for optimism going forward as the markets cannot continue to disregard for too long stocks that have good quality/growthfundamentalsandreasonablevaluations.Whenitdoes,wehopetocaptureitbyhavingtherightsetofexposures. Lastly, the markets as a result of their strong performance on an absolute basis and outperformance on a relative basis are trading at significant premium to longer term averages. While the strong fundamentals may justify these levels today, it still requires close monitoring. 2023 - A Phoenix Year 06 Quant-ifying The Markets WhileNiftyis“only”up8%yeartodate(AsofNov30th),ithashadagreatyearcomparedtoitsdevelopinganddevelopedmarketspeers. Forinstance,NiftyhasoutperformedS&P500by22.50%inlocalcurrencytermsand13.3%inUSDterms.Furtherthisoutperformance has been quite consistent across months and quarters. However, if we scratch the surface and look at the details this doesn’t look like a traditionalupmarketenvironment.Largecapoutperformedmid/smallcapandRupeeexperienceddepreciationthoughmuchlessthan itsemergingmarketpeers. Further from a style perspective, all front line styles i.e. Growth, Value and quality lagged the markets this year. This meant that strategies be it Fundamental or Quantitative that relied on these styles also struggled. In fact, what worked this year aside from Large cap was exposure to stocks that had high Beta or were more volatile. That has also resulted in most frontline styles trading at cheaper valuationscomparedtotheirrespectivehistory.Forinstance,belowisthechartforthestyleQualityasdefinedbyROICandonecansee itistradingatdiscounttolongertermaverage. By Karthik Kumar – Portfolio Manager – Quant Strategies
- 7. 2023 - A Phoenix Year 07 Terminus? Pivot, please! 1 2 It has been an annus horribilis for bonds. Indian government bonds have returned 3.1% so far this year , placing this year at the bottom percentile for annual returns since 2005 measured quarterly. For global bonds, though it was the worst year on record. The Bloomberg AggregateIndexwhichisthebroadestbondbenchmarksisdownover15%yeartodate,whichprettymuchensuresthatthisyearwillbe theworstyearonrecord(goingbackover30years). - By R Sivakumar - Head Fixed Income – Axis Mutual Fund The story of the year has been inflation both here and globally. With inflation has come rate hikes by global central banks. These rate increasesalsomeanthattheeraofnegativeyieldingdebtisnearitsend.Atitspeak,Bloombergestimatedthatabout$18trillionworth 3 ofbondshadnegativeyields.Thecurrentestimateisunder$700billion . CentralBank LatestInflationReading Ratehikesin2022inbps ReserveBankofIndia 5.9% 290 USFederalReserve 7.1% 425 EuropeanCentralBank 10.1% 250 BankofEngland 10.7% 325 4 BankofJapan 3.7% Nil Dataasof21stDecember2022.Source:Bloomberg,Respectivecentralbanks. Lookingatthetableabove,Indiaisnotdoingtoobadlyontheinflationfront.Indeed,sinceSeptember2021,Indianinflationprintshave beenbelowtheUSinflation.Anastoundingstateofaffairs. The developed world is grappling with inflation rates not seen in four decades taking most economists and the market by surprise. This has been led by a general rise in commodity prices from the 2020 lows exacerbated by the Russian invasion of Ukraine in February. In addition, governments have provided pandemic related stimulus, which to a large extent were monetized by the respective central banks (including in India). However, even a perfect foresight on inflation and the global bond rout would barely have helped if one was investingthisyear: Asset Rationale YTD Performance (US$) Equity (MSCI World) Inverse correlation to bonds, nominal asset (i.e. revenues gain with inflation) -19.2% TIPS (0-5 year treasury inflation Inflation linked returns -2.5% protected securities) REIT (MSCI Reit) Real assets should appreciate with inflation -27.1% Gold Traditional inflation hedge -0.7% Source: Bloomberg, MSCI, Axis MF Research. Data as of 21st December 2022. Past performance may or may not be sustained in the future. Itisremarkablethatnothingseemstohaveworked.Goldisclosetobreakingeventhankstoalaterally,thoughitisstilldownnearly5% sincejustbeforetheRussianinvasion.Eveninflationprotectedsecuritiesaredown.Amazingly,longdatedinflationprotectedsecurities aredownnearly30%prettymuchin-linewithperformanceofnominallongdurationtreasuries. 1 AsIwritethisnoteon21stDecember,IamremindedoftheuseofthisphrasebyKofiAnnan,thentheUNSecretaryGeneralon21stDecember2004,justfivedaysbeforetheIndianOcean Tsunami.Hopefullythisreferencedoesnotpresagesomesimilardisaster. 2 UsingCCILBroadTotalReturnIndextorepresentperformance.Letushopethatpastperformanceisnotindicativeoffuturereturns. 3 Iamconvincedthathistorywilljudgetheabominationthatisnegativeinterestratesasoneoftheworstinnovationsinfinance. 4 Thoughincreasingthebandfor10-yearyieldupwardby25bps
- 8. 2023 - A Phoenix Year 08 That,then,isthebadnews.Whatliesaheadin2023? Firstly,centralbanksaregettingseriousaboutinflationandarethuslikelytocontrolinflation.Thecumulativeincreasesof200-300bps in policy rates now imply real positive rates, i.e. policy rates higher than projected inflation. In such a situation it is likely that inflation stopsrisingand,overtime,beginstodecline.Whileitiswrongtoassumeanimminentendtoinflation,itisreasonabletoexpectinflation toreturntotargetinthecomingtwoyears. As central banks get comfortable with the trajectory of inflation, they will pause raising rates – and eventually begin cutting rates. Where they pause (the so-called terminal rate) and when they cut (pivot) then become the new talking points for the market. While there have been many calls on a Fed pivot, it is wise to remember that having been burnt by inflation, central banks are going to be very conservativeinturningpolicyaround.ThisisgoingtoapplytotheRBIasitdoestodevelopedcountrycentralbanks. Inthemeantime,enjoythefactthatbondyieldsareexpectedtobeaboveinflation. 5 Segment Yields RBIprojectionofinflationJunetoSep2023 1-yearT-bills 6.9% 1-yearCD 7.6% 5-yearG-Sec 7.2% 5.0 - 5.4% 10-yerG-Sec 7.3% 5-yearAAA 7.5% Source:Bloomberg,FBIL,RBI,AxisMFResearch.Dataasof21stDecember2022 As may be seen, across a range of instruments, the yields are clustered around 7.25%. Unless we expect significant capital gains from fallingyieldsitmakessensetogoforcarry.Thesegmentonechoosesdependsontheholdingperiod. What determines the direction of rates from here on and consequently performance of bonds? To be sure the most important factor is going to be the trajectory of inflation. We do expect that the worst of inflation is behind us, although it is premature to believe that the worldreturnstotargetinflationintheverynearterm. Growth is not on central banks’ agenda. But the market expects a recession in the US. If there is a significant recession, that will change theexpectedinflationtrajectoryandbringforwardapivot.Ashallowrecessionwillkeeprateshigherforlonger.Globalgrowthoutlook is also dependent on China opening up after nearly three years under rolling lockdowns. Chinese demand for commodities poses a risk forpricesbutsupplychainissuescouldgetresolvedsothatthenetimpactisbenign. A continuing risk for Indian bonds is the fiscal trajectory. The budget is expected to bring about some consolidation. But a large borrowingprogrammeintheabsenceofRBIsupportcanbechallengingforthebondmarket. Over the past few years, there has been a large deterioration in the fiscal position of the centre and the states. Both the central 6 governmentandcombinedgeneralgovernmentdeficitsareatornearrecordhighs(datagoingbacktoFY1981 )asapercentageofGDP. 5 Source:FBILandBloomberg 6 Source:RBI What is interesting is that despite the pandemic, tax revenues have held up, and the rise in deficit is largely attributable to increased spending.TaxesasapercentageofGDPdroppedduringthepandemicby140basispoints,whiledeficitsrose747basispoints(FY19to FY21.Theriseindeficitis457basispointsfromFY19toFY23usingbudgetestimates). 0 500000 1000000 1500000 2000000 2500000 3000000 2000 2002 2004 2006 2008 2010 2012 2014 2016 2018 2020 2022 Fiscal Deficit (` cr.) Central Deficit Combined Deficit 0.0% 2.0% 4.0% 6.0% 8.0% 10.0% 12.0% 14.0% 2000 2002 2004 2006 2008 2010 2012 2014 2016 2018 2020 2022 Fiscal Deficit (% of GDP) Central Deficit (% of GDP) Combined Deficit (% of GDP) FRBM Target
- 9. Highfiscaldeficitsgiverisetomultiplefears: • Twin deficits: high fiscal deficits are often accompanied by high current account deficits. Potentially this can lead to currency depreciation. • Inflation:especiallyasdeficitsaremonetizedbythecentralbankthroughmoneycreation. • Drag on growth: through crowding out of private sector. At over 10% of GDP, gross combined fiscal deficit is about equal to the grosshouseholdfinancialsavings. The impact of fiscal health on growth, inflation and currency means that we should pay a lot of attention to the budget announcements regardingtodeficitsbothintheyearaheadandtheexpectedtrajectoryforthefollowingyears. We should expect some consolidation in the deficit. The two periods of consolidation we have seen in central fiscal deficit (% of GDP) afterthepassageoftheFRBMAct(2003to2008and2012to2017,seerightsidechartabove)haveoccurredthroughanincreaseinthe nominal GDP rather than an actual reduction in the deficit. Even currently, with nominal GDP expanding in double digits thanks to high inflation, the centre’s fiscal deficit can fall from 6.4% to 5.8% assuming a similar nominal growth as assumed for the current year. This is still too high to sustainably reduce growth and inflation risks. A real positive could be a genuine fiscal consolidation that brings deficit below5.5%. IfIcansummarizeourthoughtstherefore: • Theworstofinflationappearstobebehindus. • Centralbanks,includingRBI,arenearingtheendoftheratehikecycle. • Realpositiveratesfrombondsprovidegoodvalueforinvestors. • Risksremainonglobal,growthandfiscalfronts,butappeartobemoderatecomparedtothepastfewyears. Overallwedoexpect(andhope)forarelativelyuneventfulyearahead.Afterthreeyearsmarkedbyapandemic,awar,andratehikes;we deservethat. OnbehalfofthefixedincometeamatAxisMF,Iextendtoyouourseason’sgreetingsandwishyouahappynewyear. 0.0% 2.0% 4.0% 6.0% 8.0% 10.0% 12.0% 14.0% 16.0% 18.0% 20.0% 2000 2002 2004 2006 2008 2010 2012 2014 2016 2018 2020 2022 Tax Revenue (% of GDP) Tax Receipts (% of GDP) 2023 - A Phoenix Year 09
- 10. 2023 - A Phoenix Year 10 Global and thematic equities – Light at end of the tunnel StartingwithawarinEurope,2022wasayearmostinvestorswouldratherforget. Putin’sinvasionofUkraineledtomassivespikesinenergyandfoodcostsatatimewhenpost-pandemicsupply-chainbottleneckswere already putting substantial pressure on global prices. Central bankers, mostly with mandates to manage inflation, were faced with the veryrealprospectofarampantcost-pricespiral. Unusually,theyalsofacedtheunenviabletaskoftryingtoreininwagegrowthexpectationsatatimewhenunemploymentinmostmajor economieswasatextremelylowlevels.Thescopeforerrorwas,andstillis,great. Despitemarketfears,wearen’theadingbacktothe1970s At the time of writing, headline inflation rates in many countries are still high or increasing. There are legitimate fears that central bank actions may not be sufficient to counter rising wage demands and there is talk of a return to the stagflation (stagnant growth/high inflation)ofthe1970s. However,althoughthepriceshockof2022issomewhatcomparabletothatera,itisnotablethatunderlyinginflation(oftenreferredto as “core inflation”) already appears to be moderating. This will likely continue over the coming months as easing supply chains, higher borrowingcosts,squeezedconsumerincomesandfallinghousepricesservetocooltheglobaleconomyanddampendemand. - By Alex Teddar - Head and CIO of Global and US Equities – Schroders Source: New York Fed, Schroders, Axis MF Research. Data as of 21st December 2022. Global Supply Chain Pressure Index -1 0 1 2 3 4 5 May-18 Nov-18 May-19 Nov-19 May-20 Nov-20 May-21 Nov-21 May-22 Nov-22 Againstthisbackdropitisconceivablethatwagedemandswillalsomoderate.Manyobserverspointtotheongoinglabourshortagesin many countries and rapid increase in strike action as reasons to be cautious about wage inflation. However, we suspect that labour flexibility will improve as economies slow. Companies will undoubtedly postpone hiring and trim workforces. Indeed, there are already clearsignsofthisinthetechnologysector,wheremanagementrhetorichassuddenlycaughtupwitheconomicreality. In addition, it is possible that the participation rate, currently at record lows, will increase as non-participants, such as many over-50s, decidetore-entertheworkforce. Finally, it is likely that the recent trend toward labour substitution through automation will accelerate meaningfully, particularly given recenttechnologicalprogress. In short, while a return to mass unemployment looks unlikely, it is entirely possible that a rise in vacancies, coupled with a modest increaseinthenumberofparticipants,capswagecostsinthefuture. Fears of a deep recession may prove unfounded An ongoing economic slowdown seems inevitable given the above, but fears of a deep recession may prove unfounded, at least in some countries. With unemployment so low, consumers are better able to weather higher costs. Government action to provide support with energybillsalsocushionsthatimpacttoo.Itisnotablethathouseholdbalancesheets,whichbenefittedfromaconsiderablebuild-upof savings during the Covid-19 pandemic, provide a buffer for many consumers (although clearly not sufficiently for the poorest income groups). Thepictureissimilarinthecorporatesector,whereleverageisrelativelylowandoflonger-than-averageduration. Overall, the above suggests to us that, while material economic challenges remain, inflation may be less entrenched and the economic downturn less severe than many envisage. This is potentially most likely in the US, which is effectively self-sufficient in energy, benefits substantially from the fact that nearly all major commodities are priced in US dollars and has positive immigration. In Europe, including theUK,thepictureisunfortunatelymuchmorenuanced.
- 11. 2023 - A Phoenix Year 11 An earnings recession Recession or not, earnings estimates will have to come down. One of the interesting features of the current market cycle is that while sharepriceshavecollapsed,earningshavesofarmostlybeenremarkablyrobust.Thereasonforthisispricing. OnbothsidesoftheAtlantic,companieshaveputthroughpriceriseswithimpunity:Pepsihad+17%positivepricinginthethirdquarter, forexample,whileinEuropeLouisVuittonandNestlebothhaddouble-digitpriceupliftswithlittleimmediateimpactonvolumes. In these specific cases revenues may well hold up, since consumers appear willing to pay up for premium products. However, for many companiesitisonlyamatteroftimebeforenegativeelasticitykicksinanddemandstartstofall. Early indications from the likes of Amazon and Target in the US, or M&S, H&M and Primark in Europe suggest that consumers are alreadycuttingtheirspending. Revenue and margins (excluding energy companies) look likely to fall in 2023, creating a proper earnings downgrade cycle that is yet to befullyreflected. Finding the bottom may sound counter-intuitive given the above, but our view is that the current bear market has nearly run its course. Albeitwiththecaveatthatvolatilityislikelytoremainelevatedforsometimetocome. ConsensusS&P500earningspershareof$225and$235stilllooksomewhathigh,andweexpectthesetobereviseddownsteadilyover thecomingmonths,withthetroughtooccurinthethirdquarterof2023. But stock markets always look ahead, typically discounting a trough in earnings six to nine months ahead of the actual trough. That suggests that the recent bounce in global equity markets (the Dow index had its best month since 1976 in October) was not without logic,althoughwedobelievetherecentrallytobesomethingofafalsedawn. Intheveryshort-term,theremaybesomefurtherdisappointmenttocome,asprofitabilitypressuresbecomemoreapparent. Navigating the bear market Most bear markets trough around 9 months before a recovery in corporate earnings per share
- 12. 2023 - A Phoenix Year 12 Risk and return We haven’t dwelt on ongoing geopolitical risks, such as further escalation in Ukraine; the possibility of further reduction in Russia’s gas supply to Europe; or China’s stance on Taiwan. These are potential “Black Swan” events that are binary in nature and impossible to predictwithanycertainty. Anyoneofthesepossibilitieswouldbeextremelybadforglobalmarkets.Onemusthopethatcommonsensewillprevail. Regardless though, the events of the past year will only serve to strengthen certain trends that were already apparent before the currentcrisis. Security – national security, energy security, food security, cyber security (to name but a few) must now be considerably higher on governmentandcorporateagendasthaninthepastdecade.Russia’sexploitshaveproventhatenergydependenceonanerraticpartner can be disastrous. China is likely to remain a much more rational, measured player than Russia, but President Xi’s agenda is clearly expansionist. Securing security of supply We see a wave of spending being directed by governments and companies toward achieving greater security of supply: whether through investment in renewables; re-shoring or re-locating production facilities; supporting new methods of food production; or protecting industries that are strategic in nature such as semiconductors, software, or bio-technology. A polarisation of sorts between theWestandtheEastseemsinevitableintheseareas. Wearefocusedoncompaniesthatcanprosperinachallengingenvironmentanddosowithareasonablelevelofrisk.Manyoftheseare intheareasoutlinedabove,wherestructuralgrowthratesareclearlyhigherthantheywere. Equallythough,asthebearmarketmatures,ourresearchistakingustoseveralareasthathavebeenoutoffavourforsometime,suchas Japan. We will leave you with the startling revelation that, thanks to low wage inflation and a highly competitive currency, it is now cheaper to hireasoftwareengineerinTokyothanitisBangalore. Therearealwaysopportunitiessomewhereintheworld. Path of earnings and valuations around recessions Valuations have already moved significantly lower Earnings typically continue to fall but P/E stabilises after a recession starts Disclaimer: The above graph is used to explain the concept and is for illustration purpose only and should not used for development or implementation of an investmentstrategy. Pastperformancemayormaynotbesustainedinthefuture. Viewsandopinionscontainedhereinareforinformationpurposesonlyandshouldnotbeconstruedasinvestmentadvice/recommendationtoanyparty or solicitation to buy, sale or hold any security or to adopt any investment strategy. It does not warrant the completeness or accuracy of the information and disclaims all liabilities, losses and damages arising out of the use of this information. The recipient should exercise due caution and/ or seek professional advice before making any decision or entering into any financial obligation based on information, statement or opinion which is expressed herein. MutualFundInvestmentsaresubjecttomarketrisks,readallschemerelateddocumentscarefully