OP11:Role of indigenous soil biota in conservation and management of bgbd in agro- ecosystems
•
1 j'aime•365 vues

A presentation Dr. Kumar N.G.

Recommandé
Recommandé
Contenu connexe
Plus de CSM _BGBD biodiversity
Plus de CSM _BGBD biodiversity (20)
Dernier
Dernier (20)
OP11:Role of indigenous soil biota in conservation and management of bgbd in agro- ecosystems
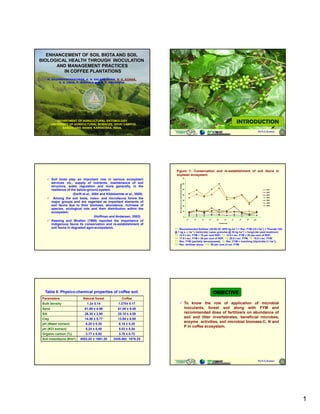
- 1. ENHANCEMENT OF SOIL BIOTA AND SOIL BIOLOGICAL HEALTH THROUGH INOCULATION AND MANAGEMENT PRACTICES IN COFFEE PLANTATIONS M. RAGHAVENDRAKUMAR, A. N. BALAKRISHNA, N. G. KUMAR, K. S. USHA, P. NIRMALA and K. T. PRASANNA DEPARTMENT OF AGRICULTURAL ENTOMOLOGY UNIVERSITY OF AGRICULTURAL SCIENCES, GKVK CAMPUS, INTRODUCTION BANGALORE-560065, KARNATAKA, INDIA. Dr.N.G.Kumar Dr.N.G.Kumar Figure 1: Conservation and re-establishment of soil fauna in soybean ecosystem. 70 Soil biota play an important role in various ecosystem services viz., supply of nutrients, maintenance of soil 60 Abundan of soil invertebrates (#/400g) structure, water regulation and more generally, in the resilience of the below-ground system. 50 2001 2002 (Swift et al., 2004 and Kibblewhite et al., 2008) 40 2003 Among the soil biota, meso- and microfauna forms the 30 2004 2005 major groups and are regarded as important elements of 2008 soil fauna due to their biomass, abundance, richness of nce 20 2009 species, ecological role and their distribution within the 10 ecosystem. (Hoffman and Andersen, 2003) 0 Keesing and Wratten (1998) reported the importance of 0 T1 T2 T3 T4 T5 T6 T7 T8 T9 T1 Treatm ents indigenous fauna its conservation and re-establishment of soil fauna in degraded agro-ecosystems. T1: Recommended fertilizer (25:60:25: NPK kg ha-1) + Rec. FYM (10 t ha-1) + Phorate 10G @ 1 kg a .i. ha-1+ herbicide( Lasso granules @ 20 kg ha-1) + fungicide seed treatment; T2: 12.5 t rec. FYM + 75 per cent RDF; T3: 15.0 t rec. FYM + 50 per cent of RDF; T4: 17.5 t rec. FYM + 25 per cent of RDF; T5: 20.0 t rec. FYM; T6: 10.0 t rec. FYM; T7: Rec. FYM (partially decomposed); T8: Rec. FYM + mulching (Glyricidia 2 t ha-1); T9: Rec. fertilizer alone; T10: 50 per cent of rec. FYM. Table 9. Physico-chemical properties of coffee soil. OBJECTIVE Parameters Natural forest Coffee Bulk density 1.2± 0.14 1.270± 0.17 To know the role of application of microbial Sand 61.69 ± 4.96 61.09 ± 9.48 inoculants, forest soil along with FYM and Silt 26.35 ± 2.90 25.10 ± 4.59 recommended dose of fertilizers on abundance of Clay 14.06 ± 5.77 13.88 ± 6.98 soil and litter invertebrates, beneficial microbes, enzyme activities soil microbial biomass C N and activities, biomass-C, pH (Water extract) 6.20 ± 0.30 6.16 ± 0.25 P in coffee ecosystem. pH (KCl extract) 5.24 ± 0.49 5.03 ± 0.54 Organic carbon (%) 3.77 ± 0.92 3.70 ± 0.73 Soil mesofauna (#/m2) 4052.02 ± 1881.20 3435.80± 1678.25 Dr.N.G.Kumar Dr.N.G.Kumar 1
- 2. MATERIAL AND METHODS Place : Koothi village, Somvarpet Taluk in Coorg district, Karnataka, India. Longitude: 7504711011E to 7507911411 E Latitude: 1204010311 N to 1204211911N Annual rainfall: 2000 to 3500 mm Treatments: 8 Replications:3 Design: RCBD Plot size: 96 m. sq Spacing: 2X2m Dr.N.G.Kumar Dr.N.G.Kumar Dr.N.G.Kumar TREATMENT DETAILS Microbial parameters: T1: Untreated Control 1. Population of mycorrhizal colonization T2: Farmyard manure @10t ha-1 (FYM) 2. Spore density T3: Recommended dose of fertilizer (RDF) (160 N: 120 P: 160K ha-1; 50% 3. Population of PSM (Psudomonas sp.) and Azotobacter chroococcum: was applied as a basal dose and remaining 50% fertilizers applied Standard dilution plating technique (Johnson & Curl, 1972) after 3 months) 4. Microbial Biomass-C, N and P: Carter method (1991) T4: FYM+RDF Bio-chemical parameters: T5: MIC+MFC 1. Dehydrogenase activity-Casida et al., (1964) T6: MIC+MFC+FYM MIC MFC FYM 2. Acid phosphatase activity, Alkaline phosphatase activity and Urease T7: RDF+MIC+MFC activity: Eivazi and Tabatabai (1977) T8: RDF+FYM+MIC+MFC Chemical parameters: 1. Available-P- Brays No. 1 method Note: MIC- Microbial consortium (Azotobacter chroococcum - 6.0x10⁶ CFU ml-1, 2. Available-N- Kjeldhal wet oxidation method P-solubilizing Pseudomonas sp. containing 8.0x10⁶ CFU ml-1 Soil and litter fauna extraction: Mcfadyen high gradient funnel method VAM fungi - 10,000 I.P/ plant). MFC- Mesofaunal consortia i.e., indigenous natural forest soil+ litter collected from 15cm depth applied @ 2 kg/plot (0.5 t ha-1). Dr.N.G.Kumar Dr.N.G.Kumar Table 1: Abundance of soil invertebrates in coffee ecosystem as influenced by different treatments. Abundance (#/400g) Treatments Other Other Total Cryptostigmatids Collembola Acari invertebrates fauna 9.33 6.33 5.06 1.40 23.13 T1= Control (3.07)d (2.24) (2.17)b (1.24)e (4.86)d 14.93 9.20 8.93 4.40 36.66 T2= FYM (3.87)ab (3.02) (3.07)ab (2.04)bc (6.08)b MONITORING OF THE INTRODUCED BENIFICIAL T3=RDF 9.86 (3.16)cd 7.06 (2.61) 6.26 (2.37)ab 2.00 (1.47)e 25.60 (5.11)cd MICROORGANISMS 13.26 5.93 8.33 4.59 34.40 T4=RDF+FYM AND SOIL FAUNA IN THE COFFEE RHIZOSPHERE SOIL-FAUNA (3 63)bc (3.63) (2.31) (2 31) (2 97)ab (2.97) (2 25)cd (2.25) (5 91)b (5.91) 12.13 7.40 9.20 4.66 30.59 T5=MIC+MFC (3.51)bcd (2.68) (3.11)ab (2.27)bcd (5.59)bc 15.73 11.00 12.16 5.13 45.06 T6=MIC+MFC+FYM (3.95)ab (3.31) (3.56)ab (2.37)ab (6.74)a 11.46 8.06 9.46 2.46 30.53 T7=RDF+MIC+MFC (3.31)cd (2.75) (3.15)ab (1.72)de (5.57)bc 17.13 11.53 18.66 7.99 48.03 T8=RDF+FYM+MIC+MFC (4.16)a (3.37) (4.40)a (2.91)a (6.97)a SEm± 0.17 0.19 0.21 0.17 0.18 CD@5% 0.48 NS 0.60 0.48 0.52 Dr.N.G.Kumar Dr.N.G.Kumar 2
- 3. Table 2: Abundance of litter invertebrates in coffee ecosystem as influenced by different treatments. Abundance (#/200g) Figure 2: Abundance of soil invertebrates in coffee ecosystem as influenced by Treatments Other Other Total fauna different treatments. Cryptostigmatids Acari Collembola invertebrates 60 10.66 10.06 7.33 2.79 26.75 T1= Control (3.34)c (3.24)b (2.79)d (1.81)c (5.21)e 50 16.80 14.20 12.32 7.06 48.72 ndance (#/400g) T2= FYM (4.15)ab (3.83)ab (3.58)bc (2.75)b (7.02)b 40 C r y p t o st i g m a t i d s 12.40 15.86 8.73 3.59 35.26 Ot h e r A c a r i T3=RDF 30 C ol l e m bo l a (3.59)c (4.04)a (3.03)cd (2.02)c (5.97)d Ot h e r i nv e r t e br a t e s 16.20 12.20 8.98 8.99 40.59 20 T ot a l f a un a T4=RDF+FYM Abun (4 08)b (4.08) (3 56)ab (3.56) (3 07)cd (3.07) (3 08)b (3.08) (6 41)cd (6.41) 10 13.40 11.13 9.20 6.33 48.12 T5=MIC+MFC (3.72)bc (3.41)ab (3.11)cd (2.61)b (6.97)bc 0 16.20 15.53 14.20 9.59 66.06 T6=MIC+MFC+FYM (4.08)b (4.01)a (3.83)ab (3.17)b (8.15)a FC FC F M M FC YM ol D FY FY tr +M +M =R +M +F on F+ 13.73 13.20 12.06 5.66 48.62 = T3 IC IC FC IC T2 T7=RDF+MIC+MFC C D +M M =R (3.77)bc (3.70)ab (3.54)bc (2.46)b (7.01)b =M = +M F+ T1 M T4 T5 IC D FY =R =M 21.13 15.60 17.53 13.46 75.26 F+ T7 T8=RDF+FYM+MIC+MFC T6 D (4.65)a (4.08)a (4.24)a (3.73)a (8.71)a =R T8 SEm± 0.19 0.25 0.21 0.23 0.20 Treatm ents CD@5% 0.54 0.70 0.61 0.65 0.59 Dr.N.G.Kumar Dr.N.G.Kumar Dr.N.G.Kumar Dr.N.G.Kumar Table 3. Changes in populations AM fungi spore density, Azotobacter and P- Figure 3: Abundance of litter invertebrates in coffee ecosystem as influenced by Solublizers as influenced by different treatments in coffee rhizosphere. different treatments. Azotobacter P- AM fungi population Solublizer 80 Treatments spore density (CFU x 103 (CFU x 103 (#/50g soil) 70 g-1soil) g-1 soil) 60 ance (#/200g) T1= Control 247ab 0.70g 0.97g 50 C r y p t o st i g m a t i d s ot he r A c a r i T2= FYM 261ab 1.06e 1.26f 40 C o l l e m b ol a Ot he r i n v e r t e b r a t e s T3=RDF 204de 0 87f 0.87 1 30f 1.30 Abunda 30 To t a l f a un a 20 T4=RDF+FYM 232cd 1.06e 1.63e 10 T5=MIC+MFC 242bc 1.76d 1.95d 0 T6=MIC+MFC+FYM 258ab 2.09c 2.48c FC M FC F YM FC M ol D FY FY 198e +M tr 2.31b 2.71b +M R T7=RDF+MIC+MFC +M +F on F+ = = IC IC FC T3 IC T2 C D +M M R M = +M F+ T1 = M = T8=RDF+FYM+MIC+MFC 263a 3.12a 3.11a T4 IC T5 D FY R M F+ = = T7 T6 D =R CD @ 5% 19.58 0.17 0.14 T8 Treatments Dr.N.G.Kumar Dr.N.G.Kumar Dr.N.G.Kumar Dr.N.G.Kumar Table 4. Simple correlation (r) between soil enzyme activities, microbial and chemical properties across all treatments. Avail.- Urease Avail.- Parameter SMBC SMBN SMBP APA ALPA P 2 O5 activity N MRC -0.036 -0.039 0.200 0.001 -0.106 -0.366* -0.271 -0.349 Azotobacter 0.737** 0.737** 0.812** 0.719** 0.740** 0.242 0.454** -0.364 Pseudomonas sp. 0.763** 0.764** 0.798** 0.793** 0.823** 0.344* 0.574** 0.532** MONITORING OF THE SOIL HEALTH DHA 0.433** 0.431** 0.782** 0.889** 0.859** 0.020 0.520** 0.472** SMBC 0.999** 0.546** 0.520** 0.612** 0.369** 0.418** 0.456** APA 0.881** 0.228 0.671** 0.611** ALPA 0.239 0.655** 0.621** Urease activity 0.887** MRC-Mycorrhizal Colonization; DHA-Dehydrogenase Activity; SMBC-Soil Microbial biomass-C; SMBN- Soil Microbial Biomass-N; SMBP-Soil Microbial Biomass -P; APA-Acid Phosphatase Activity; ALPA- Alkaline Phosphatase Activity. Dr.N.G.Kumar Dr.N.G.Kumar 3
- 4. Table 5. Soil microbial biomass-C, N, P (μg g-1 soil) and dehydrogenase activity (TPF Table 6. Effect of microbial inoculation, application of FYM and fertilizers on μg g-1 soil) as influenced by microbial inoculation with and without FYM and inorganic enzyme activities and available-N and P in coffee rhizosphere soil. fertilizers in coffee rhizosphere soil. Acid Alkaline Urease Treatments Soil microbial Soil Microbial Soil Microbial Dehydrogenase Available- biomass-C Biomass-N Biomass-P activity phosphatase phosphatase activity Available- P 2 O5 (μg g-1 soil) (μg g-1 soil) (μg g-1 soil) (TPF µgg-1 soil) Treatments activity activity (μg NH4- N (g/kg (μg PNP g -1 (μg PNP g -1 N g-1 (Kg ha-1) Control 954g 111f 23e 261f soil) soil) soil) soil/2 hr) FYM 1576f 182e 40c 805d Control 29f 22g 0.163de 106d 255e RDF 1691ef 197de 20e 478e FYM 40d 34e 0.156cde 124c 297d RDF+FYM 1889e 219d 38cd 885c RDF 37e 32f 0 192a 0.192 128c 328c MIC+MFC 2114d 246c 35d 836d RDF+FYM 47c 39c 0.147ef 138b 404b MIC+MFC+FYM 2450c 285b 43c 834d MIC+MFC 39de 37d 0.145f 109d 260e RDF+MIC+MFC 2700b 315b 53b 940b MIC+MFC+FYM 45c 41b 0.180ab 136b 312cd RDF+MIC+MFC 50b 47a 0.169bcd 130b 332c RDF+FYM+MIC+MFC 3310a 385a 59a 989a RDF+FYM+MIC+MFC 53a 43b 0.184ab 154a 434a CD @ 5% 198.22 23.11 4.51 37.05 FYM-farmyard manure; RDF-recommended dose of fertilizer; MIC- microbial consortium; CD @ 5% 2.15 2.09 0.019 9.44 21.31 MFC-meso-faunal consortium : Means with the same superscript do not differ from each other. FYM-farmyard manure; RDF-recommended dose of fertilizer; MIC-microbial consortium; MFC-meso- faunal consortium : Means with the same superscript do not differ from each other. Dr.N.G.Kumar Dr.N.G.Kumar Dr.N.G.Kumar Dr.N.G.Kumar Table 8. Yield of coffee beans as influenced by microbial Table 7. Changes in Total-N (%), P, K (g/kg soil) and organic-C (%) as inoculation with and without FYM and inorganic fertilizers. influenced by different treatments in coffee rhizosphere. Treatments (Q / ha) Total- N Total-P Total-K Organic-C Treatments (%) (g Kg-1 soil) (g Kg-1 soil) (%) Control 10.76b T1= Control 0.116c 3.60f 7.35f 3.79 FYM 12.58a T2= FYM 0.136b 5.28c 9.10c 4.16 RDF 13.02a T3=RDF 0.131b 4.04e 7.88e 4.26 RDF+FYM 12.67a T4=RDF+FYM 0.137b 4.89d 9.20c 4.06 MIC+MFC 12 28a 12.28 T5=MIC+MFC 0.130b 4.19cd 8.64d 4.52 MIC+MFC+FYM 12.85a T6=MIC+MFC+FYM 0.133b 4.90d 9.96b 3.93 RDF+MIC+MFC 13.28a T7=RDF+MIC+MFC 0.134b 5.80b 10.39a 4.34 RDF+FYM+MIC+MFC 13.54a T8=RDF+FYM+MIC+MFC 0.146a 6.28a 10.40a 4.27 FYM- Farm Yard Manure; RDF- Recommended Dose of Fertilizer; MIC- Microbial Consortium; MFC- Meso-faunal Consortium; Means with the same superscript do not differ from each other. Dr.N.G.Kumar Dr.N.G.Kumar Dr.N.G.Kumar Dr.N.G.Kumar CONCLUSION Soil management practices such as application of organic manures and inorganic fertilizers and inoculation of soil biota (soil mesofuana and beneficial microorganisms) in rhizosphere of plants help in increasing soil and litter invertebrates and microbial biomass in soil. The increased microbial biomass in soil increases the soil enzyme activities and brings about mineralization of organic forms of nutrients to inorganic forms making them available to plant uptake. The increased microbial biomass also increases soil N and P leading to increased soil fertility. This suggests that, soil biological health is important in maintaining soil fertility. Application of RDF+FYM+MIC+MFC also acts as a favoured habitat for soil mesofauna throughout the experiment period compared to rest of the treatments. Dr.N.G.Kumar Dr.N.G.Kumar Dr.N.G.Kumar 4