Earthworm biostimulation boosts degraded land fertility
•
0 j'aime•254 vues

A presentation by Prof. Tondoh J.E.

Recommandé
Recommandé
Contenu connexe
Plus de CSM _BGBD biodiversity
Plus de CSM _BGBD biodiversity (20)
Earthworm biostimulation boosts degraded land fertility
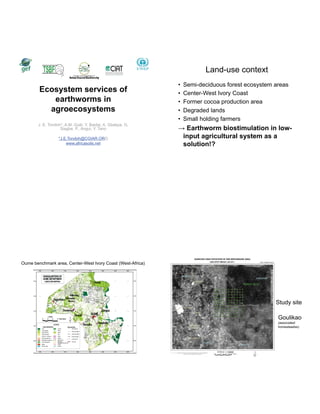
- 1. Land-use context • Semi-deciduous forest ecosystem areas Ecosystem services of • Center-West Ivory Coast earthworms in • Former cocoa production area agroecosystems • Degraded lands • Small holding farmers J. E. Tondoh*, A.M. Guéi, Y. Baidai, A. Gbakpa, G. Siagbe, P., Angui, Y. Tano Earthworm biostimulation in low- *J.E.Tondoh@CGIAR.ORG input agricultural system as a www.africasoils.net solution!? Oume benchmark area, Center-West Ivory Coast (West-Africa) Study site Goulikao (associated homesteadss)
- 2. Functional diversity • Epi-endogeic worm: Hyperiodrilus africanus (Eudrilidae) • Endogeic: Millsonia omodeoi (Acanthodrilidae) Hyperiodrilus africanus Dichogaster terrae-nigrae • Anecic?: Dichogaster terrae-nigrae (Acanthodrilidae) Demographic traits and role in the system are well known (Lavelle, 1981; Tondoh, 1998; Tondoh and Lavelle, 2005; Tondoh et al. 2007) Millsonia omodeoi Soil compaction Soil decompaction + REGULATION OF SOIL STRUCTURE
- 3. Rational and hypotheses Demonstration plots • Spain et al. 1992 (Pot experiments) • 10 farmers = 10 plots (3mx3m) • Gilot et al. 1996 (Field enclosures) • Maize • Derouard et al. 1996 (Pot experiments) • Maize+H. africanus Farmer fields using earthworm as • Maize + M. omodeoi biofertilizers • Maize+H. africanus+M. omodeoi Testing the Integrated Soil Fertility • Maize+Urea+SPP Management (ISFM) theory In collaboration with farmers Plots Farmers Altitude Latitude Nord Longitude Ouest (m) (° min s) (° min s) Pot experiments: the ISFM theory • T0 Maize 1 Komenan Kacou 175.7 6°31’48.7’’ 5°32’53.2’’ • T1 Maize+coffee wastes 2 Djabla H. Sylvanus 170 6°31’23.9’’ 5°32’51.6’’ • T2 Maize+Urea 3 Guény A. Christophe 167.2 6°31’17.7’’ 5°32’44.5’’ • T3 Maize+SPP 4 Guény A. Christophe 177.5 6°30’98.3’’ 5°32’19.1’’ • T4 Maize+Urea+SPP 5 N’Guessan Emile 175.3 6°30’91.4’’ 5°32’15.5’’ • T5 Maize+M omodeoi+H africanus+Coffee wastes 6 Komenan Béli 179.6 6°30’94.8’’ 5°32’10.9’’ • T6 Maize+M omodeoi+H africanus+Coffee wastes+Urea 7 Tizié Mongoua 177.9 6°30’81.8’’ 5°31’87.4’’ • T7 Maize+M omodeoi+H africanus+Coffee wastes+SPP 8 Zéli André 183 6°30’90.7’’ 5°31’80.3’’ • T8 Maize+M omodeoi+H africanus+Coffee wastes+Urea 9 Gohan Golé 182.3 6°30’69.9’’ 5°32’12.4’’ +SPP 10 Yao K. Evrard 181.7 6°30’58.5’’ 5°31’71.0’’
- 4. Pot experiments: Impact of Earthworm collection earthworms on ecosystem services • T0 Control without earthworms • T1 M. omodeoi • T2 D. terrae nigrae • T3 H. africanus • T4 M. omodeoi + D.terrae-nigrae + H.africanus • T5 M. omodeoi + H. africanus • T6 M. omodeoi + D.terrae-nigrae • T7 D. terrae-nigrae + H.africanus Demonstration plots Adult and subadult worms
- 5. Pot experiments: the ISFM theory Maize Maize Maize + Maize + + M. Omodeoi Maize + M. omodeoi H. africanus + Urea+SPP H. africanus 3m Bulk density Penetrometry NUE PUE WUE Maize yield Root biomass
- 6. Pot experiments: carbon sequestration and soil structure regulation T5 T1 Mo Mo+Ha T2 T6 T3 5m T7 Da Mo+Dtn 2m T8 T4 Ha Ha+Dtn Mo+Da+Ha T 5 cm Soil level in the bucket Should match that of the land Soil Holes at the bottom Stone beds Inoculation of worms Covering the bucket witn nylon mesh to avoid predation and escape
- 7. Water infiltration rate C,N density Resistance to penetration Aggregate size distribution Demonstration plots Demonstration plots Grain biomass (t ha-1) 6.00 Cobs biomass (t ha-1) 24.0 No significant effect +26.9% increase 4.50 +21.5% Maize+Mo 18.0 +13.9% Maize+Ha 3.00 12.0 +21.2% Maize+Mo+Ha 1.50 6.0 0.0 0.00
- 8. Demonstration plots Pot experiments: the ISFM theory Root biomass (t ha-1) 6.00 No significant effect 4.50 3.00 1.50 0.00 Pot experiments Pot experiments Cob biomass (t ha-1) Height (cm) 15 250 Significant effect 12 200 T5 +240.4% M MCw 9 150 MU T8 +95.3% MSPP 6 MUSPP 100 T7 +107% MMoHaCw 3 MMoHaUCw 50 MMoHaSPPCW T4 +119.2% MMoHaUSPPCw 0 0 T0 T1 T2 T3 T4 T5 T6 T7 T8 30DAP 50DAP 75DAP T5: Maize+Ma+Ha+Cw T6: T5+Urea T7:T5+SPP T8: T5+Urea+SPP
- 9. Pot experiments Pot experiments Grain biomass (t ha-1) Root biomass (t ha-1) 12 4 9 T8 +96.3% 3 T5 +266.8% 6 2 T3 +58.8% 3 1 T4 +111.04% 0 0 T0 T1 T2 T3 T4 T5 T6 T7 T8 T0 T1 T2 T3 T4 T5 T6 T7 T8 T5: Maize+Ma+Ha+Cw T6: T5+Urea T7:T5+SPP T8: T5+Urea+SPP T5: Maize+Ma+Ha+Cw T6: T5+Urea T7:T5+SPP T8: T5+Urea+SPP Pot experiments Pot experiments 200 Fertilizer Use Efficiency Water Use Efficiency (Kg kg-1) b (Kg mm-1) 160 0.06 b 120 0.05 NUE a 0.04 80 a PUE 0.03 a a a WUE+N 40 WUE+P 0.02 0 a 0.01 Maize-Ew Maize+Ew 0 Maize-Ew Maize+Ew
- 10. Experiment pots Pot experiments Resistance to Aggregate size penotrometrie (Kpa) distribution 800 100% 700 80% 600 >2000 m 500 60% 1000 - 2000 m 500 - 1000 m 400 0-10 cm 200 - 500 m 40% 10-20 cm 100 - 200 m 300 50 - 100 m 200 20% 0 - 50 m 100 0% 0 C Mo Dt Ha MoHa MoDt HaDt MoHaDt C Mo Dt Ha MoHa MoDt HaDt MoHaDt Pot experiments Pot experiments 8 Infiltration rate (cm mn-1) Infiltration rate (cm min-1) 6 6 Te 5 Mo Dt 4 4 Ha MoHa 3 MoDt 2 2 HaDt MoHaDt 1 0 0 Te Mo Dt Ha MoHa MoDt HaDt MoHaDt 5 10 15 20 30 40 50 60 75
- 11. Pot experiments Take-home messages • Earthworms can be used as biofertilizers C & N stocks (t ha-1) to improve maize production 1.50 1.45 • The impact is enhanced by earthworms 1.40 with contrasted functional attributes 1.35 1.30 0-10 cm • PUE, WUE, water infiltration rate and soil 1.25 10-20 cm structure regulation are likely to explain 1.20 the posifive impact of earthworms on plant 1.15 1.10 growth and production Te Mo Dt Ha MoHa MoDt HaDt MoHaDt Take-home messages • Earthworms as the biological component in the ISFM theory THANK YOU!!! THANK YOU!!