BP Energy Outlook 2035 - USA country insights 2014
•
0 j'aime•1,108 vues

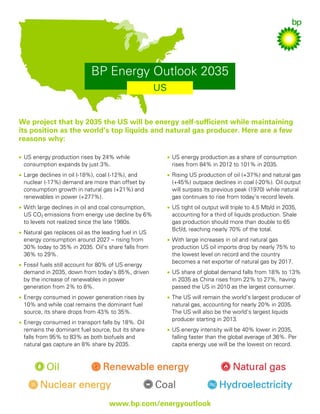
Regional insights for Africa from BP's Energy Outlook 2035 published in 2014. We project that by 2035 the US will be energy self-sufficient while maintaining its position as the world’s top liquids and natural gas producer.

Recommandé
Contenu connexe
Tendances
Tendances (19)
Similaire à BP Energy Outlook 2035 - USA country insights 2014
Similaire à BP Energy Outlook 2035 - USA country insights 2014 (20)
Plus de bp
Plus de bp (20)
BP Energy Outlook 2035 - USA country insights 2014
- 1. BP Energy Outlook 2035 US We project that by 2035 the US will be energy self-sufficient while maintaining its position as the world’s top liquids and natural gas producer. Here are a few reasons why: • US energy production rises by 24% while consumption expands by just 3%. • US energy production as a share of consumption rises from 84% in 2012 to 101% in 2035. • Large declines in oil (-18%), coal (-12%), and nuclear (-17%) demand are more than offset by consumption growth in natural gas (+21%) and renewables in power (+277%). • Rising US production of oil (+37%) and natural gas (+45%) outpace declines in coal (-20%). Oil output will surpass its previous peak (1970) while natural gas continues to rise from today’s record levels. • With large declines in oil and coal consumption, US CO2 emissions from energy use decline by 6% to levels not realized since the late 1980s. • US tight oil output will triple to 4.5 Mb/d in 2035, accounting for a third of liquids production. Shale gas production should more than double to 65 Bcf/d, reaching nearly 70% of the total. • Natural gas replaces oil as the leading fuel in US energy consumption around 2027 – rising from 30% today to 35% in 2035. Oil’s share falls from 36% to 29%. • Fossil fuels still account for 80% of US energy demand in 2035, down from today’s 85%, driven by the increase of renewables in power generation from 2% to 8%. • Energy consumed in power generation rises by 10% and while coal remains the dominant fuel source, its share drops from 43% to 35%. • Energy consumed in transport falls by 18%. Oil remains the dominant fuel source, but its share falls from 95% to 83% as both biofuels and natural gas capture an 8% share by 2035. • With large increases in oil and natural gas production US oil imports drop by nearly 75% to the lowest level on record and the country becomes a net exporter of natural gas by 2017. • US share of global demand falls from 18% to 13% in 2035 as China rises from 22% to 27%, having passed the US in 2010 as the largest consumer. • The US will remain the world’s largest producer of natural gas, accounting for nearly 20% in 2035. The US will also be the world’s largest liquids producer starting in 2013. • US energy intensity will be 40% lower in 2035, falling faster than the global average of 36%. Per capita energy use will be the lowest on record. www.bp.com/energyoutlook