2. 4.5. Performance of ML models . . . . . . . . . . . . . . . . . . . . . . . . . . . . . . . . . . . . . . . . . . . . . . . . . . . . . . . . . . . . . . . . . . . . . . . . . . . . . . . . . . . . . . . . . 14
4.5.1. ML models and conventional methods . . . . . . . . . . . . . . . . . . . . . . . . . . . . . . . . . . . . . . . . . . . . . . . . . . . . . . . . . . . . . . . . . . . . . . . . 14
4.5.2. PCMs and conventional methods. . . . . . . . . . . . . . . . . . . . . . . . . . . . . . . . . . . . . . . . . . . . . . . . . . . . . . . . . . . . . . . . . . . . . . . . . . . . . 15
4.5.3. ML methods, indoor thermal conditions and energy consumption. . . . . . . . . . . . . . . . . . . . . . . . . . . . . . . . . . . . . . . . . . . . . . . . . . 15
4.5.4. ML performance and physiological parameters . . . . . . . . . . . . . . . . . . . . . . . . . . . . . . . . . . . . . . . . . . . . . . . . . . . . . . . . . . . . . . . . . 15
4.6. Challenges of ML models . . . . . . . . . . . . . . . . . . . . . . . . . . . . . . . . . . . . . . . . . . . . . . . . . . . . . . . . . . . . . . . . . . . . . . . . . . . . . . . . . . . . . . . . . . 16
5. Conclusion . . . . . . . . . . . . . . . . . . . . . . . . . . . . . . . . . . . . . . . . . . . . . . . . . . . . . . . . . . . . . . . . . . . . . . . . . . . . . . . . . . . . . . . . . . . . . . . . . . . . . . . . . . . 17
6. Future studies. . . . . . . . . . . . . . . . . . . . . . . . . . . . . . . . . . . . . . . . . . . . . . . . . . . . . . . . . . . . . . . . . . . . . . . . . . . . . . . . . . . . . . . . . . . . . . . . . . . . . . . . . 18
Declaration of Competing Interest . . . . . . . . . . . . . . . . . . . . . . . . . . . . . . . . . . . . . . . . . . . . . . . . . . . . . . . . . . . . . . . . . . . . . . . . . . . . . . . . . . . . . . . . 18
References . . . . . . . . . . . . . . . . . . . . . . . . . . . . . . . . . . . . . . . . . . . . . . . . . . . . . . . . . . . . . . . . . . . . . . . . . . . . . . . . . . . . . . . . . . . . . . . . . . . . . . . . . . . 18
1. Introduction
1.1. Research background
People spend more than 80% of their time in indoor spaces [1],
which highlights the importance of Indoor Environmental Quality
(IEQ), especially during the COVID-19 lockdown and longer indoor
stays. Thermal comfort as one of the essential elements of IEQ is
defined as ‘‘the condition of mind expressing satisfaction with
the thermal environment” [2]. To investigate thermal comfort,
the two main approaches of Predicted Mean Vote-Percentage of
Dissatisfied (PMV-PPD) and the adaptive approach have been
implemented for a long time.
The Fanger’s PMV-PPD model, which stems from a set of
experiments in controlled climate chambers is based on thermal
equilibrium equations between human body and its environment.
According to Fanger, the human thermal sensation can be deter-
mined by four environmental factors (air temperature, relative
humidity, mean radiant temperature and air velocity) plus two
personal ones (cloth insulation and metabolic rate) [3]. This model
has been used by many researchers during the last fifty years and
has been reviewed in many studies [4–6]. Based on the literature,
several studies [7–12] have recognized the validity of PMV-PPD
model, whether implicitly or explicitly. However, many studies
[13–19] have mentioned the poor prediction power of this model.
Cheung et al. [17] analyzed the accuracy of the PMV–PPD model
using ASHRAE Global Thermal Comfort Database II. They reported
that the accuracy of this model in predicting observed thermal sen-
sations was only 34%. The PMV-PPD model is proven to be reliable
in uniform controlled steady conditions. However, real building
conditions are usually dynamic and non-uniform [18]. Therefore,
a major problem with PMV-PPD model is its lack of accurate pre-
diction in different contexts, especially in field studies and under
uncontrolled conditions. It has been found that the tolerance band
of PMV index can be higher than 1.0 unit for people exposed to the
same environment [19]. Moreover, the PMV index applies to
Nomenclature
List of abbreviations
Term Explanation
Ab AdaBoost
AC Air-conditioned
AE Average Error
AI Artificial Intelligence
ANN Artificial Neural Network
AUC (ROC) Area Under the Receiver Operating Characteristics
BM Bayesian Method
BNN Bayesian Neural Network
CNN Convolutional Neural Networks
DT Decision Tree
DL Deep Learning
ELM Extreme Learning Machine
ENL Ensemble Learning
ET* Effective Temperature
FLS Fuzzy Logic System
FOM Firefly Optimization Method
GA Gaussian Method
GNB Gaussian Naïve Bayes
GP Genetic Programming
HVAC Heating, Ventilation, and Air Conditioning
IAQ Indoor Air Quality
IEQ Indoor Environment Quality
IoT Internet of Things
KNN K-Nearest Neighbors
LDA Linear Discriminant Analysis
LoR Logistic Regression
LVQ Learning Vector Quantization
MAE Mean Absolute Error
Term Explanation
ML Machine Learning
MPC Model Predictive Control
MRT Mean Radiant Temperature
MSE Mean Squared Error
NB Naive Bayes
NV Naturally Ventilated
PCM Personal Comfort Model
PCS Personal Comfort System
PET Physiological Equivalent Temperature
PMV Predicted Mean Vote
PPD Predicted Percentage Dissatisfied
PSO Particle Swarm Optimization
r Correlation Coefficient
R Regression Method
R2
Coefficient of Determination
RF Random Forest
RL Reinforcement Learning
RMSE Root Mean Square Error
RNN Recurrent Neural Network
ROC Receiver Operating Characteristics
SET Standard Effective Temperature
SSE Sum of Squares for Residuals
SVM Support Vector Machine
TBM Tree-based Method
TCV Thermal Comfort Vote
TPV Thermal Preference Vote
TSV Thermal Sensation Vote
Z. Qavidel Fard, Zahra Sadat Zomorodian and Sepideh Sadat Korsavi Energy & Buildings 256 (2022) 111771
2
3. healthy adults and not to children, older or disabled individuals.
Furthermore, measuring/calculating several factors, such as mean
radiant temperature, cloth insulation and metabolic rate is diffi-
cult, which increases the complexity of the model.
On the other hand, thermal adaptive method relates occupants’
thermal sensations to outdoor air temperature by a linear regres-
sion equation. Thus, the main adaptive models are ‘‘black-boxes”
based on a statistical analysis of field data [20]. The adaptive
method originates from this assumption that a human being is
active in his/her thermal environment and plays a role in adjusting
the environmental conditions. It accounts for physiological, behav-
ioral and psychological adaptation, although only at an aggregation
level [21]. Due to adopting this method in different locations and
under various conditions, wider acceptable indoor temperature
ranges based on adaptive models have been included in interna-
tional and national standards and this approach towards thermal
comfort is regarded as a significant contributor in achieving low
energy building design and operation [22].
However reducing all the effective parameters to only one
parameter (outdoor air temperature), may cause over-
simplification and neglecting the complexities of human thermal
perception. Moreover, the predictive equation is derived from data,
meaning that an equation for data in one context might not work
in another [23].
Furthermore, both models are designed for predicting the aver-
age thermal state of a group and do not work for the assessment of
individuals’ thermal conditions. Moreover, input parameters for
both models are fixed, which makes it difficult to analyze the
effects of other potential parameters on thermal perception.
During the last decade, with the development of computer
science and especially Artificial Intelligence (AI), this knowledge
has been adopted in different fields, such as buildings and thermal
comfort. ‘‘AI” can subtly be defined as the ability of computers to
develop intelligent qualities, similar to those of humans, and con-
sequently perform tasks that could previously be performed by
humans alone [24]. Machine Learning (ML), which is a subset of
AI can solve non-linear complex problems with big dimensions.
In comparison with regression methods, ML has a much stronger
performance in determining non-linear non-standard relations
between independent and dependent variables [25].
ML thermal comfort models can find the relationships between
occupants’ thermal feedback and the affecting variables by them-
selves and without explicit knowledge of the physical effects of
each factor (self-learning ability). Besides, these models can correct
or adjust such comfort relationships by themselves, when applying
to different contexts (self-correction ability) [26]. In comparison
with PMV and adaptive models, ML models make it possible for
the analyst to test different combinations of inputs and find the
most effective parameter(s). Furthermore, ML can be adopted for
both average-based models and Personal Comfort Models (PCMs).
1.2. Literature review
Due to the advantages of this new approach, the increasing
application of ML in thermal comfort and building energy effi-
ciency studies does not seem to be surprising. Aiming at addressing
the current gaps involved in applying machine learning models to
building energy efficiency, the review paper by Wang, et al. [27]
identified several issues, such as non-uniform and divergent
research objects, diverse ML algorithms, limited data collection
techniques and resources, data structure non uniformity,
technology-oriented research paradigms, inadequate model adapt-
ability, and lack of user confidence [27]. Similarly, reviewing the
latest ML applications in thermal comfort studies can assist the
researchers to identify the main gaps and potential future study
areas. Reviewing the study contexts and ML models clarifies which
contexts and models require more investigation. For example, Luo
et al. [28] compared the performance of different ML algorithms
and suggested that factors such as building type, building opera-
tion mode, and climate conditions were not among the top factors.
However, these factors can affect occupants’ thermal perception
and require more investigation. Another related area that can be
studied is the application of ML models in Personal Comfort Mod-
els (PCMs) and Personal Comfort Systems (PCSs). For example,
Shan et al. [29] mentioned that an individual has its unique ther-
moregulation mode and thermal stress response, so it is necessary
to establish PCMs for independent analyzes and predictions. Ngar-
ambe et al. [24] reviewed 37 papers between 2005 and 2019 to
investigate AI-based thermal comfort predictive models, the
energy implications of AI-based thermal comfort controls, ML
methods and algorithms for thermal comfort modelling, PMV mod-
els and PCMs. Their conclusion suggested that tuning, model opti-
mization techniques, deployment of comfort models in building
control systems and quantifying the benefits of AI-based comfort
control systems should be further studied [24]. However, they
mostly focused on air temperature and relative humidity and over-
looked other parameters. Previous review papers, such as [24,30–
33] (Table 1) suggest that ML methods were mostly focused on
introducing algorithms and the overall process without emphasiz-
ing essential issues, such as determination of sample size, time
scale, target parameter, validation methods and performance met-
rics. Thus, there still is a need for a more comprehensive and
detailed review of ML applications in thermal comfort studies.
1.3. Aim and objectives
This paper aims to highlight the application of ML to thermal
comfort studies and identify its related methods, performance
and challenges by reviewing the most recent research studies in
this area. More specifically, the objectives of the study are:
Introducing the main applications of ML models in thermal
comfort studies.
Investigating ML practices in thermal comfort studies with a
focus on sample sizes, tools, algorithms, generalization test
methods and performance metrics.
Specifying the main input and output parameters of ML models.
Examining the performance of ML models in comparison with
conventional models and their impact on the indoor thermal
environment.
Highlighting the main challenges of ML models in thermal com-
fort studies to provide an agenda for future studies.
2. Selection of studies
Reviewed studies were selected from 2016 to 2021 for two
main reasons; first, this study aims to highlight the most recent
applications, methods, tools and findings in this area; second, the
number of studies addressing thermal comfort using ML models
has increased exponentially since 2016 [31]. The process of select-
ing papers is illustrated in Fig. 1. Firstly, two sets of keywords were
provided, for thermal comfort and machine learning. Secondly, 15
combinations of thermal comfort and machine learning related
terms (such as thermal comfort/machine learning, thermal com-
fort/artificial intelligence, thermal comfort/data-driven, Heating,
Ventilation, and Air Conditioning (HVAC) control/machine learn-
ing, HVAC control/artificial intelligence, and HVAC control/data-
driven) were searched on ‘‘Google Scholar”, ‘‘Science Direct”,
‘‘Research Gate”, and ‘‘Scopus” online databases. Using the sorted
by relevance mode, 246 of the most relevant search results pub-
lished from 2016 to 2021 were listed. Thirdly, titles, keywords,
and abstracts of the listed papers were reviewed. Here, 137 papers
Z. Qavidel Fard, Zahra Sadat Zomorodian and Sepideh Sadat Korsavi Energy Buildings 256 (2022) 111771
3
4. Table 1
Summary of recent review papers.
Paper Year Number
of
Reviewed
Papers
Years of
Reviewed
Papers
Objective(s) Recommendations
[24] 2020 37 2005–
2019
- Focusing on thermal comfort predictive models
- and their deployment in building control systems;
- Discussing research gaps and potential future research
directions.
Gaps and future research directions:
- Lack of AI-based modeling in residential buildings and
non-waking occupants;
- Lack of sufficient amount of data in datasets;
- High dependency on ‘‘supervised learning” methods;
- Lack of generalization, transparency, and deterministic
conclusions;
- Tuning, parameters, and model optimization techniques;
- Deployment of comfort models in building control
systems;
- Quantifying the benefits of AI-based comfort control
systems.
[30] 2021 45 2005–
2019
- Reviewing the analytical models and identifying the cor-
responding input variables;
- Discussing application in models based on Artificial Neu-
ral Network (ANN) and Reinforcement Learning (RL).
Research gaps:
- Lack of spatial configuration of buildings, such as room
dimension, ceiling height, and total surface area to
adjust control system or to incorporate into modeling;
- Overlooking the linked effects of air temperature, air
velocity, surface temperature, and mean radiant
temperature;
- Not investigating the prevalence of indoor air pollutants.
[31] 2020 105 2010–
2020
- Summarizing recent occupant-centric thermal comfort
practices following a framework with three themes:
sensing, predicting, and controlling.
Challenges of occupant centric thermal comfort solutions:
- Sensing technology;
- Predicting model;
- Controlling strategy.
[32] 2020 NA NA - Describing the fundamentals of an intelligent entity (ra-
tional agent) and components of its problem-solving pro-
cess (i.e., search algorithms, logic inference, and machine
learning);
- Discussing the current application of intelligent personal
thermal comfort systems in buildings;
- Describing future directions for enabling the application
of fully automated systems to provide comfort more
efficiently.
Future directions:
- A need for improvements in intelligent system methods
to autonomously address the dynamic personal thermal
comfort preferences of occupants in buildings.
- A need for more complex control algorithms, so the
intelligent system is better equipped to manage the
equally complex data inputs from all personal thermal
comfort profiles in the occupied space and deliver a suit-
able thermal environment.
[33] 2019 33 1997–
2018
- Providing a comprehensive review of RL being imple-
mented for occupant comfort control;
- Analyzing the application of RL for comfort control in
multi-agent environments;
- Highlighting the potential of RL as a sustainable forerun-
ner for occupant centric building operation in the evolv-
ing smart city.
Major challenges and Research gaps:
- Lack of studies including comfort factors such as indoor
air quality and lighting in comparison to thermal
comfort;
- Lack of incorporating occupancy patterns and/or occu-
pant feedback into the control loop which are crucial
for occupant-centric building operation;
Fig. 1. The process of selecting studies.
Z. Qavidel Fard, Zahra Sadat Zomorodian and Sepideh Sadat Korsavi Energy Buildings 256 (2022) 111771
4
5. that had addressed only thermal comfort or machine learning
issues were eliminated, leaving a total of 109 papers. Finally,
papers that met all the below criteria were included in the review:
Being written in English;
Being directly related to both thermal comfort and machine
learning/artifical intelligence;
Having clarified the main comfort analysis approach, whether
group-based models or PCMs.
Having clarified the source of data, whether it is existing data
(such as ASHRAE databases) or specifically measured (field/cli-
mate chamber) or generated data (from simulation);
Having provided a clear description of the methodology, in
terms of data collection, input and target parameters, and algo-
rithm(s);
Being published by building physics-related journals (such as
Building and Environment, Energy Buildings, Renewable and
Sustainable Energy Reviews) or conferences (such as IEEE Inter-
national Conference on Automation Science and Engineering,
IEEE International Conference on Smart Grid and Smart Cities,
and Windsor Conference).
As a result, a total number of 60 papers published from 2016 to
2021 were selected for the review to conduct an in-depth study.
Fig. 2 illustrates a word cloud of titles and keywords of the selected
papers.
3. An overview of reviewed studies
Reviewed studies are investigated in terms of their context and
data to provide a more comprehensive overview of their frequency
and distribution.
Fig. 3 illustrates the number of reviewed studies in each year
which shows a generally increasing trend. The reason for the drop
in 2021 can be related to the time of the last online search on
August 5th 2021.
3.1. Study context
The reviewed papers were classified based on their investigated
seasons, regions, building types and operation modes. Since ASH-
RAE datasets were collected from various regions worldwide and
during various seasons, papers using these databases covered
various contexts, except reference [34] for the Mediterranean and
subtropical climate, reference [35] in Singapore and reference
[36] in North America.
Seven papers [18,25,37,38,39,40,41] studied all seasons and one
paper [42] mentioned that a period of 10 months was investigated.
On the other hand, some studies [30,43,44,45,39,46,47,48,49,50]
did not clarify their studied seasons. Kim et al. [51] presented an
overall framework for occupant-centric environmental control that
could explain the reason for not mentioning the season(s). Sajja-
dian et al. [52] also introduced a framework and did not mention
their studied seasons. Fig. 4 shows the frequencies of investigated
seasons among the reviewed papers. It can be observed that sum-
mer or cooling season was the most studied time of year. Future
studies are recommended to focus on other seasons, especially
winter, which could require noticeable heating demands in cold
climates.
Fig. 5 illustrates the distribution of the investigated locations,
based on ASHRAE global database I and II [53], ASHRAE RP-884
[54] and other reviewed papers. After excluding studies that did
not define their investigated regions or used ASHRAE databases,
it was observed that far eastern areas (mostly Singapore and China)
accounted for around 51% of the studied regions. Therefore, the
reason for summer being the most studied season is the fact that
most of the studies were conducted in hot and humid climate
zones with high cooling demands. The next frequently studied
regions were European countries (mostly Italy), followed by North
America/USA, which accounted for around 25% and 20% of the
investigated regions, respectively. On the other hand, although
regions, such as Russia, Southern America, Africa and the Middle
East can be exposed to severe climatic conditions, Fig. 5 shows a
lack of studies on these areas, which is recommended to be
addressed in future studies.
Fig. 2. A word cloud (with a maximum of 200 words) of titles and keywords of the reviewed papers.
Fig. 3. The distribution of the selected papers from 2016 to 2021.
Z. Qavidel Fard, Zahra Sadat Zomorodian and Sepideh Sadat Korsavi Energy Buildings 256 (2022) 111771
5
6. To identify the most frequent building type, the study has
eliminated studies on outdoor areas [55–58], one paper that studied
all working and living spaces through the day [40], and papers
that used ASHRAE databases with various building types
[26,28,59,60,34,61,62,63,35]. Results suggest that offices were the
most investigated buildings, accounting for about 54% of the studied
cases, followed by residentials (including dormitories, care-homes,
houses and apartments), educational spaces, and lecture theatres,
which accounted for around 27%, 14%, and 4% of the cases, respec-
tively. Since thermal conditions can affect learning abilities and stu-
dents’ performance, further studies are recommended to focus on
educational contexts. Another building type that can be focused on
for future studies is hospitals and medical centres. Providing ther-
mal comfort in hospitals can be a real challenge due to the variety
of activities and different thermal sensations of patients, personnel
and visitors. Moreover, the thermal quality of open public spaces
can influence residents’ outdoor life [57], therefore, another poten-
tial area for future studies is outdoor thermal comfort.
As illustrated in Fig. 6, the most investigated building operation
mode was HVAC, with around 66% of the specified cases. In some
cases [51,37,64,41,42,65] HVAC systems came along with control
options such as desk fans, thermostats or other PCSs, which
allowed occupants to adjust their environment and improve their
thermal conditions. In some other cases (such as [66,67]), the main
heating/cooling/ventilation strategy was using PCSs. This review
suggests that naturally ventilated buildings need further investi-
gating to provide adequate fresh air through well-designed open-
ings, especially with the outburst of COVID-19.
3.2. Data collection
There are some publicly accessible thermal comfort datasets,
such as ASHRAE global thermal comfort database II, the scales pro-
ject, Langevin Longitudinal dataset, ERA5-Heat, and Winter Ther-
mal Comfort and health for the elderly that can be used, which
contain 107584, 8226, 678621, not mentioned, and 424 records,
respectively [68]. Therefore, some studies used existing data from
ASHRAE databases [26,28,59,60,34,61,62,63,35] while others col-
lected data for their specific studies. Another noticeable point is
the use of new technologies and online methods for data collection,
which was adopted by several studies, such as [51,37,38,67,45].
With the development of sensors and Internet of Things (IoT), this
strategy can be the subject of more in-depth investigations. How-
ever, some studies [69,70,59,58] used simulation approach to gen-
erate data for their models. A detailed description of the collected
input and output parameters is presented in section 4.3.
Fig. 4. The frequency of the determined investigated seasons.
Fig. 5. The distribution of investigated regions on the world map.
Fig. 6. The frequency of the operation modes of the investigated buildings.
Z. Qavidel Fard, Zahra Sadat Zomorodian and Sepideh Sadat Korsavi Energy Buildings 256 (2022) 111771
6
7. 4. Machine learning in thermal comfort studies
This section provides an overview of the reviewed papers, in
terms of ML process, applications, input and output parameters,
algorithms and assessment methods, performance and challenges.
4.1. Machine learning process in thermal comfort studies
Main practices of ML, namely, classification, regression, cluster-
ing, dimension reduction and learning in context have been
adopted in the field of building performance [71]. As illustrated
in Fig. 7, these practices are conducted by the means of three main
methods including Supervised Learning, Unsupervised Learning,
and Reinforcement Learning.
In general, the main process in thermal comfort studies that use
ML models consists of 4 phases (Fig. 8):
Problem I
dentification Phase: The first step of any scientific study is to
determine research questions and objectives. In this phase,
thermal comfort researchers state their prediction problem
and describe whether they intend to build average-based mod-
els or PCMs. Furthermore, thermal perception indices (predic-
tion target) and potential predicting parameters (predictors)
are determined, mostly due to the existing literature.
Experimentation Phase:
- Data Collection: Researchers can collect data from several
sources, such as weather stations, environmental sensors, occu-
pant questionnaires, operation of building systems, and con-
texts. Since ML models are data-driven methods and comfort
data is multi-source, it is important to guarantee data quality.
Improving sensing technology, developing multi-source data
fusion methods, and optimizing data governance strategies
are effective ways of solving data quality and collection prob-
lems [27].
- Data Preparation: When more than one data file is available, the
process of merging data or data integration is conducted. Data
cleansing, handling missing values, smoothing noisy data, iden-
tifying and removing outliers and resolving inconsistencies are
also conducted if necessary. Moreover, data reduction including
the reduction of datasets or/and dimension reduction (feature
conditioning) can be done to improve the performance of
models.
- Splitting Data: Dataset is divided into train and test subsets. The
training set is used to develop models while the test set is used
to estimate the predictive performance and generalization abil-
ity of the initially developed models.
- Model Construction: Linear Regression (LR), Logistic Regression
(LoR), Artificial Neural Network (ANN), Support Vector Machine
(SVM), Decision Tree (DT), K-Nearest Neighbors (KNN), Naive
Bayes (NB) and Ensemble Learning algorithms, such as Random
Forest (RF) and AdaBoost (Ab) are some examples of ML models
that can be developed by the means of the training dataset. For
each model, hyperparameters are tuned and the best perform-
ing combination of the hyperparameters is selected.
- Model Validation: After training a model, validation is conducted
to test generalization ability of the model. Good generalization
performance of a trained model indicates that the model is not
over-fitted to the specific training dataset and can be applied for
other datasets as well. There is a variety of performance met-
rics, such as r, R2
, accuracy, MAE, MSE, RMSE, and AUC (ROC)
that researchers can use to evaluate ML models.
Model Selection Phase: By comparing the performance of ML
models, the best performing one(s) are selected. However,
another issue to consider is their time and computational cost.
A proper trade-off between the performance of a model and its
cost makes it an efficient model.
Application Phase: ML models are applied to actual buildings to
provide building occupants with thermal comfort. A ML-based
Model Predictive Control (MPC) system can be implemented
Fig. 7. ML methods and algorithms.
Z. Qavidel Fard, Zahra Sadat Zomorodian and Sepideh Sadat Korsavi Energy Buildings 256 (2022) 111771
7
8. to control the air-conditioning and mechanical ventilation sys-
tems [72]. However, there are some considerations in this area.
These schemes require data collection, transformation and stor-
age technologies. The speed of data collection and transfer
should be high to make MPC systems able to respond to occu-
pants’ thermal requirements as soon as possible. Moreover,
since these schemes should be able to handle big data, they
require sufficient data storage space. Another issue is to moni-
tor occupants with the least intrusion in their daily activities,
which requires non-intrusive devices for data collection. In
addition, repeatedly asking occupants about their thermal per-
ception may distract them from their normal activities. It may
even cause tedium and reduce the accuracy of responses. Thus,
the time scale should be assigned in a way that provides a good
prediction performance with the least number of repetitions.
Furthermore, the performance of ML models in predicting dif-
ferent thermal perception metrics (such as TSV and TPV) should
be compared and evaluated to identify the best describing met-
ric as the target parameter.
4.2. ML application
The main study features of the reviewed papers are categorized
into six groups (Table 2).
4.2.1. Group-based models and PCMs
Table 2 shows that around 62% of studies focused on developing
comfort models for a group of people, while 35% focused on PCMs.
However, both group-based and PCMs were developed and com-
pared in the study by Alsaleem, et al. [43], with the results showing
PCMs have higher accuracies compared to group-based models.
4.2.2. Comparison of ML models
A fundamental step in using ML is model selection, therefore, 26
papers (such as [28,29,51]) addressed this issue and compared the
performance of ML algorithms. Section 4.4 provides a review of ML
models.
4.2.3. Optimized control of HVAC systems
To build a model for thermal comfort prediction, its application
in the real world should be noticed as well. Thus, 13 papers (such
as [44,69,73]) addressed this issue in terms of efficient control of
HVAC systems, which can optimize energy consumption and
improve the thermal environment. For example, Azuatalam et al.
[69] used reinforcement learning with simulated data for PMV pre-
diction in commercial spaces to develop a whole-building HVAC
control and demand response model. Valladares et al. [70] aimed
to optimize energy associated with thermal comfort and indoor
air control via a deep reinforcement learning algorithm. Wang
and Hong [59] applied reinforcement learning besides some super-
vised learning algorithms to predict the neutral operative temper-
ature and neutral air temperature. Sajjadian et al. [52] adopted
Fuzzy logic to predict the lower and upper bounds of the comfort
zone in office spaces in an educational building.
4.2.4. Occupants’ behavior
An essential factor that affects both thermal comfort and energy
consumption is occupants’ behavior. Considering that individuals’
behavior is complex, ML algorithms are beneficial due to their abil-
ity to deal with complex problems. Therefore, 13 papers (such as
[37,64,66]) focused on monitoring or predicting occupants’ behav-
ior. For example, Han et al. [74] adopted reinforcement learning for
predicting occupants’ window opening/closing behavior in office
spaces in China. In another study, Lee and Ham [75] monitored
occupants’ behavior and studied the influence of activity-based
metabolic rate on predicting personal thermal comfort using a
wearable device and environmental sensors.
4.2.5. Feature selection
Using ML algorithms strongly depends on input features, there-
fore, around 23% of the papers (such as [70,76,77]) explained their
sensitivity analysis or feature selection process.
Fig. 8. ML process in thermal comfort studies.
Z. Qavidel Fard, Zahra Sadat Zomorodian and Sepideh Sadat Korsavi Energy Buildings 256 (2022) 111771
8
9. 4.2.6. Outdoor spaces
The use of ML in thermal comfort studies was not limited to
indoor spaces. For example, Mladenović et al. [55] applied SVM
and ANN algorithms to estimate thermal comfort, CO2 emission
and economic growth in an open urban space in Serbia and used
Physiological Equivalent Temperature (PET) as the thermal comfort
metric. In another study, Liu et al. [56] used local skin tempera-
tures and SVM to predict TSV in urban outdoor areas. Kariminia
et al. [57] took a systematic ML approach to analyze visitors’ ther-
mal comfort via predicting TSV, PMV, PET and Mean Radiant Tem-
perature (MRT) in a public urban space in Iran. Eslamirad et al. [58]
applied supervised machine learning to offer algorithms that help
to identify the optimum morphology of green sidewalks to provide
a higher outdoor thermal comfort and decrease errors in results.
Studying thermal comfort in relationship with other comfort
aspects can provide a more comprehensive viewpoint. Thus, Pigli-
Table 2
The overall schema of the reviewed papers.
Paper Developing models
for a group
Developing
personal models
Comparison of
ML models
Aiming at optimized control
of HVAC systems
Focusing on/ predicting
occupants’ behavior
Performing a sensitivity
analysis/feature selection
[18]
[25]
[26]
[28]
[29]
[43]
[51]
[44]
[69]
[73]
[70]
[59]
[52]
[37]
[64]
[66]
[74]
[75]
[76]
[77]
[55]
[56]
[57]
[58]
[78]
[38]
[60]
[79]
[34]
[61]
[67]
[45]
[39]
[80]
[36]
[40]
[81]
[41]
[82]
[42]
[83]
[65]
[84]
[62]
[46]
[85]
[47]
[86]
[48]
[87]
[88]
[89]
[90]
[91]
[63]
[92]
[93]
[49]
[50]
[35]
Z. Qavidel Fard, Zahra Sadat Zomorodian and Sepideh Sadat Korsavi Energy Buildings 256 (2022) 111771
9
10. autile et al. [78] aimed at producing a multi-purpose comfort per-
ception schema, i.e. considering thermal, visual, acoustic, and air
quality comfort spheres under dynamic environmental conditions.
4.3. Input and output parameters
According to Fig. 9, input parameters are classified into 14 main
categories. It should be noted that for papers with multiple objec-
tives, the input parameters were counted for each objective, sepa-
rately, resulting in the total frequency of one of the variables
(indoor environment) being more than 60 (the total number of
papers). Moreover, the column ‘‘Focusing on/ predicting occupants’
behaviour” covers various occupant behaviors, such as window
opening/closing behavior, activity level, occupancy status, and
thermal controls like adjusting set-points or fans. Table 3 also
shows inputs and predicted outputs that were used by the
reviewed papers.
Indoor environmental parameters, personal/demographic
parameters (clothing and metabolism), outdoor environmental
and physiological parameters were the most frequently used
input parameters among the reviewed papers due to their expli-
cit relations with occupants’ thermal conditions. Behavioral
parameters can affect both thermal conditions and building
energy consumption, however, they are less studied. There is
only one paper considering occupants’ behavior with regards
to controls and optimization of HVAC systems [50]. This can
be explained by the subjective and complex nature of behav-
ioral factors, however, ML models with the ability to learn
non-linear and complex relations can facilitate this issue, which
can be the focus of future studies.
The review suggests that indoor environmental parameters
were used more than outdoor environmental ones. Considering
that outdoor weather conditions can also impact people’s
expectations of the thermal environment according to the adap-
tive approach, future ML studies are recommended to conduct
feature selection to identify the more important environmental
variables (indoor or outdoor) in predicting occupants’ thermal
comfort.
With the advent of the Internet of Things (IoT) and new tech-
nologies, using physiological parameters is increasing among
studies, as they can directly capture occupants’ body responses
to thermal conditions, especially in developing PCMs. However,
collecting physiological parameters usually requires sensors to
be attached to occupants’ skin, which may cause disturbance
for people. Thus, employing new lightweight sensors with the
least intrusion can be an interesting research area.
Spatial and architectural parameters were only included in 2
papers [58,85]), one of which considered outdoor spatial
parameters (density, height, and plan type) in conjunction with
vegetation type and weather conditions to predict PMV in green
sidewalks [58] and the other one generated different design
options to assess indoor thermal comfort using mechanical
and natural ventilation [85]. Analyzing the effects of architec-
tural parameters on thermal comfort can assist building design-
ers to design spaces with enhanced indoor thermal
environments, which can be the focus of future studies.
Since thermal comfort is a complex concept with many known
and unknown affecting parameters, investigating its relation-
ship with other comfort aspects, such as visual, acoustical com-
fort, and indoor air quality (IAQ) can provide a more
comprehensive viewpoint. Therefore, six papers
[25,69,67,47,86]) considered lighting/visual parameters, one of
which [89] also considered noise/acoustical ones as inputs.
However, due to a lack of research in this area, future studies
are recommended to further investigate these parameters.
TSV was the most frequently used output (target) parameter
among the reviewed papers (around 48%). TPV, another metric
that can be adopted as a proxy for occupants’ thermal percep-
tion was included in around 12% of the reviewed studies. For
example, Ma et al. [63] used TSV in conjunction with environ-
mental and demographic parameters to predict TPV. The impor-
tance of TPV is in its direct relationship with the potential
control actions that occupants might take to adjust their ther-
mal condition. For example, ‘TPV = want cooler’ is probably
associated with adaptive actions, such as turning on fans or
increasing fan speed, opening window(s) or lowering the heat-
ing set-point. These actions are related to energy consumption
and air quality, therefore, researchers are encouraged to focus
on the importance of TPVs as well as TSVs in future studies.
To quantify the subjective quality of thermal comfort and eval-
uate the performance thermal comfort models by mathematical
metrics, thermal comfort responses (such as TSV and TPV) need
to be redefined as ordinal numbers. Therefore, TSV responses
are often defined as 3 = feeling too cold, 2 = feeling cold,
1 = feeling slightly cold, 0 = feeling neutral, 1 = feeling slightly
war, 2 = feeling warm, and 3 = feeling hot. Similarly, other ther-
mal comfort metrics such as TPV responses are often defined as
Fig. 9. Heat map of the frequencies of used input parameters in relation with the main objectives of the reviewed papers.
Z. Qavidel Fard, Zahra Sadat Zomorodian and Sepideh Sadat Korsavi Energy Buildings 256 (2022) 111771
10
11. 2 = preferring a cooler temperature, 1 = preferring a slightly
cooler temperature, 0 = preferring no change in temperature,
1 = preferring a slightly warmer temperature, 2 = preferring a
warmer temperature.
4.4. Methods and tools
This sub-section presents a comparison of sample sizes, tools,
algorithms, generalization test methods and performance metrics
of the reviewed papers. It should be noted that for papers with
multiple objectives, the used algorithms were counted for each
objective of these papers.
Samples contain various input parameters, such as environmen-
tal, demographic, contextual, behavioral, and physiological ones
which can affect the output parameter (occupants’ thermal
response). According to Table 4, in some studies, such as [52],
and [57], each subject’s thermal response was captured once
Table 3
The input and output parameters of the reviewed papers.
Paper [OE] [IE] [PD] [CON] [B] [P] [L] [TM] [CC] [OS] [S] [N] [ES] [V] Outputs(s)
[18] TSV, TCV
[25] TSV
[26] TSV
[28] 3 and 7-point TSV
[29] TSV
[43] 3-point TSV, Control action
[51] TSV, TA, TPV
[44] Thermal state (derived from TSV)
[69] PMV
[73] Temperature, Humidity (RH)
[70] Temperature
[59] Temperature
[52] Temperature
[37] TSV, Occupants’ Behavior
[64] TPV
[66] TSV, TCV
[74] Occupants’ behavior
[75] TSV
[76] Energy Consumption, Temperature, Air Velocity, PMV
[77] PMV
[55] PET, CO2 Emission, Gross Domestic Product (GDP)
[56] TSV
[57] TSV, MRT, PMV, PET
[58] PMV
[78] TSV
[38] TSV
[60] TSV, TCV, TPV, TA
[79] TSV, ET*, SET, PMV
[34] TSV
[61] TSV
[67] TSV
[45] Thermal State Index (TSI), Optimal Air Temperature
(OAT)
[39] Temperature
[80] Thermal Demand (TD)
[36] TPV
[40] TPV
[81] TPV
[41] Occupancy
[82] TSV
[42] TSV
[83] Thermal State (TS), Discomfort (DC), Comfort (C)
[65] Occupants’ behavior
[84] TSV
[62] 3-point TSV
[46] TPV
[85] PMV, PPD
[47] Thermal Perception
[86] TSV
[48] Occupants’ behavior (activity), Temperature
[87] PMV
[88] Control action
[89] PMV
[90] Thermal Comfort
[91] TSV
[63] TPV
[92] PMV
[93] TSV
[49] TSV
[50] Thermal Perception, Occupants’ behavior
[35] 3-point TSV
[OE]: Outdoor Environment; [IE]: Indoor Environment; [P/D]: Personal/Demographic; [CON]: Contextual [B]: Behavioral; [P]: Physiological; [L]: Lighting/Visual; [TM]: Time
Measure; [CC]: CO2 Concentration; [OS]: Occupancy Status; [S]: Spatial/Architectural; [TA]: Thermal Acceptance; [N]: Noise/Acoustical; [ET]: Expressed State; [V]: Vegetation.
Z. Qavidel Fard, Zahra Sadat Zomorodian and Sepideh Sadat Korsavi Energy Buildings 256 (2022) 111771
11
12. Table 4
The algorithms and assessment methods of the reviewed papers.
Paper Sample size Tool/software Algorithm(s) Generalization test method Performance metric
(s)
[18] 5,512 Matlab SVM, ANN 80% of dataset for train and 20% for test MSE, MAE, r, R2
[25] 1040 (field study) and 413 (lab
study)
NA ENL NA r, R2
, Accuracy
[26] 20,954 Weka ANN, SVM 10-fold cross-validation RMSE, MAE, r
[28] 81,968 Python (Scikit) , R TBM, R,
SVM, ANN,
ENL, BM,
KNN
20-fold cross-validation MSE, R2
[29] 450 (3 subjects) NA ANN 10-fold cross-validation MSE, MAE
[43] 286 (54/91/143 for 3 subjects) Python TBM, ENL,
SVM, PSO
Cross validation (random parts of the data
for learning and evaluation)
Accuracy
[51] NA NA R, TBM, BM,
Kernel
algorithms
NA R2
, RMSE, ROC
[44] 700 (20 subjects: 10 male, 10
female)
R, OriginPro, Matlab SVM, ELM 50% of dataset for train and 50% for test,
10-fold Cross validation for tuning
parameters
MSE, Accuracy
[69] NA EnergyPlus (predicting energy
consumption after application of
RL control)
RL NA Reward
[73] NA Matlab ANN 70% of dataset for train, 15% for validation
and 15% for test
MAE, R2
[70] NA (10 years) EnergyPlus, SketchUp Make and
Open Studio (for simulation),
BCVTB (for co-simulation), Python
RL Results of 10 years for train, results of
10th year for test
Reward
[59] 870 OpenStudio, EnergyPlus (for energy
analysis), Matlab
ANN, R,
TBM, SVM,
ENL, RL
365 data points (a year) for training and
the remainder for test.
Training set size varied from 5 % to 80 % of
the available dataset, in increments of 5%.
RMSE (half of) MSE
[52] 100 (100 subjects) Matlab FLS NA RMSE
[37] 8,404 (4,939 (10 offices) and 3,465
(10 apartment/houses))
Matlab 5 ANN
algorithms
NA MAE, R2
[64] 4,743 (38 subjects) R TBM, GP,
ENL, SVM, R
150 times 2-fold cross- validation AUC (ROC)
[66] 448 (2 female subjects) Matlab SVM, ENL 10-fold cross-validation AUC (ROC)
[74] NA (1 subject) Python RL, RNN For RNN: 70% of dataset for train and 30%
for test
RMSE for RNN and
Reward for Q-
learning and SARSA
[75] 63–115 per person (10 subjects),
953 in total
NA KNN, ENL,
SVM, LVQ
10-fold cross-validation Accuracy, Cohen’s
kappa
[76] NA Matlab ELM, ANN,
FOM
80% of dataset for train and 20% for test MSE
[77] More than 98,000 (training), about
20,000 (validation), 20,000 (test)
Matlab ANN For ANN development: 70% of dataset for
train, 15% for validation and 15% for test
MSE, r, mean
difference, relative
and absolute error
[55] NA NA SVM, ANN,
GP
NA RMSE, R2
, r
[56] 1,116 (26 subjects) NA SVM 80% of dataset for train and 20% for test Accuracy, R2
,
Spearman’s rank
correlation, P-value
[57] 454 (454 subjects, 191 winter/ 263
summer)
NA ANN, GP,
ELM
NA RMSE, r, R2
[58] 2,268 (randomly selected from
8000 models)
ENVI-Met (for data generation),
Python
R Various percentages of test set, cross-
validation
MSE, Accuracy
[78] 1,360 and 1128 (for winter and
summer, respectively 29 subjects)
NA LDA, KNN,
TBM, BM,
SVM, ENL
5-fold cross-validation Accuracy, r, R2
[38] 1,199 (20 subjects) LIBSVM library SVM 5-fold cross-validation Accuracy
[60] 16,795 NA R, SVM 10-fold cross-validation R2
, r
[79] 813 (813 subjects: (467 in NV and
346 in AC buildings))
Weka ENL, ANN,
SVM
10-fold cross-validation MAE, RMSE, R2
, r
[34] 5576 NA KNN, SVM,
ANN
90% of dataset for train and 10% for test Confusion Matrix
[61] 11,000 NA KNN, GA NA Accuracy, True
Positive Rate (TPR),
True Negative Rate
(TNR)
[67] NA (8 subjects) Grasshopper KNN, TBM,
BM, SVM
10-fold cross-validation Accuracy for test
samples
[45] 800 (thermal comfort prediction
model) and 1,155 (energy
consumption prediction model)
Matlab ANN NA MSE, Accuracy
[39] NA Matlab ANN, SVM, 5-fold cross-validation NA
Z. Qavidel Fard, Zahra Sadat Zomorodian and Sepideh Sadat Korsavi Energy Buildings 256 (2022) 111771
12
13. (the number of responses was equal to the number of subjects).
On the other hand, in several other studies, such as [29,64], and
[75], each subject’s response was captured several times (the
number of responses was higher than the number of subjects).
Thus, finding the appropriate proportion of responses to the
number of respondents seems to be an important subject for
sample size. Furthermore, Table 4 shows that there was a large
variation among the papers in terms of sample sizes, ranging
from 54 [43] to 192,021 [65]. The sample size is the number
of collected samples or the number of rows in a data file. Since
all ML methods are data-driven techniques, they strongly rely
on data. Very small sample sizes may result in weak
Table 4 (continued)
Paper Sample size Tool/software Algorithm(s) Generalization test method Performance metric
(s)
TBM, ENL
[80] 969 (11 subjects, first experiment)
and 59 (second experiment)
Matlab SVM NA Accuracy
[36] 900 (generated for verification) and
1,712 (observation)
Python BM Randomly clustering 9 individuals into 3
clusters and attributing 900 data rows to
them
(Clustering Problem)
[40] 3,848 (14 subjects) ’CARET’ Package under R R, ANN,
SVM, KNN,
BM, TBM,
ENL
5-fold cross-validation AUC (ROC), Cohen’s
kappa
[81] 648 Python SVM, ENL 5-fold cross-validation Accuracy, Precision,
Recall
[41] NA Matlab R, ENL, M,
RNN
NA Accuracy
[82] 400 to 500 (22 subjects) Matlab LDA, BM,
KNN
50% of dataset for train and 50% for test Accuracy
[42] NA (7–10 subjects in 2 offices) NA GA Cross-validation Accuracy, RMSE
[83] 700 (20 subjects: 10 male, 10
female)
R ENL 80% of dataset for train and 20% for test P-value
[65] 192,021 (6 subjects) R TBM, ENL 60% of dataset for train, 20% for validation
and 20% for test
Accuracy, MSE, RMSE
[84] 1,305 (50 subjects: 34 male, 16
female)
SPSS, R R, BM, ANN,
SVM, TBM,
ENL
80% of dataset for train and 20% for test Accuracy
[62] 12,829 Python TBM, KNN,
R, ENL, DL
80% of dataset for train and 20% for test Confusion Matrix,
Precision, Recall, F-
Score
[46] NA (19 males and 13 females) NA RF, SVM, R 50% of dataset for train and 50% for test,
10-fold cross-validation
Accuracy, F-Score
[85] 15,936 NA DL/RL A separate 664 data samples as test set,
10-fold cross-validation
Accuracy, AE, APE
[47] 22,575 (12 females and 13 males) R Programming (for correlation
analysis), Python
LDA, R, TBM,
ENL, SVM
60% of dataset for train and 40% for test,
10-fold cross-validation
Accuracy
[86] 15,456, (8 subjects) for first model
and 9,022 after feature selection
Grasshopper (for parametric
model), Python
R, KNN,
TBM, BM,
SVM
80% of dataset for train and 20% for test,
10-fold cross-validation
Accuracy
[48] NA NA DL, CNN NA RMSE
[87] 784 NA ANN 100% of dataset for train and 100% for test RMSE, R2
[88] NA (up to 72 subjects) NA DL NA Reward
[89] Varying for 34 subjects NA KNN N (100, 500, 1000 samples) for train and
0.15*N for test, N (100, 500, 1000
samples) for train and 6400-N for test
Accuracy
[90] 10,794 Python ENL 70% of dataset for train and 30% for test Accuracy, MSE
[91] 964 (13 subjects (443 for men, 522
for women))
Matlab ANN 80% of dataset for train and 20% for test Accuracy
[63] 78,113 Python BNN 5-fold cross-validation Accuracy, F-Score,
AUC (ROC), Adjusted
rand index (ARI)
[92] 172,800 (10 subjects) TensorFlow DL, R, TBM,
BM
75% of dataset for train and 25% for test Time complexity,
Accuracy, Precision,
Recall
[93] NA (10–13 subjects) Python SVM, ENL,
TBM, ANN,
CNN
Leave one subject out (LOSO), 10-fold
cross-validation
Accuracy, MAPE,
MAE
[49] 1,200 (20 students and 10 staff) Python BM, KNN,
TBM, SVM,
ENL, ANN,
RL
10-fold cross-validation MAE, Normalized
Reward (for RL)
[50] NA NA R, SVM, ANN NA Accuracy
[35] 818 (235 subjects in 12 air-
conditioned offices, 583 subjects in
4 naturally ventilated residentials)
NA SVM, ANN,
R, LDA, KNN,
TBM
70% of dataset for train and 30% for test,
70% of dataset for train and 15% for
validation and 15% for test (for ANN)
Accuracy
[NA]: Not Mentioned Specifically; [ANN]: Artificial Neural Network; [SVM]: Support Vector Machine; [R]: Regression Method; [TBM]: Tree-Based Method; [BM]: Bayesian
Method; [ENL]: Ensemble Learning; [GA]: Gaussian Method; [M]: Markov Model; [RNN]: Recurrent Neural Network; [ELM]: Extreme Learning Machine; [KNN]: K-Nearest
Neighbors; [LDA]: Linear Discriminant Analysis; [RL]: Reinforcement Learning; [DL]: Deep Learning; [FOM]: Firefly Optimization Method; [FLS]: Fuzzy Logic System; [GP]:
Genetic Programming; [CNN]: Convolutional Neural Networks; [LVQ]: Learning Vector Quantization; [BNN]: Bayesian Neural Network; [PSO]: Particle Swarm Optimization.
Z. Qavidel Fard, Zahra Sadat Zomorodian and Sepideh Sadat Korsavi Energy Buildings 256 (2022) 111771
13
14. generalization performance of models and very large sample
sizes may increase processing and convergence time, especially
when working with time-consuming algorithms, such as SVM.
Thus, determining the optimum sample size seems to be an
important subject to be further studied.
The most frequently used tools for building ML models were
Matlab, Python and R, which were mentioned in around 25%,
23% and 13% of the papers, respectively. This might be related
to their strong statistical analysis power and their user-
friendly environments. Furthermore, Python provides various
libraries that facilitate the coding process. The overview of the
most frequent tools for ML development helps researchers in
tool selection for their future studies.
In addition to tools for building ML models, some studies
[69,70,59,58,67,86]) adopted simulation instead of field or cli-
mate chamber measurements to generate data. The main chal-
lenge in this approach is that simulation requires determining
many detailed inputs and calibration with real conditions.
As illustrated in Fig. 10, the most frequently used algorithms
among the reviewed papers were SVM, ANN and Ensemble
Learning (mainly RF), followed by Tree-Based models and
Regression methods (mainly LoR). Fathi et al. [94] also reported
SVM, ANN and Ensemble Learning as the most frequently used
algorithms. ANN model has robustness, which can effectively
solve non-linear and complex problems. Besides, through adjust-
ing the weights between different elements, ANN model can
adapt to different cases [95]. SVMs can be trained with few num-
bers of data samples. Another advantage of SVM over other ML
models is the uniqueness and global optimality of the generated
solution, as it does not require non-linear optimization with the
risk of sucking in a local minimum limit [96]. Finally, RF is a form
of ensemble learning, which aggregates small and weak models
into strong and large models. Therefore, even if a few of the
sub-classifiers perform poorly, other classifiers can fix the gap,
which leads to a better generalization [24].
Providing thermal comfort plays a major role in building energy
consumption, therefore, optimization can be used to reduce
energy consumption without compromising occupants’ thermal
comfort. Optimization algorithms (such as Firefly Algorithms,
GP, and PSO) are recommended to be further investigated.
The most adopted generalization test method was 10-fold
cross-validation, followed by splitting the dataset into 80%
training and 20% testing subsets and 5-fold cross-validation.
Another strategy, as in reference [28], is to change the K value
for cross-validation (in this case, in the range of 5 to 100) and
choose the best value for K.
To have a good generalization, an appropriate trade-off between
fitting model for data in hand and preventing overfitting should
be observed. In other words, the model should obtain higher fit-
ting measures and lower error measures. According to Table 4,
the most frequently used metrics for performance evaluation
were accuracy, R2
, RMSE, MSE, and r, which appeared in 50%,
23%, 20%, 18%, and 15% of the papers, respectively. R2
and r
show how much the built models can explain the patterns of
data. Moreover, accuracy, MSE and RMSE can be used to see
how accurate the model is in predicting output values for train
or/and test datasets. This study recommends future studies to
consider both fitting and error metrics for model evaluation.
4.5. Performance of ML models
This section provides an overview of the performance of ML and
PCMs in comparison with conventional methods, their impact on
indoor environmental quality and energy consumption and their
performance in relation to physiological parameters.
4.5.1. ML models and conventional methods
Results from many reviewed papers indicate that ML models
perform better than conventional methods
[18,22,23,33,71,51,44,73,76,70,59,64,74,55,56,38,34,39,63,49,35].
For example, the results of a study by Chai et al. [18] showed that
ML, especially the ANN model was effective in predicting TCV and
TSV in naturally ventilated residential buildings in China. ML mod-
els also outperformed PMV and modified PMV models (aPMV, and
ePMV) in predicting thermal sensation votes. Similarly, Chaudhuri
et al. [35] implemented several classification algorithms for build-
ing a thermal comfort model with data from ASHRAE RP-884 (only
from Singapore). Their results showed that ML approach achieved
prediction accuracies of 73.14–81.2%, outperforming the tradi-
tional Fanger’s PMV model with accuracies of only 41.68–65.5%.
Fig. 10. Heat map of the frequencies of used algorithms in relation with the main objectives of the reviewed papers.
Z. Qavidel Fard, Zahra Sadat Zomorodian and Sepideh Sadat Korsavi Energy Buildings 256 (2022) 111771
14
15. The proposed approach also outperformed modified PMV models
(ePMV and aPMV), which attained accuracies of 61.75% and
35.51%, respectively. Zhou et al. [26] applied SVM to the ASHRAE
RP-884 thermal comfort database. Compared to the PMV model,
the new model’s sum of squares for residuals (SSE) was reduced
by 96.4% and the fitting degree increased by 83.7%. Ma et al. [63]
applied BNN algorithm to build a predictive model for occupant
thermal preference using the ASHRAE Global Thermal Comfort
Database II. Their results revealed that BNN model (with cross-
validated mean accuracy = 0.693) outperformed PMV and adaptive
model with accuracies equal to 0.334 and 0.383, respectively. Hu
et al. [49] compared the prediction performance of several ML
algorithms with PMV, with the results showing that black-box
methods (SVM, RF, and ANN) achieved better performance than
the PMV model. Moreover, in an outdoor context, Kariminia et al.
[57] developed an ELM to forecast thermal comfort of visitors in
an open area in Iran and compared it with two other algorithms
(i.e., GP and ANN). The ELM results had higher accuracy than GP
and ANN with a very high coefficient of determination (0.9354)
and performed better in predicting real thermal sensation votes
than predicting PMV and especially PET values [57].
The performance of ML models is also investigated in studies
with more sensitive occupants. For example, Wang et al. [25]
developed two data-driven models (from a field study and a lab
study) using RF to predict older people’s thermal sensation. Their
field study model, which was developed with 4 environmental
and 2 human-related inputs produced an overall accuracy of
56.6% (24.9% higher than that of the PMV). Their lab study model,
which was built with 5 local skin temperatures demonstrated an
overall accuracy of 76.7%. Brik et al. [92] focused on various types
of disability: physical, learning, intellectual, and neurological dis-
abilities and built DL, LoR, DT, and GNB to predict PMV for this
group. Their model showed an accuracy of 94% and precision and
recall of 98% and 97%, respectively.
4.5.2. PCMs and conventional methods
Besides papers that addressed average-based models, the
results from some other papers demonstrated the good perfor-
mance of PCMs. PCMs take an individual person as the unit of anal-
ysis rather than populations or groups of people and use direct
feedback from individuals and relevant data to train a model
[51]. Shan et al. [29] showed that the prediction accuracy of a
PCM was much higher than that of the PMV model when applied
to individuals. Guenther and Sawodny [42] collected user feedback
in daily working routines and developed a personalized comfort
prediction model. Their results showed a 74% higher individual
prediction accuracy compared to the standard PMV calculation.
Similarly, the work conducted by Kim et al. [64] revealed that
PCMs produced median accuracy up to 0.73, improving the predic-
tions of PMV and adaptive modes with a median accuracy of 0.51.
In another study, Liu et al. [40] developed PCMs using lab grade
wearable sensors in normal daily activities. The developed PCMs
with long-term tracking of physiological and environmental data
resulted in a median prediction power of 78% accuracy and 79%
AUC, which was significantly greater than conventional PMV and
adaptive model [40]. Rehman et al. [62] developed a PCM for air-
conditioned buildings from ASHRAE RP-884 database with an
accuracy of 85% in predicting thermal sensation votes. Lee and
Ham [75] used wearable sensors and ML to continuously monitor
and analyze individual physiological signals, activity-based meta-
bolic rates and environmental parameters to develop a robust
data-driven personalized model in consideration of human activity
variations. In another study, a KNN-based thermal comfort model
was developed to establish a personalized adaptive thermal com-
fort environment [89]. The test results of this work manifested that
the accuracy of the KNN model with 1000 sets of training data
could reach up to 88.31%. Alsaleem et al. [43] evaluated various
supervised ML algorithms to produce accurate PCMs for 3 individ-
uals. They also built a general model, the accuracy of which was
less than the PCMs with accuracies up to 88%. By bringing more
personal interest and data, personalised models may help
researchers to better understand the internal links of personal fac-
tors, such as psychology, physiology and behavioural ones [50].
Thus, this almost new paradigm has become one of the promising
research trends in thermal comfort studies.
4.5.3. ML methods, indoor thermal conditions and energy consumption
Since one of the main goals for analyzing thermal perception is
to adjust indoor thermal conditions, some studies trained and eval-
uated ML methods for this purpose. For example, Peng et al. [39]
used ML to present a control strategy with learning capabilities
to make cooling systems adapt to occupant temperature prefer-
ences under dynamic contexts comprising of indoor and outdoor
conditions as well as occupant behavior. Their results showed that
the active learning-based control reduced the need for occupant
interventions in adjusting room temperatures to fit their prefer-
ences. Furthermore, a 4–25% reduction was reported in cooling
energy demand. Valladares [70] proposed a deep reinforcement
learning algorithm to maintain thermal comfort and air quality
within optimal levels while consuming the least amount of energy
from air-conditioning units and ventilation fans. Their proposed
agent had 10% lower CO2 levels than the current control system
while consuming about 4–5% less energy. In another study [73]
with the similar purpose of optimization, a Model Predicitve Con-
trol (MPC) system with an adaptive ML-based model for building
automation and control applications was proposed, which reduced
58.5% of cooling thermal energy consumption in an office and
36.7% of cooling electricity consumption in a lecture theatre, as
compared to their respective original controls [73]. Yu et al. [88]
also developed a control algorithm for optimization of energy con-
sumption of air-conditioning and exhaust fans through Deep Q-
Learning. Their results showed that the deep learning agent offered
energy saving up to 43% when compared with the air-conditioning
with a fixed temperature of 25 °C. On average, the energy-saving
with this agent was about 19%, yet the corresponding CO2 level
was reduced by about 24% with the presence of agent control. Lu
et al. [34] conducted a data-driven simulation of comfort-based
temperature set-point control system with tabular Q-learning.
Their results revealed that the best recall of the statistical thermal
comfort model was 49.3%, which outperformed that of PMV being
43%. Furthermore, with the implementation of reinforcement
learning controller, the thermal comfort-based controller could
control the set-point to the optimal state with any start state after
a certain number of episodes for training. Similarly, Han et al. [74]
proposed a reinforcement learning method for the advanced con-
trol of window opening and closing to optimize its time point.
Their results demonstrated that the RL control strategy improved
thermal and indoor air quality by more than 90% when compared
with the actual historically observed occupant data.
4.5.4. ML performance and physiological parameters
The performance of ML models can be impacted by input param-
eters, which are assumed to affect the output parameter. According
to Table 3, some studies used outdoor/indoor environmental and
basic personal parameters. However, thermoregulation is the result
of complex mechanisms that are modulated by mutual interactions
between the sympathetic nervous system and the parasympathetic
nervous system [93], which indicates the importance of physiologi-
cal parameters. Thus, some recent studies have focused on physio-
logical parameters. As an example, Chaudhuri et al. [44] presented
a model, which used skin temperature of the area between the wrist
and the fingers on the dorsal side of the hand, the gradient of skin
Z. Qavidel Fard, Zahra Sadat Zomorodian and Sepideh Sadat Korsavi Energy Buildings 256 (2022) 111771
15
16. temperature, body surface area and clothing insulation to evaluate
thermal state. Their results showed that the model based on normal-
ized skin features accurately predicted 87% of thermal states. In a
similar study, the possibility to predict human thermal state from
physiological parameters (hand skin temperature, hand skin con-
ductance, pulse rate, blood oxygen saturation, and blood pressure)
was investigated by using RF [83]. The results from this study man-
ifested that physiological features exhibited the potential to indicate
thermal state. Dai et al. [80] also used skin temperatures as the only
input to an intelligent control model based on SVM. Their results
demonstrated that using a single skin temperature correctly pre-
dicted 80% of thermal demands and using combined skin tempera-
tures from different body segments could improve the model to
over 90% accuracy. In addition to individual and environmental
parameters, Du et al. [84] used skin temperature of nine different
body parts to identify the main impacting factors for a localized air-
flow system and predict a cooling performance based on ML, with
the results showing a prediction performance up to 83.99%. Jung
et al. [46] investigated the performance of personal thermal comfort
inference using classification algorithms. Their results indicated
that when air temperature was used as the sole feature, a median
accuracy of 42.6% was observed across all the models, which was
drastically improved up to 97% when adding heat exchange rate as
another feature. The results of another study revealed that physio-
logical quantities could be used to estimate TSV with mean MAE
and MAPE values that reached up to 1.4 and 24%, respectively [93].
Moreover, Liu et al. [56] developed a SVM model to predict the cool
discomfort, comfort, and warm discomfort in outdoor environments
using local skin temperatures and thermal load as inputs. Their
results showed that when using single local skin temperature as
input, the skin temperature of exposed body parts exhibited the
highest prediction accuracy (66%–70%). The review by Vellei, et al.
has suggested that skin temperature represents the most important
physiological variable affecting thermal perception in the indoor
built environment, with 70% of the reviewed studies having mea-
sured skin temperature and 39% of them having monitored the body
core temperature as physiological parameters [97]. As wearable sen-
sors such as multiparametric chest belts, smartwatches and smart
bands need to represent a good trade-off between accuracy, intru-
siveness and user acceptance [93], this review recommends future
studies focus more on wearable sensors, their comfort and user
acceptance to improve the performance of ML models.
Table 5 shows the performance of ML models in mathematical
formats to make the comparison of their performance with other
models possible. Table 5 suggests that ML models could outperform
PMV models with up to 35.9% higher accuracy and even adaptive
methods with up to 31% higher accuracy [63]. On the other hand,
PCMs could outperform PMV models with up to 74% higher accuracy
[42]. Applying ML-based control schemas reduced thermal comfort-
related energy consumption in buildings up to 58.5% [73], while
improving indoor quality up to 90% [74] and reducing CO2 levels
up to 24% [88]. Moreover, using physiological parameters improved
the prediction accuracy of PCMs up to 97% [46].
4.6. Challenges of ML models
In a recent review study, Khalil et al. [68] concluded that ML
model selection, data privacy and security, and Federated Learning
are the major challenges in the field of thermal comfort IoT data
analytics. More comprehensively, the present review introduces
some challenges relating to the process of all ML applications in
thermal comfort studies.
Data collection: There are 3 main approaches for data collection.
Data can be collected through field studies, which indicate occu-
pants’ real conditions. However, controlling or measuring all of
the potential affecting parameters can be a real challenge in this
approach. In contrast, it is more feasible to control or limit affect-
ing parameters in climate chambers. However, they do not repre-
sent naturally ventilated spaces and real-life conditions. On the
other hand, the third approach (data generation) is to use data
from simulated conditions, instead of real ones. For example,
Eslamirad et al. [58] used ENVI-Met simulation to generate
8,000 samples to evaluate thermal comfort conditions in green
sidewalks, from which 2,268 samples were selected for training
their ML model to predict PMV values. However, simulation
requires determining several input features, which are in many
cases based on premises and can increase the risk of the perfor-
mance gap between the model and real conditions. Moreover,
simulating a large number of various options can be time-
consuming. To mitigate the gap, the study by Xiong and Yao
[89] has used combinations of simulated and field data. In this
study, they collected real environmental parameters by the
means of an artificial intelligent environmental controller. How-
ever, instead of real TSV, simulation was used to calculate PMV
values which were considered as the output parameter (thermal
perception indices). Thus, future studies are recommended to
systematically compare data collection approaches due to study
objectives, implementation challenges and solutions.
Thermal comfort indices: A basic issue in thermal comfort
study, is selecting a thermal perception metric. TSV has been
the most used metric, however, TPV can be more associated
with occupants’ actions and consequently, energy consumption.
Thus, future studies are recommended to investigate both of
these metrics, their relationships with input parameters and
with each other.
Occupants’ Responses: In the case of supervised learning, occu-
pants’ responses (output values) are used as ground truth data.
Once a ML algorithm is trained, its’ prediction is compared with
the real reported thermal responses in terms of evaluation met-
rics. When the prediction of an algorithm is close to the real
occupants’ responses, its performance is better. Time scale of
asking occupants’ thermal conditions is an important issue to
prevent intrusion and tedium, while providing enough data to
train ML models. As a solution to this matter, during a climate
chamber study, Morresi et al. [93] asked the participants to
express their TSV whenever there was a change in it, instead
of collecting TSV with a specific frequency. However, the main
limitation of this solution is that in real life, responders may for-
get to report their thermal perception. Thus, there seems to be a
lack of knowledge in time scaling area, which is recommended
to be further investigated.
Sample size: To build a model with good generalization perfor-
mance with proper processing and convergence time, determin-
ing the optimum sample size is another challenge, which is
recommended to be the focus of future studies to bridge the
gap in this area.
Feature selection: Another consideration is selecting the right
input parameters (conducting feature conditioning), which is
important to prevent wasting time and energy on collecting
inessential parameters and to less disturb occupants’. Therefore,
many of the reviewed studies emphasized feature selection,
since the optimization of input parameters not only increases
the model accuracy but also makes the evaluation process
easier. Future studies are recommended to consider contextual,
psychological and architectural parameters as well to provide a
more comprehensive feature selection process.
Model selection: Since ML provides a range of various algo-
rithms to work with, it’s essential to choose proper ones in
line with the objectives of the study. White-box models (such
as NB, KNN, DT) generate an explicit expression that relates
the environmental parameters with comfort levels, hence,
Z. Qavidel Fard, Zahra Sadat Zomorodian and Sepideh Sadat Korsavi Energy Buildings 256 (2022) 111771
16
17. one of their main advantages is that they are interpretable.
However, comfort level is subjective and depends on many
factors, which may not be learned by white-box these mod-
els. Different from the white-box methods, which rely cru-
cially on the feature selection process, the black-box
approaches can automatically learn the inherent coupling
among different features [49]. Thus, some of the high quali-
fied models for handling complex problems are black-box
models, such as SVM, ANN and ensemble learning methods,
however, these models are not easily interpretable. In addi-
tion, they may be time-consuming, which can be a challenge
for real ML applications in buildings. Therefore, researchers
can adopt and evaluate ML models, in terms of their predic-
tive performance, their complexities to work with, and their
time and computational cost.
Real world application: It is important to address both thermal
comfort and energy consumption simultaneously to control
energy consumption without compromising thermal comfort.
As thermal comfort is a complex subject and interacts with
many factors, further studies are recommended to investigate
its interaction with other comfort aspects and energy
consumption.
5. Conclusion
The use of ML models is growing in many scientific fields, such as
thermal comfort studies due to their capabilities to handle complex
and non-linear problems. To provide an insight into the role of ML
techniques in recent thermal comfort investigations, 60 papers, pub-
lished from 2016 to 2021 were systematically reviewed. The review
Table 5
Performance of ML models.
Study Performance
ML models and conventional methods [18] R2
ANN = 0.799 + R2
PMV or R2
ePMV
R2
ANN = 0.833 + R2
aPMV
R2
SVM = 0.524 + R2
PMV or R2
ePMV
R2
ANN = 0.558 + R2
aPMV
[35] Accuracy ML = 15.7–31.46% + Accuracy PMV
Accuracy ML = 11.39–19.45% + Accuracy ePMV
Accuracy ML = 37.63–45.69 % + Accuracy aPMV
[26] SSE SVM = SSE PMV – 96.4%
Fitting degree SVM = 83.7% + Fitting degree PMV
[63] CV mean accuracy BNN = 35.9% + CV mean accuracy PMV
CV mean accuracy BNN = 31% + CV mean accuracy Adaptive
[49] Performance intelligent thermal comfort neural network = 13.1–17.8% + Performance PMV
[57] Accuracy ELM = 93.54% Accuracy GP or ANN
[25] (Field study) Accuracy RF = 24.9% + Accuracy PMV
(Lab study) Accuracy RF = 76.7%
[92] Accuracy ML = 94% , Precision ML = and 98% and Recall = 97%.
PCMs and conventional methods [29] Mean accuracy PCM = 89.2% Accuracy PMV
Mean MAE PCM = 0.16 and Mean MSE PCM = 0.06
[42] Accuracy PCM = 74% + Accuracy PMV
[64] Accuracy PCM = 22% + Accuracy PMV or Adaptive
[40] Median Cohen’s kappa PCM = 74%, Median accuracy PCM = 78% and Median AUC PCM = 79% Cohen’s kappa,
Accuracy and AUC PMV or Adaptive
[62] Accuracy PCM = 85%
[89] Accuracy PCM = 88.31%
[43] Accuracy PCM = 88% Accuracy General model
ML methods, indoor thermal conditions and
energy consumption
[39] Occupant interventions Active learning-based control Occupant interventions Current control
Cooling energy demand Active learning-based control = Cooling energy demand Current control – 4–25%
[70] CO2 level RL control = CO2 level Current control – 10%
Energy consumption RL control = Energy consumption Current control – 4–5%
[73] (Office) Cooling thermal energy consumption ML control = Cooling thermal energy consumption Current control –
58.5%
(Lecture theatre) Cooling electricity consumption ML control = Cooling electricity consumption Current control – 36.7%
[88] Energy consumption RL control = Energy consumption Current control – 19% (On average)
CO2 level RL control = CO2 level Current control – 24%
[34] Recall RL = 6.3% + Recall PMV
Set-point = Optimal state
[74] Thermal and indoor air quality RL = 90% + Thermal and indoor air quality Current state
ML performance and physiological
parameters
[44] Accuracy ML with normalized skin features = 87%
[83] (Males) Accuracy RF with physiological parameters = 92.86%
(Females) Accuracy RF with physiological parameters = 94.29%
[80] Accuracy SVM with a single skin temperature = 80%
Accuracy SVM with combined skin temperatures 90%
[84] Accuracy ML with skin temperatures 83.99%
[46] Median accuracy ML with air temperature and heat exchange rate = 97% = 54.4% + Median accuracy ML with air temperature
[93] MAE ML with physiological parameters 1.4
MAPE ML with physiological parameters 24%
[56] Accuracy ML with skin temperatures of exposed body parts = 66–70%
*Description:
Example 1: ‘‘R2
ANN = 0.799 + R2
PMV or R2
Epmv” means R2
value of ANN is equal to R2
value of PMV or ePMV models plus 0.799.
Example 2: ‘‘Accuracy ELM = 93.54% Accuracy GP or ANN” means Accuracy of ELM is equal to 93.54% which is higher than accuracy of GP or ANN.
Z. Qavidel Fard, Zahra Sadat Zomorodian and Sepideh Sadat Korsavi Energy Buildings 256 (2022) 111771
17
18. was classified into several sub-sections: overall schema, data collec-
tion, study context, parameters, methods, challenges of ML models
and their application. The main conclusions are summarized as
below:
Most of the reviewed studies (62%) focused on developing
group-based comfort models, while 35% focused on PCMs. Since
PCMs account for individual differences and present high pre-
diction performances, they are recommended to be further
studied.
The most used tools for building ML were Matlab, Python and R
due to their strong statistical analysis power and their user-
friendly environments, which can assist researchers in tool
selection.
The most frequently used algorithms among the reviewed
papers were SVM, ANN and Ensemble Learning (mainly RF), fol-
lowed by Tree-Based models and Regression methods (mainly
LoR) due to their abilities to handle complex problems.
The most frequently used metrics for performance evaluation
were accuracy, R2
, RMSE, MSE, and r, which appeared in 50%,
23%, 20%, 18%, and 15% of the papers, respectively. Future stud-
ies are recommended to consider both fitting and error metrics
for model evaluation.
ML models could outperform PMV and adaptive models with up
to 35.9% and 31% higher accuracy and PCMs could outperform
PMV models with up to 74% higher accuracy. Applying ML-
based control schemas reduced thermal comfort-related energy
consumption in buildings up to 58.5%, while improving indoor
quality up to 90% and reducing CO2 levels up to 24%. Moreover,
using physiological parameters improved the prediction accu-
racy of PCMs up to 97%.
6. Future studies
To suggest research gaps in this area, major recommendations
for future studies are summarized as below:
Study contexts were reviewed in terms of regions, seasons,
building types, and building operation modes. The review over
regions suggests that regions, such as Russia, Southern America,
Africa and the Middle East are less investigated and need to be
further investigated. Due to the high frequency of previous
studies in summer, future studies are recommended to investi-
gate other seasons, especially winter due to its heating demand.
The review over building types indicates that further studies
need to focus on educational buildings and hospitals. As the
most investigated building operation mode was HVAC, future
studies are recommended to further investigate naturally venti-
lated buildings.
Future studies are recommended to investigate the impacts of
architectural and spatial features on thermal comfort, which
can help architects and building designers in creating more
comfortable and energy-efficient buildings. Moreover, future
studies are recommended to further investigate the application
of ML in outdoor thermal comfort studies.
Physiological parameters directly indicate thermal conditions
and their measurement with wearable sensors needs to repre-
sent a good trade-off between accuracy, intrusiveness and user
acceptance. Therefore, it is interesting to investigate how wear-
able sensors can be developed in future research studies and
industry to provide a high level of accuracy without disturbing
users.
In terms of ML algorithms, since optimization can be used to
reduce energy consumption without compromising occupants’
thermal comfort, algorithms such as Firefly algorithms, GP,
and PSO are recommended to be further investigated.
Declaration of Competing Interest
The authors declare that they have no known competing finan-
cial interests or personal relationships that could have appeared
to influence the work reported in this paper.
References
[1] R. Zhao, S. Sun, R. Ding, Conditioning strategies of indoor thermal environment
in warm climates, Energy Build. Elsevier 36 (12) (2004) 1281–1286, https://
doi.org/10.1016/j.enbuild.2003.07.002.
[2] ASHRAE, ASHRAE Standard, 55:1992 Thermal environmental conditions for
human occupancy ASHRAE Standard 55–1992 19 1992 17.
[3] P.O. Fanger, Thermal comfort. Analysis and applications in environmental
engineering, Danish Technical Press, Copenhagen, 1970.
[4] K. Karyono, B.M. Abdullah, A.J. Cotgrave, A. Bras, The adaptive thermal comfort
review from the 1920s, the present, and the future, Devel. Built Environ. 4
(2020) 100032, https://doi.org/10.1016/j.dibe.2020.100032.
[5] Q. Zhao, Z. Lian, D. Lai, Thermal comfort models and their developments: a
review, Energy Built Environ. 2 (1) (2021) 21–33, https://doi.org/10.1016/j.
enbenv.2020.05.007.
[6] M. Tahsildoost, Z.S. Zomorodian, Indoor environment quality assessment in
classrooms: an integrated approach, J. Build. Phys. 42 (3) (2018) 336–362,
https://doi.org/10.1177/1744259118759687.
[7] P.O. Fanger, FUNDAMENTALS OF THERMAL COMFORT, in: Advances In Solar
Energy Technology, Elsevier, 1988: pp. 3056–3061. https://doi.org/10.1016/
b978-0-08-034315-0.50562-0.
[8] J. Toftum, A.S. Jørgensen, P.O. Fanger, Upper limits of air humidity for
preventing warm respiratory discomfort, Energy Build. 28 (1) (1998) 15–23,
https://doi.org/10.1016/S0378-7788(97)00018-2.
[9] P. Ole Fanger, J. Toftum, Extension of the PMV model to non-air-conditioned
buildings in warm climates, in, Energy Build. Elsevier 34 (6) (2002) 533–536,
https://doi.org/10.1016/S0378-7788(02)00003-8.
[10] N. Sirhan, S. Golan, Efficient PMV computation for public environments with
transient populations, Energy Build. 231 (2021) 110523, https://doi.org/
10.1016/j.enbuild.2020.110523.
[11] J. Wu, X. Li, Y. Lin, Y. Yan, J. Tu, A PMV-based HVAC control strategy for office
rooms subjected to solar radiation, Build. Environ. 177 (2020) 106863, https://
doi.org/10.1016/j.buildenv.2020.106863.
[12] A.A.W. Hawila, A. Merabtine, M. Chemkhi, R. Bennacer, N. Troussier, An
analysis of the impact of PMV-based thermal comfort control during heating
period: a case study of highly glazed room, J. Build. Eng. 20 (2018) 353–366,
https://doi.org/10.1016/j.jobe.2018.08.010.
[13] P. Li, T. Parkinson, S. Schiavon, T.M. Froese, R. de Dear, A. Rysanek, S. Staub-
French, Improved long-term thermal comfort indices for continuous
monitoring, Energy Build. 224 (2020) 110270, https://doi.org/10.1016/j.
enbuild.2020.110270.
[14] H. Ikeda, T. Nakaya, A. Nakagawa, Y. Maeda, An investigation of indoor thermal
environment in semi-cold region in Japan – Validity of thermal predictive
indices in Nagano during the summer season, J. Build. Eng. 35 (2021) 101897,
https://doi.org/10.1016/j.jobe.2020.101897.
[15] D. Enescu, A review of thermal comfort models and indicators for indoor
environments, Renew. Sustain. Energy Rev. 79 (2017) 1353–1379, https://doi.
org/10.1016/j.rser.2017.05.175.
[16] H. Yun, I. Nam, J. Kim, J. Yang, K. Lee, J. Sohn, A field study of thermal comfort
for kindergarten children in korea: an assessment of existing models and
preferences of children, Build. Environ. 75 (2014) 182–189, https://doi.org/
10.1016/j.buildenv.2014.02.003.
[17] T. Cheung, S. Schiavon, T. Parkinson, P. Li, G. Brager, Analysis of the accuracy on
PMV – PPD model using the ASHRAE Global Thermal Comfort Database II,
Build. Environ. 153 (2019) 205–217, https://doi.org/10.1016/j.
buildenv.2019.01.055.
[18] Q. Chai, H. Wang, Y. Zhai, L. Yang, Using machine learning algorithms to
predict occupants’ thermal comfort in naturally ventilated residential
buildings, Energy Build. 217 (2020) 109937, https://doi.org/10.1016/j.
enbuild.2020.109937.
[19] S.K. Sansaniwal, J. Mathur, S. Mathur, Review of practices for human thermal
comfort in buildings: present and future perspectives, Int. J. Ambient Energy
(2020), https://doi.org/10.1080/01430750.2020.1725629.
[20] R. de Dear, J. Xiong, J. Kim, B. Cao, A review of adaptive thermal comfort
research since 1998, Energy Build. 214 (2020) 109893, https://doi.org/
10.1016/j.enbuild.2020.109893.
[21] J. Malik, R. Bardhan, P. Banerji, Rethinking indoor thermal comfort in the era of
rebound and pre-bound effect for the developing world: a systematic review,
Indoor Air 30 (3) (2020) 377–395, https://doi.org/10.1111/ina.12664.
[22] R.T. Hellwig, D. Teli, M. Schweiker, J.-H. Choi, M.C.J. Lee, R. Mora, R. Rawal, Z.
Wang, F. Al-Atrash, A framework for adopting adaptive thermal comfort
principles in design and operation of buildings, Energy Build. 205 (2019)
109476, https://doi.org/10.1016/j.enbuild.2019.109476.
[23] M.A. Ortiz, S.R. Kurvers, P.M. Bluyssen, A review of comfort, health, and energy
use: Understanding daily energy use and wellbeing for the development of a
Z. Qavidel Fard, Zahra Sadat Zomorodian and Sepideh Sadat Korsavi Energy Buildings 256 (2022) 111771
18
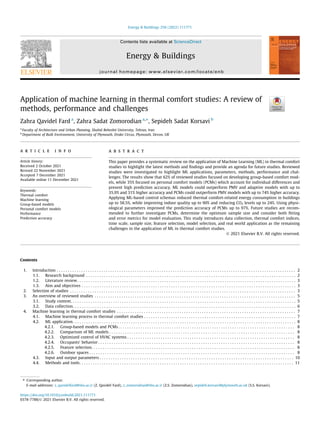
![4.5. Performance of ML models . . . . . . . . . . . . . . . . . . . . . . . . . . . . . . . . . . . . . . . . . . . . . . . . . . . . . . . . . . . . . . . . . . . . . . . . . . . . . . . . . . . . . . . . . 14
4.5.1. ML models and conventional methods . . . . . . . . . . . . . . . . . . . . . . . . . . . . . . . . . . . . . . . . . . . . . . . . . . . . . . . . . . . . . . . . . . . . . . . . 14
4.5.2. PCMs and conventional methods. . . . . . . . . . . . . . . . . . . . . . . . . . . . . . . . . . . . . . . . . . . . . . . . . . . . . . . . . . . . . . . . . . . . . . . . . . . . . 15
4.5.3. ML methods, indoor thermal conditions and energy consumption. . . . . . . . . . . . . . . . . . . . . . . . . . . . . . . . . . . . . . . . . . . . . . . . . . 15
4.5.4. ML performance and physiological parameters . . . . . . . . . . . . . . . . . . . . . . . . . . . . . . . . . . . . . . . . . . . . . . . . . . . . . . . . . . . . . . . . . 15
4.6. Challenges of ML models . . . . . . . . . . . . . . . . . . . . . . . . . . . . . . . . . . . . . . . . . . . . . . . . . . . . . . . . . . . . . . . . . . . . . . . . . . . . . . . . . . . . . . . . . . 16
5. Conclusion . . . . . . . . . . . . . . . . . . . . . . . . . . . . . . . . . . . . . . . . . . . . . . . . . . . . . . . . . . . . . . . . . . . . . . . . . . . . . . . . . . . . . . . . . . . . . . . . . . . . . . . . . . . 17
6. Future studies. . . . . . . . . . . . . . . . . . . . . . . . . . . . . . . . . . . . . . . . . . . . . . . . . . . . . . . . . . . . . . . . . . . . . . . . . . . . . . . . . . . . . . . . . . . . . . . . . . . . . . . . . 18
Declaration of Competing Interest . . . . . . . . . . . . . . . . . . . . . . . . . . . . . . . . . . . . . . . . . . . . . . . . . . . . . . . . . . . . . . . . . . . . . . . . . . . . . . . . . . . . . . . . 18
References . . . . . . . . . . . . . . . . . . . . . . . . . . . . . . . . . . . . . . . . . . . . . . . . . . . . . . . . . . . . . . . . . . . . . . . . . . . . . . . . . . . . . . . . . . . . . . . . . . . . . . . . . . . 18
1. Introduction
1.1. Research background
People spend more than 80% of their time in indoor spaces [1],
which highlights the importance of Indoor Environmental Quality
(IEQ), especially during the COVID-19 lockdown and longer indoor
stays. Thermal comfort as one of the essential elements of IEQ is
defined as ‘‘the condition of mind expressing satisfaction with
the thermal environment” [2]. To investigate thermal comfort,
the two main approaches of Predicted Mean Vote-Percentage of
Dissatisfied (PMV-PPD) and the adaptive approach have been
implemented for a long time.
The Fanger’s PMV-PPD model, which stems from a set of
experiments in controlled climate chambers is based on thermal
equilibrium equations between human body and its environment.
According to Fanger, the human thermal sensation can be deter-
mined by four environmental factors (air temperature, relative
humidity, mean radiant temperature and air velocity) plus two
personal ones (cloth insulation and metabolic rate) [3]. This model
has been used by many researchers during the last fifty years and
has been reviewed in many studies [4–6]. Based on the literature,
several studies [7–12] have recognized the validity of PMV-PPD
model, whether implicitly or explicitly. However, many studies
[13–19] have mentioned the poor prediction power of this model.
Cheung et al. [17] analyzed the accuracy of the PMV–PPD model
using ASHRAE Global Thermal Comfort Database II. They reported
that the accuracy of this model in predicting observed thermal sen-
sations was only 34%. The PMV-PPD model is proven to be reliable
in uniform controlled steady conditions. However, real building
conditions are usually dynamic and non-uniform [18]. Therefore,
a major problem with PMV-PPD model is its lack of accurate pre-
diction in different contexts, especially in field studies and under
uncontrolled conditions. It has been found that the tolerance band
of PMV index can be higher than 1.0 unit for people exposed to the
same environment [19]. Moreover, the PMV index applies to
Nomenclature
List of abbreviations
Term Explanation
Ab AdaBoost
AC Air-conditioned
AE Average Error
AI Artificial Intelligence
ANN Artificial Neural Network
AUC (ROC) Area Under the Receiver Operating Characteristics
BM Bayesian Method
BNN Bayesian Neural Network
CNN Convolutional Neural Networks
DT Decision Tree
DL Deep Learning
ELM Extreme Learning Machine
ENL Ensemble Learning
ET* Effective Temperature
FLS Fuzzy Logic System
FOM Firefly Optimization Method
GA Gaussian Method
GNB Gaussian Naïve Bayes
GP Genetic Programming
HVAC Heating, Ventilation, and Air Conditioning
IAQ Indoor Air Quality
IEQ Indoor Environment Quality
IoT Internet of Things
KNN K-Nearest Neighbors
LDA Linear Discriminant Analysis
LoR Logistic Regression
LVQ Learning Vector Quantization
MAE Mean Absolute Error
Term Explanation
ML Machine Learning
MPC Model Predictive Control
MRT Mean Radiant Temperature
MSE Mean Squared Error
NB Naive Bayes
NV Naturally Ventilated
PCM Personal Comfort Model
PCS Personal Comfort System
PET Physiological Equivalent Temperature
PMV Predicted Mean Vote
PPD Predicted Percentage Dissatisfied
PSO Particle Swarm Optimization
r Correlation Coefficient
R Regression Method
R2
Coefficient of Determination
RF Random Forest
RL Reinforcement Learning
RMSE Root Mean Square Error
RNN Recurrent Neural Network
ROC Receiver Operating Characteristics
SET Standard Effective Temperature
SSE Sum of Squares for Residuals
SVM Support Vector Machine
TBM Tree-based Method
TCV Thermal Comfort Vote
TPV Thermal Preference Vote
TSV Thermal Sensation Vote
Z. Qavidel Fard, Zahra Sadat Zomorodian and Sepideh Sadat Korsavi Energy & Buildings 256 (2022) 111771
2](data:image/gif;base64,R0lGODlhAQABAIAAAAAAAP///yH5BAEAAAAALAAAAAABAAEAAAIBRAA7)