This document summarizes research on applying Kotter's change management model to implement a Customer Relationship Management (CRM) system. The research was a case study of an automation company that used Kotter's eight-stage model for the CRM implementation. The research found that while there was some success using the model, incorporating additional competencies could have improved outcomes. These competencies include skills for managing the change process as it relates to business intelligence tools. The research contributes to change literature by defining competencies important for change programs involving business intelligence systems, and how Kotter's model could be adapted to increase success for these types of changes.
2. J. Risk Financial Manag. 2021, 14, 496 2 of 20
its’ implementation (Haskins et al. 2020; Cunningham 2021). Regardless of the increasingly
critical need to understand the introduction of change, approximately seventy percent of
all change projects fail (Kotter 1990; Beer and Nohria 2000; Higgs and Rowland 2005; Kotter
2007; Axelrod 2010). The inherent complexity within the emerging business intelligence
(BI) discipline, coupled with the significant challenge of having a clear change goal in
planned change, is making the change process for BI projects ambiguous at best and not
adequately addressing the risk management issues. Trieu (2017) determined that there is a
gap between BI value and the process of organisational change.
Many well-known change management models (Kotter 1996; Stacey 2001) have at-
tempted to capture various change drivers, antecedents, and structures to ensure organ-
isational success. Al-Haddad and Kotnour (2015) made the observation that different
change methods need to be used for different change types, resulting in practitioners
needing to be experts in the field to even consider implementation of these theories. Even
with the copious amount of research done in the field, the pertinent link between change
management theory and practice still needs significant development (Pollack and Pollack
2015) with a greater emphasis on producing research in a useable form for practitioners
(Appelbaum et al. 2012). In today’s competitive environment, it is even more imperative
that there is a consideration of change and associated business risk (Misra et al. 2017).
This research paper is focused on a single case study of an organisation in the Automa-
tion Industry, which used Kotter’s (1996) eight-stage model to assist with the implementa-
tion of their Customer Relationship Management (CRM) system. Specifically, the paper
investigates how well Kotter’s change model was applied through its implementation by
reviewing the common pitfalls to change as defined by Kotter (2007) and then making
recommendations on how Kotter’s model could be adapted to increase the probability
of success of the change program. The adaptions address the identified weaknesses in
Kotter’s model when attempting to introduce a CRM BI tool to the business. Current
literature has analysed the efficacy of Kotter’s model (Pollack and Pollack 2015; Kang et al.
2020). No research to date specifically examines a case organisation that uses Kotter’s
model in the context of BI and the implementation of BI tool(s). This research contributes to
a better understanding of how Kotter’s (1996) change management model needs adaptation
in the context of a BI change program.
The first section summarises a literature review of change management, BI and risk.
Following this, research questions and mixed methods methodology (QUAL + Quant) is
outlined. Results from the research are provided in two parts. Firstly, the quantitative
research is summarized to explain the level of CRM utilization after the change has been
attempted within the case organization. Secondly, the larger portion of the research (qualita-
tive) summarises the outcomes of thematic analysis to understand where improvements to
Kotter’s (1996) model could be made. The discussion section suggests a proposed adaption
to Kotter’s (1996) model when faced with a BI change program. The paper concludes with
the managerial implications and overall contributions to existing literature.
Outcomes of the research showed that whilst there was some success in the imple-
mentation of Kotter’s change model, it could have been significantly improved if the
competencies identified in this research were considered prior and during the change jour-
ney. This paper adds value to current change literature/models by defining and describing
the importance of these competencies when embarking on a change program related to BI
tools and systems. Whilst the case study is in the Automation Industry; this research does
not investigate the implications of BI on manufacturing processes (internal), but rather
focuses on the implications of BI on the implementation of only the external customer data
(CRM data).
2. Literature Review
Change approaches and styles can take many forms, depending on which theory
is being observed. Change management theories can be viewed from an individual,
team, and organisation level. The most discussed change management theories are at the
3. J. Risk Financial Manag. 2021, 14, 496 3 of 20
organisational level (Kotter 1996; Stacey 2001), as leaders of organisations attempt to steer
the entire company in line with their corporate or business level strategies. This is the focus
of this paper.
Kotter’s (1996) work, in particular, began to create a much-needed link between
academic research and practitioners in order to translate research into a format usable
by practitioners (Appelbaum et al. 2012; Kang et al. 2020). Step theories or models have
attracted criticism (Kotter 2007; Laine et al. 2020). Despite this, Kotter’s model is still of
relevance today, with researchers using the model to consider change approaches in today’s
complex environment (Haas et al. 2020; Kang et al. 2020; Weiss and Li 2020; Chen 2021).
Any change model could be used for BI change initiatives; however, the change strat-
egy must first be grounded in key business questions (Isson and Harriott 2012). Currently,
many businesses are not clear about what they want out of a BI or artificial intelligence strat-
egy (Williams 2011; Suler et al. 2021), or are struggling to get maximum value and insights
from their data (LaValle et al. 2011; PricewaterhouseCoopers 2015), making commitment
to these strategies hard, and implementation even harder. Hackney et al. (2015) believes
that people’s observations of the outcomes/impacts of using an information system are
an antecedent to satisfaction. With many BI projects taking a longer period of time to
complete, this suggests that the outcomes/impacts should be visible prior to the project
completion. Yeoh and Popovic (2016) believe that a BI project needs a balanced team
focusing on multiple areas such as IT and Business.
With the explosion of developments within the analytics discipline, businesses are
trying to use data in functions such as produce/service development, manufacturing,
marketing and sales, and risk management (Haskins et al. 2020; Suler et al. 2021) to either
optimise internal processes (Davis et al. 2020; Cunningham 2021) and/or to gain a deeper
understanding of the customer behaviour (Nethravathi et al. 2020). Often the root causes
for failing change programs in these areas are internal challenges, such as skills gaps
(Manyika et al. 2011; Williams 2011; Henke et al. 2016; Watson 2017), leadership under-
standing and support, effective technology infrastructure and tools, and alignment with
corporate or business level strategies (Lapide 2014; Henke et al. 2016; Haskins et al. 2020).
Furthermore, research done by Isson and Harriott (2012) of more than 100 companies
showed that 37% indicated that their business intelligence function was not tightly aligned
with the strategic priorities of the organisation.
2.1. Kotter’s Change Management Model
Although aspects of Kotter’s change management model are considered by many
authors (Brisson-Banks 2010; Appelbaum et al. 2012; Pollack and Pollack 2015; Haas et al.
2020; Kang et al. 2020; Weiss and Li 2020; Chen 2021), no empirical studies to date, have
been completed to critically analyse and critique the model in relation to BI practice. Thus,
no scientific consensus has been reached to confirm or falsify its validity. Kotter’s work is
not isolated, with Todnem (2005) positing that change theories available to academics and
practitioners alike are often lacking empirical evidence and are contradictory.
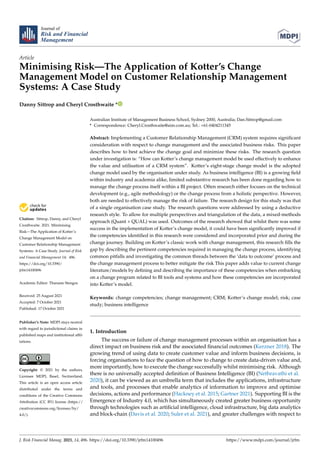
Through looking into each stage of Kotter’s Model (Figure 1) in more detail, either
direct or indirect support can be found.
Stage 1—Establishing a sense of urgency—has many authors’ support (Garvin and
Roberto 2005) by agreeing that there is a need for change recipients to believe there
is a deviation from acceptable performance and therefore creating the need (urgency)
for change.
The specific criteria of stage 2—Creating a guiding coalition—which includes Power,
Expertise, Credibility and Leadership, has support in organisational change theories
(Caldwell 2003). These theories either support having a coalition/team, utilising change
agents, or address the criteria for creating a guiding coalition.
4. J. Risk Financial Manag. 2021, 14, 496 4 of 20
J. Risk Financial Manag. 2021, 14, x FOR PEER REVIEW 4 of 22
Figure 1. Adapted from Kotter’s (1996) Change Stages.
Stage 1—Establishing a sense of urgency—has many authors’ support (Garvin and
Roberto 2005) by agreeing that there is a need for change recipients to believe there is a
deviation from acceptable performance and therefore creating the need (urgency) for
change.
The specific criteria of stage 2—Creating a guiding coalition—which includes Power,
Expertise, Credibility and Leadership, has support in organisational change theories
(Caldwell 2003). These theories either support having a coalition/team, utilising change
agents, or address the criteria for creating a guiding coalition.
Aligning with stage 3—Creating the vision—and stage 4—Communicating the vi-
sion— most change models broadly accept the need to define and communicate what
change is required to reduce uncertainty (Bordia et al. 2004) and decrease ambiguity
(Nelissen and van Selm 2008). Nelissen and van Selm (2008) found significant correlations
between employee satisfaction and management communication during organisational
change. Kang et al. (2020, p. 2) suggest that: “major change is successful only when people
buy-in and drive in the same direction, “and hence communication is required to achieve
this. Appelbaum et al. (2012) identified support for Kotter’s stage of communicating the
vision.
In Stage 5—Empower others to act on the vision—Kotter (1996) addresses four major
sources of major obstacles being structures, skills, systems, and supervisors. This stage
also requires removing obstacles (Kang et al. 2020).
In stage 6—Planning for and creating short-term wins—there is limited evidence in
the existing literature to directly support this stage. The literature does support some of
Kotter’s ‘roles’ of short-term wins, namely: reward change agents (Kouzes and Posner
2011), and undermine cynics and resistors (Fadzil et al. 2017). Lawler and Worley (2006)
Figure 1. Adapted from Kotter’s (1996) Change Stages.
Aligning with stage 3—Creating the vision—and stage 4—Communicating the vision—
most change models broadly accept the need to define and communicate what change
is required to reduce uncertainty (Bordia et al. 2004) and decrease ambiguity (Nelissen
and van Selm 2008). Nelissen and van Selm (2008) found significant correlations between
employee satisfaction and management communication during organisational change.
Kang et al. (2020, p. 2) suggest that: “major change is successful only when people buy-in
and drive in the same direction, “and hence communication is required to achieve this.
Appelbaum et al. (2012) identified support for Kotter’s stage of communicating the vision.
In Stage 5—Empower others to act on the vision—Kotter (1996) addresses four major
sources of major obstacles being structures, skills, systems, and supervisors. This stage also
requires removing obstacles (Kang et al. 2020).
In stage 6—Planning for and creating short-term wins—there is limited evidence in
the existing literature to directly support this stage. The literature does support some of
Kotter’s ‘roles’ of short-term wins, namely: reward change agents (Kouzes and Posner
2011), and undermine cynics and resistors (Fadzil et al. 2017). Lawler and Worley (2006)
believed that when an organisation reverts back to a previous state and fails to anchor the
change, the organisation is often worse off than if it had never attempted the change in the
first place. Kotter addresses these points in stage 7—Consolidate improvements and still
produce more change—and stage 8—Institutionalising new approaches. Wide support is
given by many change management authors (Jacobs 2002), all concerning themselves with
the sustainability of change, albeit from varying perspectives.
Diving into each stage individually, much support is available in existing academic lit-
erature. However, there are also a few general criticisms of Kotter’s model. Appelbaum et al.
(2012) suggested that Kotter’s model is too rigid and does not capture the varying complex-
5. J. Risk Financial Manag. 2021, 14, 496 5 of 20
ities of change. Pollack and Pollack (2015) found in their case study that an organisational
change program required multiple concurrent instances of Kotter’s process throughout the
organisation due to the varying pace of each instance. Weiss and Li (2020, p. 739) argue
that: “while Kotter presents his steps as linear, many steps can be iteratively modified”.
2.2. Change Management and Business Intelligence
Currently, BI-related technologies are ranked among the top priorities for Chief Infor-
mation Officers (CIOs) (Gaardboe and Svarre 2018). Haskins et al. (2020) concluded that
89% of survey respondents (from 4200 individuals involved in manufacturing) believed
that they need to adopt digital technologies to prosper. With this emerging need of gener-
ating BI through data analytics, applying Kotter’s model, without reframing the context
through the lens of this emerging need, could result in poor outcomes for any change
program designed to increase the level of BI through analytics.
Parallels can be drawn with the observations made within the literature and many of
Kotter’s (1996) steps (Table 1).
Table 1. BI and Kotter’s Change Model—developed for this study.
BI Literature Kotter’s Model Linking Theme
Skills Gaps.
Empower others to act on the
vision.
Concerned with the technical
capacity of people to enact the
change required.
Leadership Understanding
Support.
Creating a balanced team.
Establishing a sense of
urgency.
Concerned with creating a
need for change within the
leadership team(s).
Form a powerful guiding
coalition.
Having the right team being
agents for change, which
include a balance of people
across the organisation.
Effective technology,
infrastructure and tools.
Empower others to act on the
vision.
Concerned with having the
right structure and systems in
place to facilitate change.
Alignment with corporate or
business strategies.
Create a vision.
The change vision needs to be
part of the corporate or
business strategies.
Communicate the vision.
Communications of the
corporate or business level
strategies should include the
change vision.
Outcomes/impacts of using
the system is an antecedent to
satisfaction.
Breaking a large project into
smaller ones.
Generating short-term wins.
If leaders cannot show
positive outcomes quickly, it
will reduce satisfaction.
Applying an effective BI change management project also requires businesses to
understand what the Key Success Factors (KSFs) are, which will underpin successful imple-
mentation (Gaardboe and Svarre 2018) and minimise the risk of failure or less effectiveness.
Several authors have completed a meta-data analysis of key success factors which influence
information systems in general. The most predominant themes include overall system
performance, net benefits of the user, and information quality (Hackney et al. 2015; Yeoh
and Popovic 2016; Gaardboe and Svarre 2018). These results show that any change man-
agement project should have a heavy user-oriented perspective, which has been addressed
more in recent times with the evolution of ‘Agile’ ways of working. Varying agendas of
different stakeholders and their subsequent beliefs regarding the success of a BI project
6. J. Risk Financial Manag. 2021, 14, 496 6 of 20
(Urbach et al. 2009), also reinforces the need to ensure the users’ needs are focused on not
just a single stakeholder.
2.3. Change Management and Risk
Identifying planned change inevitably means there is risk to be considered (Kerzner
2018). Stare (2011, p. 72) suggested that the “processes of managing change are incon-
testably relevant” and need to be included in the process of risk management. Risk manage-
ment can be considered part of change management (Misra et al. 2017). Apostolopoulos et al.
(2016) suggest that many project methodologies fail to address risk in change management.
A risk management focus is embedded in change management when there is a focus on re-
sistance to, and management of, change (Stare 2011; Apostolopoulos et al. 2016). Stare (2011,
p. 83) concludes that the combined functions of risk and change management: “enables the
more efficient management of changes to ensure better achievement of project objectives”.
3. Materials and Methods
3.1. Research Questions and Aim
The research question for this study is, how can Kotter’s (1996) change management
model be used effectively to enhance the value and utilisation of a CRM system? The
overall research aim is to minimise the risk of poor business decision-making by more
effectively using the organisations’ adopted change management model.
To achieve this aim, the following sub-questions have been identified:
1. What is the current CRM utilisation?
2. What is the ideal state of CRM utilisation?
3. How can the organisation better manage the change using Kotter’s model as the
foundation?
The first research question was seeking to establish a baseline. This was then followed
up by answering whether (and to what extent) Kotter’s model was followed and imple-
mented. The last was determining how the organisation can better implement the change
process in the future to minimise risk and maximise the probability that the change is
institutionalised.
3.2. Participants Involved in the Research
In total, seventeen participants, from three different levels (6 × Senior Management,
4 × Middle Management and 7 × Functional Team) across six departments of the organisa-
tion, contributed to the data collection that ensured an accurate ‘weighted’ representation
of those that either used CRM or were responsible for its use and development.
Sampling was done using a stratified random sample selection method (Saunders et al.
2019). The population was purposefully divided to capture the heterogeneity in the
department and by organisational hierarchy (role level). Within each department and level,
a random selection of participants was selected, with the total number of participants in
each group adjusted by the level of involvement with the CRM tool.
Although there were a limited number of respondents, planning for detailed in-
terviews with each respondent enabled a high level of depth and richness from the
data collected.
3.3. Methodology
3.3.1. Research Design
The research design is based on a descriptive approach to gain an accurate profile of
current and desired level of CRM utilisation; then, an evaluative study to find out how
effectively the desired level of CRM utilisation was reached (Saunders et al. 2019). The
descriptive component is a quantitative analysis that answers research questions one and
two, whereas the evaluative component is a qualitative analysis which answers question
three. With the sequential mixed methods (Quant + QUAL) approach (Saunders et al.
2019), qualitative analysis is the major component of the research.
7. J. Risk Financial Manag. 2021, 14, 496 7 of 20
The research design for this study is a single organisation case study (Yin 2017) which
seeks to understand the dynamics of the organisation’s selected change management
model within the context of a sales organisation (Eisenhardt and Graebner 2007). The
study employed a deductive research style (Bell et al. 2019) to understand to what extent
the propositions can be confirmed or rejected. The mixed-methods approach allows for
multiple perspectives and triangulation of the data (Saunders et al. 2019). Methods to limit
systematic biases and chance associations included purposeful sampling, triangulation,
individual coding, and quoting comments verbatim (Maxwell 2013).
3.3.2. Measures and Data Collection
Quantitative analysis summarises the actual CRM utilisation level against the desired
level of CRM utilisation by department and hierarchy after the change had been attempted.
Following this, semi-structured interview questions for the qualitative analysis elicited
information about each stage of Kotter’s model related to the pitfalls in change manage-
ment that Kotter (2007) identified, resulting in rich information detailing how the change
process was managed and where improvements could be made. All interviews were
conducted in a neutral environment, recorded, and transcribed for thematic analysis by
coding (Saunders et al. 2019) and production of major and minor themes.
3.3.3. Ethical Considerations
Due to considerations of participants potentially limiting their responses in fear of
specific information about them being reported to upper management levels, all analysis,
reports and publications generated from this project did not include individual names.
Each of the interviewee’s transcriptions was given a code for the purposes of performing
the analysis by department and hierarchy. The transcriptions were completed by an
independent party and did not store or keep any of the recordings and conform to the
quality and security standards expected by an academic research project. No information
was asked that could be potentially sensitive or harmful to the individual within the
context of the workplace. Furthermore, the consent form, which has been acknowledged
and signed by each participant outlines the additional precautions taken to protect each
participant.
Although holistically, the AMSRS Standards needed to be followed (The Research
Society 2021), specifically the following points are pertinent to this project:
1. Participation was voluntary and consent forms had to be signed.
2. Appropriate confidentiality throughout the process of collection, storage, analysis
and reporting was maintained. This included limits to the granular level of data made
available to other employees in the case organisation.
3. Surveying and interviewing were done as anonymously as possible. Where associa-
tion was necessary, surveys were coded.
Ethics approval was granted for this research through the Australian Institute of
Management Business School Ethics Committee.
3.3.4. Limitations
Due to practical limitations, the scope and size of the project and methodological
strategies, there are several limitations and associated assumptions:
1. The methodology did not allow for a natural science positivism philosophy because
the results of the data needed to be more flexibly interpreted to address the research
questions. Moreover, the objective of the research is not to define cause and affect
relationships but to understand individuals’ interpretations of a phenomenon so
that future behaviour can be influenced in line with the strategic direction of the
organisation. Thus, a more interpretivist epistemological approach is taken where
the researcher is more concerned with the empathic understanding of human action
rather than the forces that act on it (Bell et al. 2019). While this does limit the out-
comes of empirical evidenced-based cause and effect relationships, the results will
8. J. Risk Financial Manag. 2021, 14, 496 8 of 20
provide a better understanding of current phenomenon that are occurring and clear
recommendations for future actions based on the perspectives of the participants to
the research.
2. Limited to one organisation as a specific case study. Due to this, the results are not
generalizable to other settings or groups of a similar context.
3. The research assumes that the functions of CRM will not change and that the research
question is only addressing the implementation and utilisation of the set CRM func-
tions. Reality of the digital era dictates that these functions could change and/or
adapt over a short period of time. This could change the responses within the ques-
tionnaires and interviews. However, the research can only consider current and not
future possibilities.
4. Although the CRM functions cover most of the functionality with the CRM system,
there are other areas within the software program that were not included as it would
significantly increase the size of the project to an impractical level.
5. Due to the researcher’s role as the ‘CRM Key User’, there may be an internal bias
represented by the researcher’s personal views surrounding this topic. This has
been communicated prior to each data collection point and personal views were not
communicated during any data collection.
6. An external researcher may yield different outcomes due to the unfamiliarity of the
topic in comparison to the current researcher, particularly in providing clarity to CRM
processes and areas of the semi-structured interview.
7. Due to the fact existing theory is being used, and applying a deductive approach
to the qualitative data analysis, this could restrict the value of the data by not also
incorporating an inductive approach to the analysis (Yin 2017).
8. Some of the senior management members have cross-functional responsibilities. Due
to the types of analysis completed, each respective EMT member with multiple
responsibilities was designated under only one of their departmental responsibili-
ties so that ensuing analysis could be done accurately, without duplicating results
across departments.
4. Results
Customer data is potentially one of the most important collections of information
for the case organisation. CRM represents a ‘shadow’ of their marketplace where they
can draw insights about customer behavior and apply marketing automation techniques;
therefore its correct utilisation is paramount.
4.1. CRM Utilisation
Through the survey, each respondent answered questions regarding which department
should utilise each specific CRM function and whether they themselves utilise the function.
Aggregating this data, we were able to establish the desired and actual utilisation for each
CRM function by department. Current CRM utilisation results described an organisation
with an inconsistent level of utilisation across department and hierarchy, indicating that
that the implementation of Kotter’s change model was not successful. Figure 2 below
indicates the level of each department’s utilisation had compared with the desired level of
CRM utilisation for each department.
9. J. Risk Financial Manag. 2021, 14, 496 9 of 20
ment should utilise each specific CRM function and whether they themselves utilise the
function. Aggregating this data, we were able to establish the desired and actual utilisa-
tion for each CRM function by department. Current CRM utilisation results described an
organisation with an inconsistent level of utilisation across department and hierarchy, in-
dicating that that the implementation of Kotter’s change model was not successful. Figure
2 below indicates the level of each department’s utilisation had compared with the desired
level of CRM utilisation for each department.
Figure 2. Level of CRM actual utilisation against desired utilisation by function and department—
developed for this study.
Based on the gaps in the desired utilisation, we were able to look deeper into whether
a difference in utilisation exists between hierarchies within the business by analysing the
variance of utilisation for each CRM function between the organisational hierarchies.1
Firstly, Figure 3 below illustrates specifically which CRM processes had a low variance.
J. Risk Financial Manag. 2021, 14, x FOR PEER REVIEW 10 of 22
Figure 3. CRM Processes with a high variance of utilisation across organisational hierarchies, as
developed for this study.
Secondly, Figure 4 below illustrates CRM processes with a medium variance.
Figure 3. CRM Processes with a high variance of utilisation across organisational hierarchies, as
developed for this study.
10. J. Risk Financial Manag. 2021, 14, 496 10 of 20
Secondly, Figure 4 below illustrates CRM processes with a medium variance.
Figure 3. CRM Processes with a high variance of utilisation across organisational hierarchies, as
developed for this study.
Secondly, Figure 4 below illustrates CRM processes with a medium variance.
Figure 4. CRM Processes with a high variance of utilisation across organisational hierarchies, as
developed for this study.
Finally, Figure 5 below illustrates CRM processes with a high variance.
Figure 4. CRM Processes with a high variance of utilisation across organisational hierarchies, as
developed for this study.
Finally, Figure 5 below illustrates CRM processes with a high variance.
J. Risk Financial Manag. 2021, 14, x FOR PEER REVIEW 11 of
Figure 5. CRM Processes with a high variance of utilisation across organisational hierarchies, as developed for this study.
These charts describe an organisation that not only has inconsistent utilisation
CRM across departments, but also across hierarchical levels, which supports the assert
that CRM is not being utilised in the desired way.
These identified gaps prove that the change was not successful using Kotter’s mod
either due to the poor implementation of the model or due to elements which Kotte
model does not account for when considering BI tool implementations. Confirmation
change was unsuccessful initiated the qualitative research to understand why these
sults were seen and how improvements could be made.
4.2. Major Themes When Implementing CRM
Eighteen major themes were coded from the interviews, which provides directi
Figure 5. CRM Processes with a high variance of utilisation across organisational hierarchies, as
developed for this study.
These charts describe an organisation that not only has inconsistent utilisation of CRM
across departments, but also across hierarchical levels, which supports the assertion that
CRM is not being utilised in the desired way.
These identified gaps prove that the change was not successful using Kotter’s model,
either due to the poor implementation of the model or due to elements which Kotter’s
11. J. Risk Financial Manag. 2021, 14, 496 11 of 20
model does not account for when considering BI tool implementations. Confirmation the
change was unsuccessful initiated the qualitative research to understand why these results
were seen and how improvements could be made.
4.2. Major Themes When Implementing CRM
Eighteen major themes were coded from the interviews, which provides direction
towards how the organisation managed the known pitfalls of Kotter’s (2007) change
management process. These themes indicate what is most important when implementing
a CRM system through Kotter’s (1996) change management model. The themes, definition
and supporting verbatim comments are presented in Table 2 below.
Table 2. Major themes created in the thematic analysis of semi-structured interviews.
Theme Frequency Definition
Useable Meaningful data
“. . .you need to make the data useable and be able to easily get the
data out in a human interpretable form so that it becomes useful to
people.”—Respondent WRE
“. . .allow them to see how they can take that big amount of data
they’ve got there that they spent half of their sales life entering and
actually use it to generate more sales. . .”—Respondent DRM
47
If the data in CRM is useful and
meaningful, then users will see the
benefit in it.
Consistent Clear Communication
“. . .it was a little bit of a one-hit wonder, where there was a very short
cycle of intensity and then nothing . . . ”—Respondent BIF
“. . .it’s communication is the key, yes. So, if there’s change, you can’t
just convey the change to each of the departments
individually.”—Respondent CRF
36
To communicate the vision or strategy of
CRM consistently and clearly.
Heterogeneous use of CRM
“Everyone seems to be just doing their own thing.”—Respondent CPF
“Right now I just look at it and go OK, that’s their thing, this is our
thing, not my problem.”—Respondent CCM
35
Not yet reached full implementation of
the CRM vision.
No full CRM implementation and/or utilization
“. . .we’re not using to its full potential, CRM.”—Respondent EMF
34
Not yet reached full implementation of
the CRM vision.
CRM efficiency
“It takes a long time to enter a very simple piece of
information.”—Respondent KPM
31
Related to the overall efficiency of the
CRM tool.
Increasing visible benefits of CRM
“. . .what is it, what are the things it’ll do, and what’s in it for me at
the end of the day.”—Respondent WIE
31
Working on showing the benefits of
entering the data.
Hard approach to change management
“There has to be a balance between carrot and stick. Neither of the
two are going to work and neither of the two will work
alone.”—Respondent TIE
27
CRM is viewed as a tool to manage
performance and/or the message to use
CRM has a directive top-down approach.
Negative Mindset/Attitude
“And as well as the understanding of the reporting regime for the
greater good rather than evil, and I still think that’s a sales
management topic that needs to be done.”—Respondent DDE
25
When people view CRM through a
negative bias lens.
The Why
“I believe we need a, a leader who will actually put a picture in
people’s head to understand why we’re doing it.”—Respondent BIF
25
Understanding the underlying purpose
and need for an effective CRM.
Change in organisational roles
“I don’t think anybody in our organisation is really driving the
change in CRM.”—Respondent TIE
20
Expression of a need to change the roles
and or responsibilities of employees.
Knowledge Management
“And to have a culture where any discussions around any
opportunities, any successes, et cetera, are documented and are able
to be extracted from CRM at any given time.”—Respondent MME
18
Identifying, capturing, evaluating,
retrieving, and sharing everything
within CRM.
12. J. Risk Financial Manag. 2021, 14, 496 12 of 20
Table 2. Cont.
Theme Frequency Definition
Performance Management
“We must be using properly every day because it helps us personally
keep track of our goals and so we rely on the
information.”—Respondent CRF
15
How CRM affects the performance
management of employees.
Teamwork
“It’s pretty simple—just interact more.”—Respondent KPF
13 Discussing elements of teamwork.
Milestone Successes
“Look, in some cases, it’s being used very well and I see good insight
come out of it in terms of where we’re going to attack next or what
our motivations are for doing a certain thing.”—Respondent DRM
13
When the organisation has realised an
achievement towards the change goal.
Implementing new ideas
“. . .something that’s really important for us moving forward is
around spending time around ideation, just creating
ideas.”—Respondent WIE
12
Implementing new ideas and
communicating this out to the
organisation to encourage more creative
thinking.
Clear set of goals
“ . . . So if we talk about the shortcomings, I believe what we can do is,
first of all, have some short-term goals.”—Respondent KPF
9 Developing and defining clear goals.
No sense of urgency
“So unless there is some kind of motivation for them to utilise
something like CRM, there’s no reason for them.”—Respondent DRM
6
No sense of urgency throughout various
parts of the organisation.
No clear vision
“What is the vision? Does anyone know what the vision is of CRM
other than the statement it is the main repository for all customer
interactions?”—Respondent MME
4
When there is no clear understanding of
the vision for CRM.
Developed for this study.
Displaying these themes, Table 3 below summarises the top three major themes
discussed at each stage of Kotter’s change model. Apparent is that some of the most
discussed themes appear in multiple stages of Kotter’s (1996) stages. For example, ‘useable
and meaningful data’ was highlighted by the respondents when discussing Stage 1, Stage 3
and Stage 8.
Table 3. Top three major themes at each stage of Kotter’s (1996) change process.
Stage 1: Establish a sense of urgency
(a) Useable and meaningful data.
(b) The ‘Why’.
(c) Knowledge Management.
Stage 2: Form a powerful guiding coalition
(a) Change in organisational roles.
(b) Teamwork.
(c) Heterogenous use of CRM.
Stage 3: Create a vision
(a) Useable and meaningful data.
(b) CRM efficiency.
(c) Heterogenous use of CRM.
Stage 4: Communicate the vision:
(a) Consistent and clear communication.
(b) Hard approach to change management.
(c) Increasing the visible benefits of CRM.
Stage 5: Empower others to act on the vision
(a) No full CRM implementation and/
or utilisation.
(b) CRM efficiency.
(c) Increasing the visible benefits of CRM.
Stage 6: Plan for create short-term wins:
(a) Negative mindset/attitude.
(b) Implementing new ideas.
(c) Consistent and clear communication.
Stage 7: Consolidate improvements and
produce still more change
(a) Milestone successes.
(b) No full CRM implementation and/or
utilisation.
(c) Hard approach to change management.
Stage 8: Institutionalise new approaches:
(a) Useable and meaningful data.
(b) Consistent and clear communication.
(c) The ‘Why’.
Developed for this study.
13. J. Risk Financial Manag. 2021, 14, 496 13 of 20
Research outcomes show that three major themes are the most important to the
successful implementation and utilisation of a CRM tool by use of Kotter’s (1996) change
model. These three themes, namely ‘Useable and meaningful data’, ‘Consistent and clear
communication’ and ‘Heterogeneous use of CRM’, represent 30% of the discussed themes
from the collected data (Figure 6).
J. Risk Financial Manag. 2021, 14, x FOR PEER REVIEW 14 of 22
Figure 6. Three top major themes discussed in the interviews. Adapted from Kotter’s (1996) model.
These themes add to the current body of literature when trying to understand the
root causes of failed change programs in the BI context. ‘Useable and meaningful data’
expresses a lack of understanding regarding how the data can be a benefit to the individ-
ual or business. This theme also shows that there is a lack of context around the data which
would provide meaning and therefore influence decision making. While this is related to
the skills gap challenge identified earlier, this theme hones in on an overall lack of data
literacy. Communication plays a significant role in Kotter’s (1996) model; however, it was
still a consistent topic when discussing the pitfalls across all of Kotter’s (1996) stages
within the theme ‘Consistent and Clear Communication’, suggesting that communication
needs to be further bolstered through many more stages of the process. The third theme,
‘Heterogeneous use of CRM’, identifies an inconsistent understanding of the CRM tool
across the case organisation. Many factors could influence how the CRM is being utilised;
however, the respondents were looking for a more homogeneous view of CRM to enable
a consistent approach to training and day-to-day engagements with CRM.
Figure 7 below shows a nearly equal dispersion of these themes across department
and hierarchy, which illustrates common concerns and/or perspectives on the implemen-
tation and utilisation of the CRM tool. Anomalies to this include Lifetime services/Oper-
ations from a departmental perspective and the Extended Management Team from the
hierarchical perspective. The hierarchical summary also shows that the higher you look
in the hierarchy, the less important these themes become.
Figure 6. Three top major themes discussed in the interviews. Adapted from Kotter’s (1996) model.
These themes add to the current body of literature when trying to understand the
root causes of failed change programs in the BI context. ‘Useable and meaningful data’
expresses a lack of understanding regarding how the data can be a benefit to the individual
or business. This theme also shows that there is a lack of context around the data which
would provide meaning and therefore influence decision making. While this is related to
the skills gap challenge identified earlier, this theme hones in on an overall lack of data
literacy. Communication plays a significant role in Kotter’s (1996) model; however, it
was still a consistent topic when discussing the pitfalls across all of Kotter’s (1996) stages
within the theme ‘Consistent and Clear Communication’, suggesting that communication
needs to be further bolstered through many more stages of the process. The third theme,
‘Heterogeneous use of CRM’, identifies an inconsistent understanding of the CRM tool
across the case organisation. Many factors could influence how the CRM is being utilised;
however, the respondents were looking for a more homogeneous view of CRM to enable a
consistent approach to training and day-to-day engagements with CRM.
Figure 7 below shows a nearly equal dispersion of these themes across department and
hierarchy, which illustrates common concerns and/or perspectives on the implementation
and utilisation of the CRM tool. Anomalies to this include Lifetime services/Operations
from a departmental perspective and the Extended Management Team from the hierarchical
perspective. The hierarchical summary also shows that the higher you look in the hierarchy,
the less important these themes become.
14. J. Risk Financial Manag. 2021, 14, 496 14 of 20
J. Risk Financial Manag. 2021, 14, x FOR PEER REVIEW 15 of 22
Figure 7. Major Themes’ importance by department and hierarchy, as developed for this study.
4.3. Competencies Required
From the thematic analysis, five competencies were identified which provide clear
insight into the perceptions of antecedents to successful CRM BI change management pro-
jects. These competencies address most of the feedback from respondents related to why
the change program failed. In total, 46% of the coded feedback directly supported one of
these five identified competencies required to successfully implement a CRM BI Program
(Figure 8). The volume of feedback directly provided input into the creation of the com-
petencies, and describes their importance when engaging in a CRM change program. Ad-
ditionally, each competency had input from almost all stages of Kotter’s (1996) change
model during the semi-structured interviews. This is consistent with the extant literature
(LaValle et al. 2011; Manyika et al. 2011; Williams 2011; Isson and Harriott 2012; Lapide
2014; Hackney et al. 2015; PricewaterhouseCoopers 2015; Henke et al. 2016; Yeoh and Po-
povic 2016; Watson 2017; Gaardboe and Svarre 2018; Haskins et al. 2020 )
Figure 8. Top five competencies identified—developed for this study.
Figure 7. Major Themes’ importance by department and hierarchy, as developed for this study.
4.3. Competencies Required
From the thematic analysis, five competencies were identified which provide clear
insight into the perceptions of antecedents to successful CRM BI change management
projects. These competencies address most of the feedback from respondents related to
why the change program failed. In total, 46% of the coded feedback directly supported
one of these five identified competencies required to successfully implement a CRM BI
Program (Figure 8). The volume of feedback directly provided input into the creation of the
competencies, and describes their importance when engaging in a CRM change program.
Additionally, each competency had input from almost all stages of Kotter’s (1996) change
model during the semi-structured interviews. This is consistent with the extant literature
(LaValle et al. 2011; Manyika et al. 2011; Williams 2011; Isson and Harriott 2012; Lapide
2014; Hackney et al. 2015; PricewaterhouseCoopers 2015; Henke et al. 2016; Yeoh and
Popovic 2016; Watson 2017; Gaardboe and Svarre 2018; Haskins et al. 2020).
J. Risk Financial Manag. 2021, 14, x FOR PEER REVIEW 15 of 22
Figure 7. Major Themes’ importance by department and hierarchy, as developed for this study.
4.3. Competencies Required
From the thematic analysis, five competencies were identified which provide clear
insight into the perceptions of antecedents to successful CRM BI change management pro-
jects. These competencies address most of the feedback from respondents related to why
the change program failed. In total, 46% of the coded feedback directly supported one of
these five identified competencies required to successfully implement a CRM BI Program
(Figure 8). The volume of feedback directly provided input into the creation of the com-
petencies, and describes their importance when engaging in a CRM change program. Ad-
ditionally, each competency had input from almost all stages of Kotter’s (1996) change
model during the semi-structured interviews. This is consistent with the extant literature
(LaValle et al. 2011; Manyika et al. 2011; Williams 2011; Isson and Harriott 2012; Lapide
2014; Hackney et al. 2015; PricewaterhouseCoopers 2015; Henke et al. 2016; Yeoh and Po-
povic 2016; Watson 2017; Gaardboe and Svarre 2018; Haskins et al. 2020 )
Figure 8. Top five competencies identified—developed for this study.
Figure 8. Top five competencies identified—developed for this study.
15. J. Risk Financial Manag. 2021, 14, 496 15 of 20
5. Discussion
These results emphasized several key competencies that need to be developed in the
implementation of Kotter’s (1996) change model when applying it to a Business Intelligence
strategy such as CRM to better minimise risk and allow for greater success. Although
the eight stages of Kotter’s (1996) model are well accepted, when applying it to a CRM BI
strategy, these competencies need to be addressed as key influences for the success of the
change project.
5.1. Revision of Kotter’s Model to Include CRM BI
Using the results from the qualitative research, Figure 9 below illustrates the proposed
adaption to Kotter’s change model when considering a CRM BI change project. Each of
the competencies need to be applied across various stages as shown above and, therefore,
it is important for people involved in different stages of the change to have the required
competencies. The outcomes of this study infer, at a minimum, the guiding coalition,
between its members, be competent in all required competencies. Failure to achieve this
will put at risk the quality of CRM implementation, subsequent business decisions and
therefore put at risk the overall business success. Kotter’s (1996) model is a stepwise process
which begins at Stage 1 and ends at Stage 8. From the thematic analysis, an adapted version
of this process has been created with a cyclical, hub and spoke topology. This topology
allows the business to re-start the process as many times as necessary as some steps may
need repeated and/or to be strengthened. The hub and spoke component ensure that the
competencies are applied as required across all stages of the change process.
J. Risk Financial Manag. 2021, 14, x FOR PEER REVIEW 16 of 22
5. Discussion
These results emphasized several key competencies that need to be developed in the
implementation of Kotter’s (1996) change model when applying it to a Business Intelli-
gence strategy such as CRM to better minimise risk and allow for greater success. Alt-
hough the eight stages of Kotter’s (1996) model are well accepted, when applying it to a
CRM BI strategy, these competencies need to be addressed as key influences for the suc-
cess of the change project.
5.1. Revision of Kotter’s Model to Include CRM BI
Using the results from the qualitative research, Figure 9 below illustrates the pro-
posed adaption to Kotter’s change model when considering a CRM BI change project.
Each of the competencies need to be applied across various stages as shown above and,
therefore, it is important for people involved in different stages of the change to have the
required competencies. The outcomes of this study infer, at a minimum, the guiding coa-
lition, between its members, be competent in all required competencies. Failure to achieve
this will put at risk the quality of CRM implementation, subsequent business decisions
and therefore put at risk the overall business success. Kotter’s (1996) model is a stepwise
process which begins at Stage 1 and ends at Stage 8. From the thematic analysis, an
adapted version of this process has been created with a cyclical, hub and spoke topology.
This topology allows the business to re-start the process as many times as necessary as
some steps may need repeated and/or to be strengthened. The hub and spoke component
ensure that the competencies are applied as required across all stages of the change pro-
cess.
Figure 9. Adapted version of Kotter’s change model (Kotter 1996) for BI change projects.
Figure 9. Adapted version of Kotter’s change model (Kotter 1996) for BI change projects.
The spectrum of these identified competencies ranges from hard technical skills to
soft, people-oriented skills. When overlaid against the process and relevant skills of taking
16. J. Risk Financial Manag. 2021, 14, 496 16 of 20
raw data to tangible outcomes, we can observe which of these competencies need to be
used at different parts of this process (Figure 10). Interestingly, the beginning of the process
needs predominately hard skills, whereas the end of the process requires softer skills. Any
BI change an organisation is wanting to embark on will follow a process similar to this.
Based on the feedback related to these competencies at different stages of Kotter’s model,
the following suggestions are made to strengthen the process from turning data to business
outcomes into Kotter’s model:
1. Form the guiding coalition with people across all required competencies for turning
data into outcomes.
2. Allow all members of the guiding coalition to be part of forming the vision and
establishing the sense of urgency.
3. All parties in the guiding coalition should be responsible for the communication of the
vision and ensuring short-term wins to their respective teams in a consistent manner.
4. Ensure the required technical proficiency is available, particularly to facilitate the
‘Data’ to ‘Information’ stages.
5. Check in with people who understand the business strategies and processes, to ensure
the change is being institutionalised.
J. Risk Financial Manag. 2021, 14, x FOR PEER REVIEW 17 of 22
The spectrum of these identified competencies ranges from hard technical skills to
soft, people-oriented skills. When overlaid against the process and relevant skills of taking
raw data to tangible outcomes, we can observe which of these competencies need to be
used at different parts of this process (Figure 10). Interestingly, the beginning of the pro-
cess needs predominately hard skills, whereas the end of the process requires softer skills.
Any BI change an organisation is wanting to embark on will follow a process similar to
this. Based on the feedback related to these competencies at different stages of Kotter’s
model, the following suggestions are made to strengthen the process from turning data to
business outcomes into Kotter’s model:
1. Form the guiding coalition with people across all required competencies for turning
data into outcomes.
2. Allow all members of the guiding coalition to be part of forming the vision and es-
tablishing the sense of urgency.
3. All parties in the guiding coalition should be responsible for the communication of
the vision and ensuring short-term wins to their respective teams in a consistent man-
ner.
4. Ensure the required technical proficiency is available, particularly to facilitate the
‘Data’ to ‘Information’ stages.
5. Check in with people who understand the business strategies and processes, to en-
sure the change is being institutionalised.
Figure 10. Overlaying the process and skills needed to turn data to business outcomes with the change management skills
required, as developed for this study.
The proposed model encapsulates the importance of a variety of competencies which
is often not found in one or two people alone, and therefore it is posited that a specific set
of people with these specific competencies must be involved in CRM BI change programs
Figure 10. Overlaying the process and skills needed to turn data to business outcomes with the change management skills
required, as developed for this study.
The proposed model encapsulates the importance of a variety of competencies which
is often not found in one or two people alone, and therefore it is posited that a specific set of
people with these specific competencies must be involved in CRM BI change programs to
make it successful and to reduce risk. Yeoh and Popovic (2016) supported this, indicating
that a BI project needs a balanced team to deliver value faster. The proposed model also
addresses the identified criticism with Kotter’s model that it is too rigid (Appelbaum et al.
2012) by confirming that people may need to jump in-between stages (Pollack and Pollack
2015) at any time during the change process.
Commonalities with the Key Success Factors (KSF) discussed earlier and the themes,
created in the qualitative analysis, can also be found; for example:
17. J. Risk Financial Manag. 2021, 14, 496 17 of 20
1. KSF, overall system performance (Hackney et al. 2015; Yeoh and Popovic 2016;
Gaardboe and Svarre 2018), and the theme ‘CRM efficiency’.
2. KSF, net benefits of the user (Hackney et al. 2015; Gaardboe and Svarre 2018), and the
theme ‘Increasing the visible benefits of CRM’.
3. KSF, information quality (Hackney et al. 2015; Yeoh and Popovic 2016; Gaardboe and
Svarre 2018) and the theme ‘data quality’.
The five competencies have linkages to existing literature in BI and change manage-
ment. For example, Isson and Harriott (2012) believed that BI strategies should be first
grounded in key business questions, and other authors state that there needs to be an align-
ment between business and data strategies (Lapide 2014; Henke et al. 2016) and how data
can enhance them complementing the competency, ‘Delivering visible benefits through
the understanding of strategy and business processes. When executing this competency,
it is important to consider that different users will see different benefits in the system
(Levy et al. 2009) and, therefore, the creation of the vision and planning of short-term wins
(Kotter 1996) need to be considered.
Because of the evidence that a relationship between employee satisfaction and manage-
ment communication exists (Nelissen and van Selm 2008), communication of the strategy,
vision and successes needs to follow Kotter’s definition of a vision—‘a picture of the future
with some implicit or explicit commentary on why people should strive to create that
future’—to ensure the communications match the value drivers for all users.
The competencies ‘creation of meaningful information from data’ and ‘technical
proficiency’ are usually only discussed briefly in traditional change management literature,
if at all. However, in this study we have discovered these skills are essential to CRM BI
change management. Combining the literature with the results of the study infers that the
skills gap which has been identified by several authors (Manyika et al. 2011; Williams 2011;
Henke et al. 2016; Watson 2017) and the level of alignment to business strategy, has a direct
impact on the ability of businesses to create meaningful information from data. Moreover,
Watson et al. (2016) recognised that, due to the complexity and longevity of BI projects, it
may be necessary to break large projects into smaller ones.
Finally, ‘leadership skills with teamwork and collaboration’ expands on Kotter’s desire
to have a guiding coalition with the power, expertise, credibility and leadership by honing
in on the importance of the team, as most CRM BI change projects affect a variety of people
within an organisation.
With regards to the data to outcome process, the challenge for businesses is to know
the business outcomes required so that the vision can be created and communicated. Lead-
ership teams of organisations who often create these visions for businesses are often strong
in soft leadership skills; however, they may lack the technical expertise to understand what
is possible with their data. Therefore, it will be imperative in the future for businesses to
have representation within the senior leadership levels from someone who can translate
technical possibilities to the vision and strategies of the business. Without this representa-
tion at a senior management level, it is likely that the guiding coalition would not have the
power or credibility to influence the change possibilities within businesses.
5.2. Further Research
Results from this study provide insight into a specific use case, and therefore similar
research could be conducted across multiple business and BI platforms to increase general-
isation. The outcomes from this research provide a relevant reference point from which
to test hypotheses regarding how important these competencies are to other data-driven
change projects and reduce the many risks inherent in most change processes. Further
to this, more research could be conducted to granulise the elements which contribute to
the development of the identified competencies to understand how they could be devel-
oped within organisations and to provide a finer definition. Additionally, researching the
agile impact methodology may have on the adapted change process of a CRM BI project
18. J. Risk Financial Manag. 2021, 14, 496 18 of 20
could provide further depth to these results, which could be useful for academics and
practitioners alike.
6. Conclusions
The intent of this research was to adapt an already well-known and recognised model
within the CRM BI context, currently in use in the case organisation, so that it can be
realistically implemented within the case organisation and other business environments to
minimise risk and enhance the chance of change success.
This study has addressed the gap which Trieu (2017) identified of limited literature
evaluating the change process when introducing BI systems within organisations and
addressed the concern Appelbaum et al. (2012) had that there needs to be a greater
emphasis on producing research in a useable form for practitioners.
Key competencies developed through qualitative research are supported by, and adds
to, existing literature. There is strong alignment between the key competencies developed
and the root causes for failing change programs (Manyika et al. 2011; Williams 2011;
Lapide 2014; Henke et al. 2016; Watson 2017; Haskins et al. 2020), Yeoh and Popovic’s
(2016) opinion that a balanced team is required for BI change programs and Key Success
Factors (KSF) created for information systems (Hackney et al. 2015; Yeoh and Popovic
2016; Gaardboe and Svarre 2018). Results showed that using Kotter’s change model is still
relevant within the BI context, however additional considerations need to be made with
respect to the breadth and depth of competencies required to make the change successful.
However, since these competencies range from employing hard and soft skills, there is
a low likelihood that all competencies can be found in only a few people, which could
cause some challenges for businesses. A lack of adherence to Kotter’s (1996) model when
embarking on BI change programs has many notable managerial implications, and hence,
elevated risk, including but not limited to:
(a) Sub-standard configuration of CRM software.
(b) End-users not being able to extract value from CRM.
(c) Little end-user belief in why CRM is being implemented.
(d) Poor data (created by end-users) will result in a greater risk of poor business decisions.
(e) Businesses could miss key market opportunities.
The results give industry practitioners the framework needed to successfully imple-
ment Kotter’s change management model within the CRM BI context, which helps to
minimise risk and bridge the gap between theory and practice.
Author Contributions: Conceptualization, D.S. and C.C.; methodology, D.S.; validation, C.C.; for-
mal analysis, D.S.; investigation, D.S.; resources, D.S.; data curation, D.S.; writing—original draft
preparation, D.S.; writing—review and editing, C.C.; supervision, C.C.; project administration, C.C.
All authors have read and agreed to the published version of the manuscript.
Funding: This research received no external funding.
Institutional Review Board Statement: The study was conducted according to the guidelines of
the Declaration of Helsinki, and approved by the Ethics Committee of the Australian Institute of
Management (October 2017 approval).
Informed Consent Statement: Informed consent was obtained from all subjects involved in the study.
Data Availability Statement: The data presented in this study are available on request from the cor-
responding author. The data are not publicly available due to commercial and confidentiality issues.
Acknowledgments: The authors wish to acknowledge the support of the Australian Institute of
Management Business School; to Rob Scott and BJ Scott for editing and to Violet Lazarevic-Sittrop for
ongoing advice and support.
Conflicts of Interest: The authors declare no conflict of interest.
19. J. Risk Financial Manag. 2021, 14, 496 19 of 20
Note
1 The basis of utilisation is compared with the defined ‘desired utilisation’ across hierarchies. The low, medium, and high groupings
were calculated by a basic clustering algorithm in Tableau.
References
Al-Haddad, Serina, and Timothy Kotnour. 2015. Integrating the organizational change literature: A model for successful change.
Journal of Organizational Change Management 28: 234–62. [CrossRef]
Apostolopoulos, Charalampos, George Halikias, Krikor Maroukian, and Georgios Tsaramirsis. 2016. Facilitating organisational
decision making: A change risk assessment model case study. Journal of Modelling in Management 11: 694–721. [CrossRef]
Appelbaum, Steven H., Sally Habashy, Jean-Luc Malo, and Hisham Shafiq. 2012. Back to the future: Revisiting Kotter’s 1996 change
model. Journal of Management Development 31: 764–82. [CrossRef]
Axelrod, Richard. 2010. Terms of Engagement: New Ways of Leading and Changing Organizations. San Francisco: Berrett-Koehler Publishers.
Beer, Michael, and Nitin Nohria. 2000. Breaking the Code of Change. Boston: Harvard Business School Press Books.
Bell, Emma, Alan Bryman, and Bill Harley. 2019. Business Research Methods, 5th ed. Oxford: Oxford University Press.
Bordia, Prashant, Elizabeth Hunt, Neil Paulsen, Dennis Tourish, and Nicholas DiFonzo. 2004. Uncertainty during organisational
change: Is it all about control? European Journal of Work and Organizational Psychology 13: 345–65. [CrossRef]
Brisson-Banks, Claire V. 2010. Managing change and transitions: A comparison of different models and their commonalities. Library
Management 31: 241–52. [CrossRef]
Caldwell, Raymond. 2003. Change leaders and change managers: Different or complementary? Leadership Organization Development
Journal 24: 285–93.
Chen, Chwen Jen. 2021. SoTL enculturation guided by Kotter’s model of change. International Journal for Academic Development 1–5.
[CrossRef]
Cunningham, Evelyn. 2021. Artificial Intelligence-based Decision-Making Algorithms, Sustainable Organizational Performance, and
Automated Production Systems in Big Data-Driven Smart Urban Economy. Journal of Self-Governance Management Economics 9:
31–41. [CrossRef]
Davis, Ruth, Marek Vochozka, Jaromir Vrbka, and Octav Neguriă. 2020. Industrial Artificial Intelligence, Smart Connected Sensors, and
Big Data-driven Decision-Making Processes in Internet of Things-based Real-Time Production Logistics. Economics, Management
Financial Markets 15: 9–15. [CrossRef]
Eisenhardt, Kathleen M., and Melissa E. Graebner. 2007. Theory Building from Cases: Opportunities and Challenges. Academy of
Management Journal 50: 25–32. [CrossRef]
Fadzil, Ahmad Syahmi, Syed Jamal Mohamad, and Roshidi Hassan. 2017. Resistance to Change (RTC): A Taxonomical Perspective.
International Journal of Management Reviews 2: 116–22.
Gaardboe, Rikke, and Tanja Svarre. 2018. Business Intelligence Success Factors: A Literature Review. Journal of Information Technology
Management 29: 1–15.
Gartner. 2021. Analytics and Business Intelligence (ABI). Available online: https://www.gartner.com/en/information-technology/
glossary/business-intelligence-bi (accessed on 30 September 2021).
Garvin, David A., and Michael A. Roberto. 2005. Change through Persuasion. Harvard Business Review 83: 26–33.
Haas, Mary R. C., Brendan W. Munzer, Sally A. Santen, Laura R. Hopson, Nathan L. Haas, Daniel Overbeek, William J. Peterson,
James A. Cranford, and Robert D. Huang. 2020. #DidacticsRevolution: Applying Kotter’s 8-Step Change Management Model to
Residency Didactics. The Western Journal of Emergency Medicine 21. [CrossRef]
Hackney, Ray A., Paul Dooley, Yair Levy, and James Parrish. 2015. Critical value factors in business intelligence systems implementation
success: An empirical analysis of system and information quality. Paper presented at the International Conference on Information
Systems, Fort Worth, TX, USA, December 13–16.
Haskins, Peter, Anca Georgeta Luţan, and Alina Tănase. 2020. Sustainable Value Creation Networks, Digitized Mass Production, and
Networked Information-driven Technologies in Industry 4.0-based Manufacturing Systems. Economics, Management Financial
Markets 15: 37–43. [CrossRef]
Henke, Nicolaus, Jacques Bughin, Michael Chui, James Manyika, Tamim Saleh, Bill Wiseman, and Guru Sethupathy. 2016. The Age of
Analytics: Competing in a Data-Driven World. Chicago: McKinsey Company.
Higgs, Malcolm, and Deborah Rowland. 2005. All changes great and small: Exploring approaches to change and its leadership. Journal
of Change Management 5: 121–51. [CrossRef]
Isson, Jean-Paul, and Jesse Harriott. 2012. Win with Advanced Business Analytics: Creating Business Value from Your Data. Somerset: John
Wiley Sons.
Jacobs, Ronald L. 2002. Institutionalizing organizational change through cascade training. Journal of European Industrial Training 26:
177–82. [CrossRef]
Kang, Sung Pil, Yan Chen, Vanessa Svihla, Amber Gallup, Kristen Ferris, and Abhaya K. Datye. 2020. Guiding change in higher
education: An emergent, iterative application of Kotter’s change model. Studies in Higher Education 1–20. [CrossRef]
Kerzner, Harold. 2018. Project Management Best Practices: Achieving Global Excellence, 4th ed. Hoboken: Wiley.
Kotter, John P. 1990. A Force for Change: How Leadership Differs from Management. New York: Free Press.
20. J. Risk Financial Manag. 2021, 14, 496 20 of 20
Kotter, John P. 1996. Leading Change. Boston: Harvard Business School Press.
Kotter, John P. 2007. Leading Change: Why Transformation Efforts Fail. Harvard Business Review 85: 96–103.
Kouzes, James M., and Barry Z. Posner. 2011. Credibility: How Leaders Gain and Lose It, Why People Demand It. New York: John
Wiley Sons.
Laine, Pertti, Päivikki Kuoppakangas, and Jari Stenvall. 2020. Change Strategy (CS): Is There Any? Nordic Journal of Business 69: 5–22.
Lapide, Larry. 2014. Visualization—Key to Predictive Business Analytics. Journal of Business Forecasting 33: 34–38.
LaValle, Steve, Eric Lesser, Rebecca Shockley, Michael S. Hopkins, and Nina Kruschwitz. 2011. Big Data, Analytics and the Path from
Insights to Value. MIT Sloan Management Review 52: 21–32.
Lawler, Edward E., III, and Christopher G. Worley. 2006. Built to Change: How to Achieve Sustained Organizational Effectiveness,
1st ed. San Francisco: Jossey-Bass.
Levy, Yair, Kenneth E. Murphy, and Stelios H. Zanakis. 2009. A Value-Satisfaction Taxonomy of IS Effectiveness (VSTISE): A Case
Study of User Satisfaction with IS and User-Perceived Value of IS. International Journal of Information Systems in the Service Sector 1:
93–118. [CrossRef]
Manyika, James, Michael Chui, Brad Brown, Jacques Bughin, Richard Dobbs, Charles Roxburgh, and Angela Hung Byers. 2011. Big
Data: The Next Frontier for Innovation, Competition, and Productivity. Chicago: McKinsey Company.
Maxwell, Joseph A. 2013. Qualitative Research Design: An Interactive Approach, 3rd ed. Thousand Oaks: SAGE.
Misra, Subhas C., Riya Rana, Ritika Verma, Vinod Kumar, and Uma Kumar. 2017. Modelling change management and risk management
in a financial organization due to information system adoption. Transnational Corporations Review/Kuaguo Gongsi 9: 248–68.
[CrossRef]
Nelissen, Paul, and Martine van Selm. 2008. Surviving organizational change: How management communication helps balance mixed
feelings. Corporate Communications: An International Journal 13: 306–18. [CrossRef]
Nethravathi, Periyapatna Sathyanarayana Rao, Gokarna Vidya Bai, Cristi Spulbar, Mendon Suhan, Ramona Birau, Toni Calugaru,
Iqbal Thonse Hawaldar, and Abdullah Ejaz. 2020. Business intelligence appraisal based on customer behaviour profile by using
hobby based opinion mining in India: A case study. Economic Research-Ekonomska Istrazivanja 33: 1889–908. [CrossRef]
Pollack, Julien, and Rachel Pollack. 2015. Using Kotter’s Eight Stage Process to Manage an Organisational Change Program:
Presentation and Practice. Systemic Practice Action Research 28: 51–66. [CrossRef]
PricewaterhouseCoopers. 2015. Data Driven—What Students Need to Succeed in a Rapidly Changing Business World. London: Pricewater-
houseCoopers.
Saunders, Mark, Philip Lewis, and Adrian Thornhill. 2019. Research Methods for Business Students, 8th ed. Harlow: Pearson Education,
Limited.
Stacey, Ralph. 2001. Complex Responsive Processes in Organizations: Learning and Knowledge Creation. London: Taylor Francis Group.
Stare, Aljaz. 2011. Reducing Negative Impact of Project Changes with Risk and Change Management. Zagreb International Review of
Economics Business 14: 71–85.
Suler, Petr, Laura Palmer, and Svitlana Bilan. 2021. Internet of Things Sensing Networks, Digitized Mass Production, and Sustainable
Organizational Performance in Cyber-Physical System-based Smart Factories. Journal of Self-Governance Management Economics
9: 42–51. [CrossRef]
The Research Society. 2021. Professional Standards. Available online: https://researchsociety.com.au/professional-standards/
standards (accessed on 30 September 2019).
Todnem, Rune. 2005. Organisational change management: A critical review. Journal of Change Management 5: 369–80. [CrossRef]
Trieu, Van-Hau. 2017. Getting value from Business Intelligence systems: A review and research agenda. Decision Support Systems 93:
111–24. [CrossRef]
Urbach, Nils, Stefan Smolnik, and Gerold Riempp. 2009. The State of Research on Information Systems Success. Business Information
Systems Engineering 1: 315–25. [CrossRef]
Watson, Hugh J. 2017. The Cognitive Decision-Support Generation. Business Intelligence Journal 22: 5–14.
Watson, Hugh J., Hauke Heier, Hans P. Borgman, and Fabiano G. Neves. 2016. BI Project Success Is in the Eye of the Beholder. Business
Intelligence Journal 21: 5–9.
Weiss, Pnina G., and Su-Ting T. Li. 2020. Leading Change to Address the Needs and Well-Being of Trainees during the COVID-19
Pandemic. Academic Pediatrics 20: 735–41. [CrossRef]
Williams, Steve. 2011. 5 Barriers to BI Success and how to overcome them. Strategic Finance 93: 27–33.
Yeoh, William, and Ales Popovic. 2016. Extending the Understanding of Critical Success Factors for Implementing Business Intelligence
Systems. Journal of the Association for Information Science Technology 67: 134–47. [CrossRef]
Yin, Robert K. 2017. Case Study Research and Applications: Design and Methods, 6th ed. Thousand Oaks: SAGE.