
Recommandé
Contenu connexe
Similaire à Daily Report 6 may.pdf
Similaire à Daily Report 6 may.pdf (20)
Plus de BluechipInvestment
Plus de BluechipInvestment (20)
Dernier
Dernier (20)
Daily Report 6 may.pdf
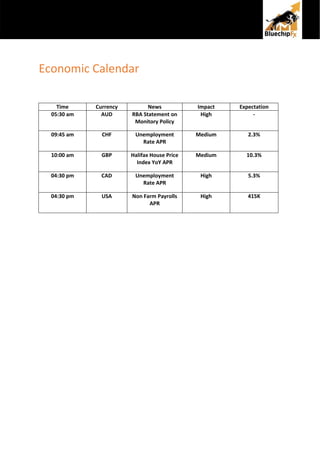
- 1. Economic Calendar Time Currency News Impact Expectation 05:30 am AUD RBA Statement on Monitory Policy High - 09:45 am CHF Unemployment Rate APR Medium 2.3% 10:00 am GBP Halifax House Price Index YoY APR Medium 10.3% 04:30 pm CAD Unemployment Rate APR High 5.3% 04:30 pm USA Non Farm Payrolls APR High 415K
- 2. AUD/USD TREND: Bearish Technical Outlook: AUD/USD keeps on falling from the past few weeks, but heavy volume buying seen on Wednesday. In the previous session, the pair revisit fresh multi-week low near 0.7078. Break below 0.7075 will confirm more selling opportunities. Indicators Daily chart Status RSI 39.24 Bearish STOCHASTIC 17.70 Bearish MACD Below midline Bearish 200 EMA 0.7313 Bearish Outlook Bearish Strategy Action Entry Target 1 Target 2 Stop Loss Sell 0.7115 0.7085 0.7055 0.7145
- 3. NZD/USD TREND: Bearish Technical Outlook: On daily chart, NZD/USD extend its bearish momentum in the initial trading session. The pair gathered the selling spiral to smash the spot to south. It made a low below 0.6400 in the last session, and currently sustaining near the same levels. Indicators Daily chart Status RSI 30.11 Bearish STOCHASTIC 7.24 Bearish MACD Below midline Bearish 200 EMA 0.6845 Bearish Outlook Bearish Strategy Action Entry Target 1 Target 2 Stop Loss Sell 0.6425 0.6395 0.6365 0.6455
- 4. EUR/USD TREND: Bearish Technical Outlook: EUR/USD starts the day on a flat note and consolidating. The major trend is bearish, but the pair trying to sustain above $1.0490 that act as a robust support level. Falling below the mentioned levels may push the spot to $1.0430. Indicators Daily chart Status RSI 33.98 Bearish STOCHASTIC 13.30 Bearish MACD Below mid line Bearish 200 EMA 1.1278 Bearish Outlook Bearish Strategy Action Entry Target 1 Target 2 Stop Loss Sell 1.0530 1.0500 1.0470 1.0560 .
- 5. GBP/USD TREND: Bearish Technical Outlook: On the last trading day of the week, GBP/USD opens with a negative bias and poised to close the week on downside footing. During the week, it moves majorly in a range bound manner but ruins all accumulation on Thursday with heavy selling pressure. Indicators Daily chart Status RSI 28.68 Bearish STOCHASTIC 5.55 Bearish MACD Below midline Bearish 200 EMA 1.3349 Bearish Outlook Bearish Strategy Action Entry Target 1 Target 2 Stop Loss Sell 1.2370 1.2300 1.2270 1.2400
- 6. USD/JPY TREND: Bullish Technical Outlook: On daily chart, USD/JPY extends the previous day’s gains to trade near weekly high near $130.65. The pair forming a rising channel indicate bullish momentum making higher highs and higher lows indicating existing bullish biasness. Indicators Daily chart Status RSI 69.84 Bullish STOCHASTIC 85.60 Bullish MACD Above midline Bullish 200 EMA 117.04 Bullish Outlook Bullish Strategy Action Entry Target 1 Target 2 Stop Loss Buy 130.60 130.90 131.20 130.30
- 7. USD/CAD TREND: Bullish Technical Outlook: On short term chart, the pair exhibits volatility since the week begins. The drift is inclined towards buyer side but a bit correction in price action could be seen in USD/CAD to begin fresh upward swing. Indicators Daily chart Status RSI 59.71 Bullish STOCHASTIC 82.08 Bullish MACD Above midline Bullish 200 EMA 1.2652 Bullish Outlook Bullish Strategy Action Entry Target 1 Target 2 Stop Loss Buy 1.2840 1.2870 1.2900 1.2810
- 8. USD/CHF TREND: Bullish Technical Outlook: In today’s session, USD/CHF opens with a positive biasness, and is moving sideways around $0.9860. A minor pull back was experienced in previous trading session toward $0.9710. Investor could take interest in the spot for a long position. Indicators Daily chart Status RSI 79.65 Bullish STOCHASTIC 93.56 Bullish MACD Above midline Bullish 200 EMA 0.9285 Bullish Outlook Bullish Strategy Action Entry Target 1 Target 2 Stop Loss Buy 0.9865 0.9895 0.9925 0.9835
- 9. GOLD TREND: Neutral Technical Outlook: On the daily chart, the yellow metal switch on the day with a bearish sentiment and trading lower near $1875. Gold is obtaining support from 200-days exponential moving average, which is locking the price to move further down. One could expect recovery toward $1890 level. Indicators Daily chart Status RSI 38.89 Bearish STOCHASTIC 20.20 Bearish MACD Below midline Bearish 200 EMA $1,857.45 Bullish Outlook Neutral Strategy Action Entry Target 1 Target 2 Stop Loss Buy $1,870 $1,880 $1,890 $1,860