Chintamani Call Girls: 🍓 7737669865 🍓 High Profile Model Escorts | Bangalore ...
Daily Report-April 14.pdf
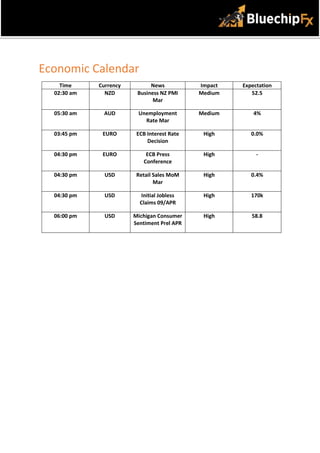
1. Economic Calendar
Time Currency News Impact Expectation
02:30 am NZD Business NZ PMI
Mar
Medium 52.5
05:30 am AUD Unemployment
Rate Mar
Medium 4%
03:45 pm EURO ECB Interest Rate
Decision
High 0.0%
04:30 pm EURO ECB Press
Conference
High -
04:30 pm USD Retail Sales MoM
Mar
High 0.4%
04:30 pm USD Initial Jobless
Claims 09/APR
High 170k
06:00 pm USD Michigan Consumer
Sentiment Prel APR
High 58.8
2. AUD/USD TREND: Neutral
Technical Outlook:
On the daily chart, AUD/USD trades in a very tight range with no clear directional bias. The buying
emerges near the lower levels making 0.7450 a reliable support level.
Indicators Daily chart Status
RSI 50 Bullish
STOCHASTIC 46 Bearish
MACD Above midline Bullish
200 EMA 0.7340 Bullish
Outlook Neutral
Strategy
Action Entry Target 1 Target 2 Stop Loss
Buy 0.7450 0.7480 0.7520 0.7420
3. NZD/USD TREND: Neutral
Technical Outlook:
NZD/USD trades above the 200-EMA (Exponential Moving Average) at 0.6817. However, now trades
near a resistance level, the buyers must breach the 0.6830 level on a 4-hour chart closing to instil
strong buying momentum.
Indicators Daily chart Status
RSI 44 Bearish
STOCHASTIC 8.0 Bearish
MACD Above midline Bullish
200 EMA 0.6875 Bullish
Outlook Neutral
Strategy
Action Entry Target 1 Target 2 Stop Loss
Buy 0.6825 0.6855 0.6885 0.6785
4. EUR/USD TREND: Bearish
Technical Outlook:
EUR/USD buyers firmly holds the 1.0850 support levels. As after days of consolidation, the price
shoot up nearly 70-pip in the previous session. Further carry forwarding the gains in today session.
Indicators Daily chart Status
RSI 43 Bearish
STOCHASTIC 27 Bearish
MACD Below mid line Bearish
200 EMA 1.1420 Bearish
Outlook Bearish
Strategy
Action Entry Target 1 Target 2 Stop Loss
Buy 1.0910 1.0940 1.0970 1.0880
.
5. GBP/USD TREND: Neutral
Technical Outlook:
Bullish RSI divergence on the daily chart pushed GBP/USD finally above the 1.3100 mark. Now, the
pair is trading firmly near 1.3150 with underlying bullish current.
Indicators Daily chart Status
RSI 49 Bearish
STOCHASTIC 76 Bullish
MACD Below midline Bearish
200 EMA 1.3470 Bearish
Outlook Neutral
Strategy
Action Entry Target 1 Target 2 Stop Loss
Sell 1.3005 1.2975 1.2945 1.3035
6. USD/JPY TREND: Bullish
Technical Outlook:
USD/JPY took a breather near 126.30 as can be seen with consecutive ‘Doji’ candlesticks on the daily
chart. However, trader must trade with strict stop loss.
Indicators Daily chart Status
RSI 74 Bullish
STOCHASTIC 78 Bullish
MACD Above midline Bullish
200 EMA 114.0 Bullish
Outlook Bullish
Strategy
Action Entry Target 1 Target 2 Stop Loss
Sell 125.50 125.20 124.90 125.80
7. USD/CAD TREND: Bearish
Technical Outlook:
USD/CAD bulls exhausted after tagging the highs near $1.2680. The pair lost nearly 70-pip in the
previous session indicating the impeding bearish momentum.
Indicators Daily chart Status
RSI 45 Bearish
STOCHASTIC 53 Bearish
MACD Below midline Bearish
200 EMA 1.2630 Bearish
Outlook Bearish
Strategy
Action Entry Target 1 Target 2 Stop Loss
Sell 1.2550 1.2520 1.2480 1.2580
8. USD/CHF TREND: Bullish
Technical Outlook:
The pair consolidates near 0.9370, as the bulls failed to carry forward the gains. Traders could wait
for some retracement to open further long positions.
Indicators Daily chart Status
RSI 53 Bullish
STOCHASTIC 70 Bullish
MACD Above midline Bullish
200 EMA 0.9225 Bullish
Outlook Bullish
Strategy
Action Entry Target 1 Target 2 Stop Loss
Buy 0.9320 0.9350 0.9380 0.9280
9. GOLD TREND: Bullish
Technical Outlook:
XAU/USD is hovering near the high level after continuous upward movement. The technical set up
indicates still the buy option is valid in the precious metal.
Indicators Daily chart Status
RSI 59 Bullish
STOCHASTIC 89 Bullish
MACD Above midline Bullish
200 EMA $1,831 Bullish
Outlook Neutral
Strategy
Action Entry Target 1 Target 2 Stop Loss
Buy $1,970 $1,980 $1,990 $1,960