
Recommandé
Recommandé
Contenu connexe
Tendances
Tendances (20)
En vedette
En vedette (14)
Similaire à NDEM Briefing
Similaire à NDEM Briefing (20)
NDEM Briefing
- 1. Brandon McNulty NDEM – Midterm Assignment Mario Otero Gimeno 21 October 2015 Faisal Kahn Oil Market Volatility Briefing Recent volatility within the global oil markets is not a new phenomenon. Oil prices have been historically volatile and difficult to forecast at a high degree of confidence due. This briefing addresses the primary relevant factors of inelasticity, global demand, global supply, and offers a current example of shocks to the market due to technological innovation. Explanation of these features and their current status suggest extended low prices in the near future but do not undermine volatility in the medium to long term. Inelasticity and Price Volatility: Oil is traded and priced on the global market. This price depends on global demand relative to global supply. Both demand and supply are extremely inelastic, or slow to respond to price changes. In the short-term demand’s elasticity is negligible and in the long-term it’s estimated to be -1.25, meaning a 1% decrease in price will increase demand by 1.25% (or a 1% increase in price will decrease demand by 1.25%). Therefore a major shock to either supply or demand creates an imbalance between the two that often requires an extreme price change to restore equilibrium between supply and demand. Oil Demand: Consumption has increased from 60 million barrels per day (mmbd) in 1980 to 92.45 million barrels per day (mmbd) in 2014 (with projections for 93.79 mmbd in 2015). By far the largest source of this consumption is transportation (64% as of 2012). Transportation is also the fastest growing source of consumption, primarily because of rapidly increasing access to personal vehicles in China and the developing world. Both the IEA and OPEC agree this will contribute significantly to China, India, and other developing countries driving global demand over the next 25. Their projections show global consumption rising to 111-119mmbd by 2040 with these key players accounting for 85-125% of that extra consumption while demand gradually decreases in OECD countries. This projection breaks down to an average annual consumption growth of 1% until 2040. Demand inelasticity dictates that any surplus or shortage of production will lead to extreme price drops or spikes respectively. Price volatility can be expected to continue unless supply grows at the same pace, which will largely depend on Saudi Arabia’s production strategy and any continuing technological innovations such as hydrofracturing. http://www.eia.gov/forecasts/steo/report/global_oil.cfm http://www.eia.gov/analysis/ http://www.eia.gov/todayinenergy/detail.cfm?id=17931 http://www.opec.org/opec_web/static_files_project/media/downloads/publications/WOO_2014.pdf http://www.indexmundi.com/energy.aspx?region=as&product=oil&graph=consumption Heal, Geoffrey and Eric Otto. Big boys’ games, big boys’ rules; Every producer for itself. CLSAUBluebooks. 10August 2015. Saudi Arabia’s role in oil supply: Saudi Arabia has traditionally been called the world’s oil “swing” producer due to being the sole nation to be able to vary global supply substantially enough
- 2. Brandon McNulty NDEM – Midterm Assignment Mario Otero Gimeno 21 October 2015 Faisal Kahn (between 0-7 million barrels a day) as to have a significant impact on prices. These changes in production output have enabled Saudi Arabia to take a leading role in stabilizing oil prices during periods of demand/supply shocks. Driven by an increase in US/Canadian shale oil supply together with and underwhelming demand of US crude imports, economic recession in China and Brazil and increased competition for market share in East Asia, oil prices dropped by half in the past nine months. Contrary to historic price-control strategy, Saudi Arabia has communicated that, in spite of the obvious negative effects on the kingdom’s finances, no supply cut that could level off prices is forthcoming. As opposed to many other oil exporting nations, this is a viable position for Saudi Arabia from an economic standpoint, at least temporarily. According to the Saudi Arabian Monetary Agency (SAMA), at the end of 2014 the Kingdom had net foreign assets of $724.26bn, the depletion of which would allow it to run present annual fiscal deficits of $146bn for almost another four years. Moreover, it could tap instead the domestic money markets, because Saudi Arabia’s national debt at the end of 2014 stood at $11.8bn, a miniscule 1.9% of GDP on a yearly average basis. For example, even if Saudi Arabia kept on borrowing $65bn each year from 2015 all the way out to 2020, its average outstanding debt in that year would still amount to only 43% of Saudi nominal GDP. The reasons that have taken the Persian Gulf nation to undertake such a policy are diverse. On the one side experts argue the kingdom is in a long-term bid for market share designed to force US shale production offline as well as high-cost Canadian oil sands and Brazilian deep-water production. On the other, it could be aiming to punish Russian and Iranian economics by crushing oil prices and delaying the latter’s production scale-up post-sanction lifting by discouraging international investment. The threat of a more widespread use of electrically powered modes of transport is also seen as a big threat for the Saudi economy, reliant heavily on oil export revenues (88% of its GDP). Low oil prices render many of these new technologies unprofitable or not competitive and could delay its growth substantially in the coming years. If this is the case, we could be facing long-lasting low oil prices. However, there is the widespread thought that its main intention is to restore discipline within the OPEC and restore the country’s own relevance as the “central banker’ of the global oil community. At current price levels and declining market, production cuts are the key to avoid fiscal insolvency, and it is in this scenario where Saudi Arabia is indispensable to its fellow cartel members. Therefore, the reluctance to cut back oil supply could be a measure to force members like Iran and Iraq to comply with OPEC production quotas and get the reins back on market share control. If this plan succeeds we could see prices rebounding in the coming months to levels of $80/bbl. How long can SaudiArabia sustain low oil prices? By Mckinsey & Company https://www.mckinseyenergyinsights.com/insights/saudi-arabia-and-low-oil-prices.aspx Here’s Why SaudiArabia Has Let Oil Prices Fall—and Why They Could Revive by Year’s End.By Atlantic Council http://www.atlanticcouncil.org/blogs/new-atlanticist/heres-why-saudi-arabia-has-let-oil-prices-fall-and-why- they-could-revive-by-years-end
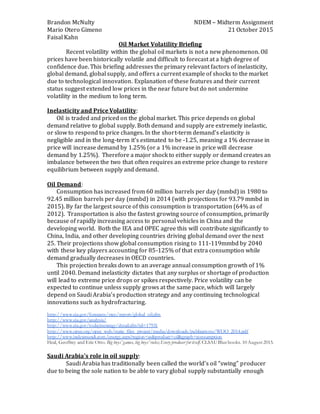
- 3. Brandon McNulty NDEM – Midterm Assignment Mario Otero Gimeno 21 October 2015 Faisal Kahn US Shale: The viability and rapid growth in US shale has done more than introduce a new source of oil supply—instead it has fundamentally changed many of the factors that drive oil price volatility. US oil production, thanks to new fracking technology, jumped from below 5 million bpd to peaking at almost 10 m bpd within a span of 6 years—pushing the rate of growth in global supply to much faster than the growth in demand.1 As a result of this oil production boom, global inventories began to swell and production managed to outgrow even refinery capacity. Nonetheless, production continued to grow in the US, even as oil prices fell in late 2014, as firms had to frack already drilled wells or tried to produce ahead of falling prices. Thus, the US shale boom changed another dynamic—whereas marginal production in the past was controlled through collusion by OPEC, now desperate frackers would drill at any price to stay in business, worsening the glut. Equilibrium could only be reached through a sufficiently harsh supercycle to drive these marginal producers out of the market, and indeed, analysts predict close to a third of these companies will go bankrupt in 2016.2 Furthermore, there is a lack of clarity into how the new sources of production will respond to low prices. US production has begun to fall, but there is 1 “US Production of Crude Oil.” EIA. Petroleum & Other Liquids. Accessed 20 October 2015. http://www.eia.gov/dnav/pet/hist/LeafHandler.ashx?n=pet&s=mcrfpus1&f=m 2 “Frackers could soon face mass extinction.” Forbes. 26 September 2016. http://fortune.com/2015/09/26/frackers-could-soon-face-mass-extinction/ 0 50000 100000 150000 200000 250000 300000 350000 Jan-2009 May-2009 Sep-2009 Jan-2010 May-2010 Sep-2010 Jan-2011 May-2011 Sep-2011 Jan-2012 May-2012 Sep-2012 Jan-2013 May-2013 Sep-2013 Jan-2014 May-2014 Sep-2014 Jan-2015 May-2015 US Production, Thousands of Barrels (Monthly)
- 4. Brandon McNulty NDEM – Midterm Assignment Mario Otero Gimeno 21 October 2015 Faisal Kahn uncertainty over how quickly these will decline given the complexity and lack of history in US shale production. As a result, small changes in the US rig count and weekly inventories have driven significant price volatility as markets try to predict how these forces will continue to interact. Small changes in supply/demand growth are sufficient to drive the market to either extreme. Furthermore, it remains to be seen how quickly US shale can get back to the pump—in the past, production growth took several years after a cutback, but it remains to be seen if these dynamics still apply to the US shale producers.