SlideShare une entreprise Scribd logo
1  sur  47
Télécharger pour lire hors ligne
1
Dr Bronwyn Kelly
Director Corporate & Technical Services
Waverley Council
LGMA IP&R Practitioners’ Network
July 2012
Integrated Planning & Reporting
Accessing the biggest benefits
Thank you for inviting me here today. I’m going to be talking about Integrated
Planning & Reporting from an experienced user’s point of view.
Waverley Council’s been doing Integrated Planning in one form or another since
2004 so we’ve made some good and bad decisions in using the framework that
we’ve been sharing with a number of councils over the past 2-3 years to help
them save time and money.
At the outset I’d like to say I originally wrote this paper for a group of students in
Local Government Management at UTS that were not as well versed in IP&R as
you all are. So it may contain things you already know well but I’m hoping it
will add something new to kick the discussion along.
2
Integrated Planning & Reporting
has been law in NSW since 2009
IP&R
As we all know, in 2009 both houses of the NSW Parliament unanimously voted
to make Integrated Planning & Reporting law for councils in NSW.
The legislation didn’t create much of a ripple in the world and its arrival wasn’t
heralded in the media.
Perhaps the unanimous passage of an obviously sensible but apparently dry
bureaucratic process reform didn’t strike much of a chord with the press as a
story warranting fanfare.
This is understandable. After all it’s just this funny little circle of planning and
reporting that on the face of it looks similar to any number of other funny little
circles for continuous improvement that public and private sector change agents
are seen to indulge in or impose on others from time to time.
3
If you’re out there at the coalface trying to keep up with the sisyphean task of
delivering services to a demanding, indeed insatiable, electorate, the little circle
might seem more like yet another big rock to push up that hill – more of a burden
than a help.
But looked at closely, and used properly, this particular reform should offer a
number of opportunities to help break the cycle of rock pushing – at least to the
extent that a few less of the rocks will roll back down again as they did every
time for Sisyphus.
If eternal rock pushing is your definition of hell, IP&R probably offers the best
opportunity we’ll get in the 25 year program of Destination 2036 to break that
cycle and achieve sustainable mircoeconomic reform within the local government
sector.
By using IP&R effectively Waverley Council secured a mandate from its
community in 2011 to double their rates over 7 years. So I can vouch for the fact
that IP&R has a number of big benefits. And I can assure you further that these
benefits apply for all councils, regardless of whether they need a rate rise or not.
But today I’m going to concentrate on what I think are the big 5 benefits and then
give just a few practical examples of how councils can access some of these
benefits.
4
Hands planning power directly to communities to set and control their future
Gives local government primacy of place in planning for community futures and
driving all levels of government towards those futures
Top down approach to planning is replaced by a bottom up approach to achieve a
vision at the lowest long run cost
IP&R – Big benefit #1
Community Strategic Plans are
meant to express the entirety of
the community’s aspirations, not
just those priorities a council may
be able to satisfy
1. IP&R’s first big benefit – and all the others hinge on this one – is that it hands
planning power for the first time directly to communities and councils,
giving them a chance to work together to set their future and then drive all
levels of government towards it.
• The peak plan in the framework – the Community Strategic Plan – is meant to
express the entirety of the community’s aspirations, not just those priorities
that a council may be able to satisfy.
• Because of this, IP&R allows us to capitalise on our natural advantage of
being the level of government closest to the community, take the lead, and
shape a community’s whole future. It gives local government primacy of
place not just in developing plans with the community, but in creating the
necessary partnerships between the various levels of government, the business
sector and the community itself to deliver on those plans, and to deliver them
at the lowest long run cost.
5
Increases our capacity to reform the
funding structure and financial security of
the local government sector
Quality IP&R:
will become the dominant means by
which we attract funding from other
levels of government
is already the means of securing
increases in rates income
IP&R – Big benefit #2
2. The second benefit is that IP&R has the capacity to totally reform the funding
structure and financial security for the local government sector.
• If we add a few tweaks from time to time and closely integrate our plans over
the next few years with the plans of other levels of government, particularly
those for infrastructure funding, land use planning and city planning, IP&R
will become the dominant means by which we attract funding from other
levels of government.
• It’s already the only means by which we can garner community support and a
mandate for increased investment in vital services and assets via rate rises. So
it’s central to our future as a financially sustainable industry.
6
Provides a mechanism to organise
investment in asset renewal without
having to cut services to fund that
renewal
IP&R – Big benefit #3
3. Thirdly, IP&R provides a mechanism to organise ongoing investment in
services and infrastructure sensibly, affordably and equitably.
• It does this by taking the focus off the short term and setting it squarely on
prioritisation of investment according to community targets that have been
agreed in advance through genuine engagement. As such it holds out the
possibility of gradually overcoming backlog infrastructure asset renewal bills
without having to cut services to fund that renewal.
7
Offers the possibility of major productivity
gains
Councils can:
raise the profile of their contribution to
QBL outcomes
test their comparative advantage in
service provision
improve their performance and
credibility in providing value for money
IP&R – Big benefit #4
4. And 4 – although I think, in the NSW model, this particular potential hasn’t
really been recognised yet – IP&R holds out the possibility of major
productivity gains for the local government sector.
• IP&R makes councils focus on strategies for achieving quadruple bottom line
results for:
• sustainable communities,
• sustainable lifestyles and economies,
• a sustainable environment, and
• sustainable governance.
• Because of this IP&R has the capacity to help councils raise the profile of
their contribution to valuable community outcomes and shape and promote
their comparative advantage as the most efficient level of government to
deliver those outcomes. So it’s the foundation for improving our performance,
and credibility, in providing value for money.
Do we want to attain credibility as the most efficient and productive level of
government? Well, IP&R, used well, might just give us the means to achieve
that.
8
The “R” in IP&R helps maintain quality
relationships with our communities
Helps us and our services to remain
relevant
IP&R – Big benefit #5
5. And 5 – The R in IP&R will have significant value in helping us maintain
quality relationships with our communities.
• The IP&R framework requires us to transparently show the extent of progress
towards or away from the vision and targets of the Community Strategic Plan.
Because of this it provides a basis for ongoing trust between councils and
their communities and the means of our staying relevant as service providers.
This is probably the biggest or most lasting benefit, particularly for
councillors. The R of IP&R should ideally keep them locked in step with
their communities, which in turn should maximise their chances of being re-
elected.
You never know – one day government might move beyond politics.
9
Benefit #1
Communities and
councils can plan a
sustainable future and
the partnerships
necessary to achieve it
Benefit #5
The community can
ensure services will be
the most relevant and
potent for achieving
their vision
Benefit #4
Councils can maximise
QBL outcomes and
productivity
Benefit #3
Councils can achieve
sustainable investment
in services and assets
Benefit #2
Councils can secure
finance for their
contribution to the
community’s future
IP&R
Benefits
Accessing all these benefits is of course going to be tricky and being realistic,
may take up to a decade.
Contrary to the less thoughtful tabloid opinion, most councils aren’t generally
flush with resources, especially rural councils. Some councils are quite well off
and secure of course. And some can quite deftly do quite a lot with very little. But
nevertheless there is a wide variability in both well resourced and not so well
resourced councils in their capacity to develop visionary Community Strategic
Plans, let alone the detailed long term Resourcing Strategies and mature
quadruple bottom line reporting envisaged by the Act.
Councils will need a lot of practical and financial assistance and collaboration if
the weight of the new planning rock is to be made lighter.
10
Action PlanAction Plan
In this regard, some of the best money that might be spent under the Destination
2036 Action Plan would be in Initiative 1 – for human resource development,
particularly if it focuses on developing holistic planning and community
engagement skills.
Some of the second best money would probably be spent on Initiative 10 – for
aligning state and local government planning frameworks. As I said before,
integration of the plans of different levels of government is going to become the
dominant means by which we attract funding from other levels of government. So
anything we can do in inter-governmental alignment plans is going to maximise
our share of national funds.
In the mean time, however, while we are waiting for Destination 2036 to really
get up some speed, we should concentrate on how we can access the considerable
benefits of IP&R at home.
The main things we can work on to get the biggest benefits as quickly as possible
are:
•community engagement,
•asset and financial planning, and
•end of term reporting.
I’ll start with community engagement.
11
Community engagement is the
enabling feature of great IP&R
The better the engagement the
bigger the benefits
Community Engagement
Quality community engagement is the great enabling feature of great IP&R.
It’s the biggest money saver because it will allow us to work out with our
communities how we can achieve the most at the lowest long run cost –
particularly in terms of asset renewal.
If we collect quality data from our communities in this engagement, it’s also
going to help us have the maximum influence on the plans of other levels of
government – which in turn will make them commit the sort of services and funds
that will enhance our communities’ desired QBL outcomes the most.
Ultimately this should, in theory, take the pressure off our sector, at least a little.
The pressure to constantly fill service gaps left by State and Federal Government
without having the necessary resources should drop.
We might even begin to reduce the effects of various types of cost shifts that tend
very much to run only one way at the moment, i.e., down to local councils.
The recent carbon price is a good example of a classic cost shift that in the past
we might not have had anywhere near the wherewithal to offset.
Pre-IP&R, we would have just had to absorb it and cut other things to fund it.
Post-IP&R, we have at least some chance of offsetting the cost shift, for both
councils and the community, by developing partnerships with the community to
ultimately obviate the need to pay the tax, namely by developing a low carbon
lifestyle.
Post IP&R, something like the carbon tax can do the work it’s designed to do
much more quickly and efficiently than it otherwise would.
12
12
View all our plans by clicking on this
link on the front page of our website
Community engagement and partnership building via IP&R is going to open up a
wide range of similar opportunities.
To give you an idea of some of those opportunities I’m going to use Waverley as
a case study.
Waverley Council’s been getting better, slowly, at community engagement.
We’re a Group 1 council for purposes of IP&R. We became compliant to a high
degree in 2010 after six years of planning and consultation.
You can view our plans by clicking on this link on the front page of our website.
That will take you to this tree of plans. Each of the little pictures in the tree is a
live link. If you click on them they will take you directly to the plans you want.
13
13
View all our plans by clicking on this
link on the front page of our website
Waverley started the IP&R thing pretty early because we could see we were
going to run out of money.
The threat of execution focuses the mind wonderfully, as Samuel Johnson would
say, so our plans are quite heavily detailed and explicit.
And you can see the influence of community engagement in their evolution,
especially in consultation about required service levels for assets.
Community engagement on these plans was conducted over a two year period in
two main stages.
You can view the results of the first stage in the report in the top circle and the
results of the second stage in the report in the bottom circle.
14
14
The first stage of consultation was to create the Community Strategic Plan which
for us is called Waverley Together 2.
The second was to secure funding for the council services necessary to help the
community meet the vision and targets of that plan.
15
Community strategic plan
15
$200 million
shortfall over
11 years
A funding shortfall
Long term financial plan
Two stages of consultation were necessary for Waverley because the first stage
had resulted in a Community Strategic Plan, an Asset Management Plan, an
Environmental Plan and a stark demand for services that, from our long term
financial planning, we knew we couldn’t fully fund.
There was a $200 million shortfall over 11 years for services required from
Waverley Council to help the community meet some of their targets in Waverley
Together 2.
Part of this shortfall – and I emphasise only part – was for backlog asset renewal.
The remainder was for services.
So we were facing the prospect of having to cut services because there wasn’t
enough money to keep them going, and then cut them even further to fund
backlog asset renewal.
Community engagement to develop integrated plans has got us out of that
problem at least for the moment.
Here’s the quick story on how that happened.
16
Waverley asset renewal estimates
16
2003/04 Annual Financial Statements – Schedule 7
Asset category Cost to bring to a
satisfactory condition
Cost to maintain at a
satisfactory standard
Roads $31,950,000 $2,555,000
Footpaths $12,950,000 $1,850,000
Kerbs & gutters $5,900,000 $1,180,000
Stormwater assets $37,200,000 $1,800,000
Buildings $5,235,000 $1,353,000
Total $93,235,000 $8,738,000
Waverley Council Asset Maintenance Costs Reported June 2004
The first thing we did was to use IP&R to get the asset backlog problem under
control as much as possible.
In 2004, as we saw it, this was our biggest problem.
In that year, well prior to implementing IP&R fully, Waverley Council was
reporting estimates of $93 million to bring just 5 categories of assets to a
satisfactory standard and $8.7 million a year thereafter to keep them there.
These estimates were being derived by using asset valuation and depreciation,
very much as we all do, albeit that we were admittedly not using these estimating
methods all that well.
$93 million is a big figure – at the time it was more than our annual income.
Obviously we couldn’t fund this so we were highly motivated to ask ourselves
whether the estimate was really correct.
As it turned out, mercifully – it wasn’t correct – nowhere near it.
17
Revised asset renewal estimates
17
2003/04
2010/11
Asset category Cost to bring to a
satisfactory condition
Cost to maintain at a
satisfactory standard
Roads $31,950,000 $2,555,000
Footpaths $12,950,000 $1,850,000
Kerbs & gutters $5,900,000 $1,180,000
Stormwater assets $37,200,000 $1,800,000
Buildings $5,235,000 $1,353,000
Total $93,235,000 $8,738,000
Waverley Council Asset Maintenance Costs Reported June 2004
Asset category Cost to bring to a
satisfactory condition
Cost to maintain at a
satisfactory standard
Roads $1,350,000 $1,350,000
Footpaths $1,757,000 $1,490,000
Kerbs & gutters $730,000 $730,000
Stormwater assets $3,503,000 $1,650,000
Buildings $5,207,000 $2,420,000
Total $12,547,000 $7,640,000
Waverley Council Asset Maintenance Costs Reported June 2011
Today Waverley Council is routinely reporting less than $15 million to bring
those same assets to a satisfactory standard and, depending on the year, between
about $5.5 and $7.5 million a year to keep them there.
Effectively we’ve wiped out the backlog for roads, footpaths, kerbs and gutters
and most of the drainage. We still have one shocker of an asset in the form a of
16 hectare cemetery that needs some major work to stop it sliding into the sea and
some buildings that need to be brought up to acceptable service levels. But by
and large the asset renewal program has been brought within our reach.
And we’ve got a community that’s willing to organise investment in its assets to
keep them in the shape they want at what we know is the lowest long run cost.
18
Reduced asset backlog
18
Reporting Year Cost to bring to a
satisfactory condition
Cost to maintain at a
satisfactory standard
Reported 2003/04 $93,235,000 $8,738,000
Reported 2010/11 $12,547,000 $7,640,000
Reduction 87% 13%
Waverley Council Change in Reported Asset Maintenance Costs
Overall since 2004 there’s been an 84% drop in the estimate for the backlog and,
depending on the year, a 12%-35% drop in expected ongoing annual maintenance
costs.
That drop was achieved by a combination of sensible engineering investigations
and ultimately by working with the community in a simple integrated
consultative and planning process to check that we’re taking an acceptable
approach to setting service levels and investment programs.
I’m short on time of course so I’m going to give you the potted version of the
Integrated Planning method for assets.
1919
Asset planning using IP&R
1. Look at the physical condition of the assets
Don’t use age as an indicator of condition
2. Use engineering expertise and knowledge of current asset condition,
set a “floor” for an expenditure program – a minimum necessary
expenditure to avoid risk and future cost increases
Test the “floor” with councillors and set rules to reduce risk
3. Engage with the community to test that the “floor” expenditure will
result in a total portfolio of assets that will deliver satisfactory service
19
It’s got 3 main features:
First, it looks at the actual physical condition of assets, instead of making
assumptions about their condition, or their remaining life, based on their age.
Second, it uses good old engineering know-how to set a floor for the minimum
expenditure necessary to achieve safe and least cost asset renewal cycles – and it
confirms this floor by consulting with councillors and getting them to take the
leadership they’re elected to take.
Third, it requires entry into dialogue with the community to see whether they’ll
insist on more than the floor expenditure.
That might sound like basic common sense, and it is. But I can say it wasn’t all
that easy to work out the consultation part of it. It certainly wasn’t easy to work
out a simple consultation program, as the engineering manuals tend to complicate
rather than simplify the language you can use for consulting on desired service
levels.
It also took a while to build up the courage to jettison a few assumptions inherent
in current thinking on asset economics.
20
… as most of our infrastructure was built in the 1950s
and 1960s it is now “nearing the end of its economic
life” …
Australian Infrastructure Financial Management Guidelines
IPWEA, 2009
20
That thinking is based on the assumption that economic life can be measured by
age and that once an asset has been in use for a certain number of years it can no
longer deliver acceptable service without being entirely replaced. The implication
of this is that if our infrastructure is say 60 to 70 years old it’s been fully
consumed and will need to be entirely replaced – and soon.
As a manager – neither an accountant nor an engineer – I’m not convinced that
this is correct, partly because “economic life” isn’t necessarily measured by age,
or even deterioration.
I, for instance, could be said to be an asset in “medium deterioration” (at least)
and I’m now drawing a pension for transfer to retirement so I’m on the wrong
side of middle age, but I might flatter myself that I have quite a deal more useful
life and value left in me than those years or that condition would imply.
And I think there’s cause for optimism that it’s the same for our infrastructure,
perhaps more so, because I can guarantee you that infrastructure assets respond
more readily to maintenance than biological assets.
At least I hope this is the case because the pessimistic views mean that only the
wealthiest councils will be able to afford to address asset backlogs without raising
rates well above CPI or cutting services, or both.
2121
Asset planning using IP&R
Question the concept that an asset needs to be completely re-built at
the end of its useful life
• Plan just-in-time maintenance programs to extend the life of the
assets for less money
Many assets may be in a lot better condition than their age will imply
21
If Waverley was to avoid having to triple or quadruple rates we had no alternative
but to question and ultimately move away from the concept that an asset needs to
be completely rebuilt at the end of a notional economic life. We had to move
away from loading the cost of that notional re-build into the life cycle cost
estimate and shift our emphasis to planning just-in-time maintenance programs
which would extend the life of the assets for less money.
In the first instance we had to spend a fair bit of money to save this money –
about $1 million in asset condition surveys for our mere 9.2 square kilometres of
land area. So big councils will need financial assistance to do this.
The good news though is that when you actually go out and look at the real
condition of an asset, our experience is that you’re likely to find that that assets
can be in a much better condition than their age would imply – especially from
the point of view of their capacity to provide satisfactory service. So it’s probably
going to be cheaper – perhaps much cheaper – to renew them than you think. Not
always but mostly, especially for city councils with well established asset bases.
If we understand the actual condition of assets we can lengthen or shorten
renewal intervals until we get the lowest long run renewal cost.
We can, in some cases, lengthen the renewal interval indefinitely.
For a lot of assets, good maintenance based on up to date knowledge of condition
can displace full reconstruction to some considerable extent.
We’re adhering to the old engineer’s mantra – give a well-built road a tight roof
and a dry floor and it can last.
22
22
The Appian Way, Rome - 2300 years old, brilliantly
engineered, and still going strong
The Romans have proved this.
That’s the Appian Way in Rome.
It’s a magic piece of engineering, 2,300 years old and still going strong.
It’s a layered construction with a brilliant drainage system. It’s said that the
stones in the top layer all fit together so perfectly that a knife can’t be wedged in
between them.
Its longevity is secured by its dryness and as a result it’s still fit for purpose,
although the purpose has changed through time.
It’s transported centuries of people, goods and armies. Mussolini drove tanks on
it.
Now the service level required for the road seems thankfully to be mainly to
transport the sheep and to act as a remarkable monument to the ingenuity, sweat
and blood of millions of Romans, not to mention hundreds of crucified Spartans.
But it is indeed more than fit for its current purpose and the Romans have
certainly had their money’s worth.
23
Consulting using IP&R
23
As to using consultation to control the costs of asset renewal, Waverley took
advantage of the opportunity provided by the introduction of the Integrated
Planning reforms in 2009 to place the consultation about the need to maintain
assets in the wider context of conversations about demand:
•for community services,
•for management of the natural environment and
•for a strong local economy.
This helped us avoid a situation where people would drive up demand for better
assets leaving us with the problem of having to cut services to fund unnecessary
asset renewal.
24
Consulting on
the “floor”
using pictures
24
We consulted on:
− Roads, footpaths, kerbs &
gutters
− Buildings
− Trees and parks landscapes
We deliberately didn’t
consult on some assets:
− Drainage
− Retaining infrastructure
− Infrastructure in parks and
cemeteries
− No point in asking someone if
they mind a wall falling down or
being flooded
47%
32%
11%
10% 0%
Condition 1 - Good condition
Condition 2 - Minor deterioration
Condition 3 - Medium deterioration
Condition 4 - Major deterioration
Condition 5 - Unserviceable
We used pictures and maps to lift the community’s vision above the parochial
and self-centred. With that sort of clear information they made trade-offs to pull
the cost down to something more like what seemed the best value for money. And
luckily that seemed to be what the majority felt they could also afford.
In that process they realised that assets don’t need to be in top condition all the
time to deliver acceptable levels of service and that indeed having assets
reconstructed as new would be over-servicing. They also realised that it might
just be affordable to maintain both services and assets. In other words they won’t
have to trade one off to get the other if they just get the funds organised
efficiently and don’t delay overdue investment too much longer.
I don’t think it’s possible for me to make this completely clear or credible in a
few minutes but it may be encouraging for cash strapped councils to hear that
when you look at what an asset is valued for by the community, rather than what
it’s valued at by an accounting method, you get a different and generally lower
idea of the bill for maintaining it. And it is possible to motivate communities to
solve this problem.
People aren’t stupid. They know that an expenditure delayed is a bill increased
not just for their kids but for them too. They want long term planning, and when
you give them clear sensible information they give you clear sensible preferences
in return. And they gain confidence to invest a bit more than they otherwise
might.
25
25
HVRF Community Survey 2010
Is a rate rise of 120% over 7 years reasonable?
0% 10% 20% 30% 40% 50% 60%
Can't decide
Disagree or strongly
disagree it's reasonable
Agree or strongly agree
it's reasonable
HVRF Community Survey 2010
Is a rate rise of 120% over 7 years affordable for you?
0% 10% 20% 30% 40% 50% 60%
Can't decide
Disagree or strongly
disagree it's affordable
Agree or strongly agree
it's affordable
Waverley Council went out and asked the community if they would double their
rates over 7 years to pay for the QBL lifestyle they wanted. Actually we asked
them if they would increase them by 120%. A significant majority in a
statistically valid survey said yes. Depending on the magnitude of the rate rise,
for every 1 person against a rate rise after this integrated planning process, there
were 1.7 to 2.3 who were for it.
26
Community regard for Council rose steeply
50% of participants thought the better of Council after this process
Only 10% thought the worse of Council
Improvement in Community Perceptions of Waverley Council from the
"Funding the Future" Consultation Program and Service Plus
0% 10% 20% 30% 40% 50% 60%
Council's performance in long term planning
Council as a trusted partner
Importance of Council's role in delivering a better
lifestyle
Value for money of Council's services
Importance of services
% of community more negative about Council % of community more positive about Council
Improved confidence in us
But on top of that, in the process their view of the importance of Council’s
services and their confidence in Council itself as a trusted partner and planner
changed for the better.
You can see from this slide that 50% of our resident respondents in the
statistically valid survey (the people in the blue bars) thought the better of us on
several fronts – after they’d agreed, in the majority, to double their rates.
Only about 10% (the people in the red bars) thought the worse of Council.
The opinion of the rest remained unchanged.
27
Benefit #1
Communities and
councils can plan a
sustainable future and
the partnerships
necessary to achieve it
Benefit #5
The community can
ensure services will be
the most relevant and
potent for achieving
their vision
Benefit #4
Councils can maximise
QBL outcomes and
productivity
Benefit #3
Councils can achieve
sustainable investment
in services and assets
Benefit #2
Councils can secure
finance for their
contribution to the
community’s future
IP&R
Benefits
It took a very interactive engagement and survey process to achieve this result.
But I think it’s pretty clear why I’ve derived the view about benefit #4 of IP&R –
that being that IP&R is the foundation for improving our performance, and
credibility, in providing value for money.
Basically the lesson we learned is that if you provide sensible information in an
accessible format, people will act rationally, even generously, and you will
narrow down the error margin in long term financial planning.
Self interest and the common interest are more likely to begin to merge for
participants in this interactive sort of process.
But even if they don’t merge, when it comes to something like local government
infrastructure, if you use a method which excludes community engagement
you’re more likely than not to end up trying to put aside money that you might
not need at all.
Which brings me to the point about how the sector as a whole might begin to
make some serious inroads towards accessing benefit #2 of IP&R – financial
security for the sector.
2828
Accessing benefit #2
A hypothesis:
Published estimates of backlog infrastructure renewal:
$4.2 billion to $6.3 billion in NSW alone (100 largest councils only) - Fiscal
Star
$14.5 billion nationally - Price Waterhouse Coopers
Let’s assume these estimates are over-stated
Let’s also assume that there’s enough funds in total in the sector to deal
with asset backlogs without cutting services, but that access to the funds
is poorly distributed
28
$ security
Here’s a hypothesis about accessing benefit #2:
Let’s assume that the local government sector’s liability for assets is probably not
as big as the big end of town accounting firms have been suggesting.
It’s possibly less than the published estimates of $4 to $6 billion in NSW or $14.5
billion nationally.
And further, let’s assume we are a relatively wealthy country and that the
industry as a whole has access to enough sources of funds in total to deal with the
infrastructure issue at the reduced estimate, but that access to the funds is
poorly distributed. Some have enough and can access more when they need it,
and some can’t.
2929
Accessing benefit #2
A proposition:
Can we re-distribute access to funds to achieve long term asset and
service sustainability, without having to sacrifice services for assets, or
assets for services?
In other words can we achieve QBL sustainability?
29
We can match that hypothesis with a proposition:
And that proposition is that if we can re-distribute the access to total funding
somehow, we may be able to achieve long term asset and service sustainability
within available funding and without having to sacrifice services for assets, or
assets for services.
In other words we may actually be able to achieve QBL sustainability.
3030
Accessing benefit #2
Currently funds are locked up in artificial ways:
Metro councils have access to rates, grants, user charges, contributions,
etc due to large populations
Rural councils at the other extreme have limited populations and are
dependent in the main on grants
If we can achieve a standard of IP&R that more accurately funds real
liabilities and service necessities in the city, can we free up some funds for
regional areas to catch up more quickly with asset renewal and creation?
30
At the moment, funds are locked up in odd ways by virtue of the history of
council boundaries, population and land use distribution. The metropolitan areas
are probably corralling funds including rates, grants, fees, charges and
contributions, that, at least in terms of total asset liability, the metro region
doesn’t need or if they do need it they can raise by other means due to their larger
markets and populations – just like Waverley’s done in getting a big rate rise and
setting up a parking system and buying and selling big property.
I’m sure if you’re a city council you’ll have noticed the federal grant cake is
getting smaller in total and you’re getting less of this smaller cake as the federal
government has been re-directing funding to the regions and rural areas – where
for the moment, in my humble opinion, it should be going anyway. These are the
areas where they probably do have daunting asset backlogs and insufficient
population to overcome their asset problems.
In that context:
•if city councils can all use IP&R to tap efficiently and fairly into available funds
and prepare long term financial plans that accurately reflect their real liabilities –
not the sort of liabilities for instance which are calculated by assuming long lived
assets need to be fully replaced after a mid life crisis at age 50 – but the real
liabilities; and
•if those city councils can also consult with their communities to optimise
investment in the most efficient assets slowly over the next decade;
then it might free up more of the limited federal grant funds for diversion to the
rural and regional areas.
Councils in those remote areas might be able to break out of the sisyphean cycle
they’ve been consigned to without having even sinned.
3131
Accessing benefit #2
Funding replacement of short-lived assets with long-lived assets has a lower
long run cost 31
They might be able to stop for instance putting in roads that simply replace a
short-lived asset with yet another short-lived asset that will fail in the next big
storm.
If we jettison that rather silly, in fact sinfully wasteful, system we have at the
moment of giving councils grants for roads and then, by the terms of the grant,
restricting them to replacing like with like, we might be able to get some decent
proper roads into regions and markedly increase national GDP as a result.
Farm produce won’t be held up for weeks after a flood. And kids in rural areas
won’t have missed a year of school by the time they’re 12 – which actually
happens in some areas now.
10-15 years of concentrated cooperative effort should be enough to achieve
replacement of short-lived roads with some decent road and drainage assets that
can be maintained for a fraction of the cost of the current ones.
3232
Accessing benefit #2
Exchange this …
for this…
32
This is a major productivity contribution that the local government sector can
make for itself and the country, simply by re-organising access to funding for a
temporary period of about a decade.
Of course achieving it without creating too many adverse effects in the cities will
be tricky. But guided by good IP&R we can probably do it.
And if that is complimented by some thoughtful fine-tuning of policy in creating
better access to funding for areas of the city where they probably do have
financial challenges – namely councils on the metropolitan fringe that are
struggling to provide services for new development while developer contributions
have been capped – then we should be able to organise the money to ensure the
most efficient investments are made in the cities.
At the moment the policy debate is developing on this issue with, for example,
suggestions from IPART recently that inner city councils might be levied with a
special levy to support metropolitan fringe councils who are struggling to provide
infrastructure and services to new developments with $30,000 cap per block.
I’m not sure myself that hitting up people in the central metro areas to fund
expensive development on the fringe is quite the way to establish economically
efficient investment decisions. I would have thought we should be developing
accessible sources of funds that will encourage developers to consolidate more
within already developed areas, rather than develop blocks in fringe areas with
high marginal costs. And we should be revising the rate capping system to ensure
access to tax income is appropriately distributed.
The right economic answer is still to come.
33
Benefit #1
Communities and
councils can plan a
sustainable future and
the partnerships
necessary to achieve it
Benefit #5
The community can
ensure services will be
the most relevant and
potent for achieving
their vision
Benefit #4
Councils can maximise
QBL outcomes and
productivity
Benefit #3
Councils can achieve
sustainable investment
in services and assets
Benefit #2
Councils can secure
finance for their
contribution to the
community’s future
IP&R
Benefits
In the meantime, successive cycles of IP&R with four year revisions to develop
new and better Community Strategic Plans might gradually work out some of the
policy bugs.
The quality of future CSPs will depend very heavily on the quality of the “R” in
our IP&R. Accessing big benefit #5 – quality relationships and trust with our
communities – will be critical if we’re going to be able to get them to continue to
invest with us in efficient equitable patterns.
Quality reporting is the means of securing that benefit.
3434
34
Did life get better?
and
Was it something we did?
The “R” of IP&R
For quality End of Term Reporting:
We need to set up meaningful community targets with good baseline data in our
Community Strategic Plans so that at the end of every term of an elected council
we can answer the questions:
•Did life get better?, and
•Was it something that we did?
3535
35
If life got better, which strategies helped most?
and
If it got worse, what else might we try?
The “R” of IP&R
And if it got better, which strategies helped the most?
If it got worse, what else might we try?
The outgoing council needs to pass the learning from this to the incoming council
with suggestions about where to try new partnerships and which policies need to
be changed or services improved by all levels of government, not just the council.
3636
End of term reporting
Waverley Together 2 is set up with 60 targets and
indicators for reporting on how life has changed
Baseline data are already established for every
target and indicator, so the community can see
where we were back when the plan was adopted
We’re able to measure the difference
quantitatively between the 2009/10 baseline and
2012 (if there is any difference over such a short
period)
36 We’ve drawn a baseline in the sand at 2009/10
Answering these questions will mean that our CSPs need to be set up in a certain
way.
If you’re looking for some guidance on that, Waverley Together 2 and the End of
Term Report on it might be helpful.
Waverley Together 2 is set up with 60 targets and indicators for reporting on how
the community’s life has changed in the term of office of the council.
That’s their whole of life including whether they have moved towards or away
from their vision for a sustainable community, a sustainable lifestyle and
economy, a sustainable environment and sustainable governance.
Baseline data are already established and published in Waverley Together 2 for
every target and indicator, so the community can see where we were back when
the plan was adopted.
In the End of Term Report we’re now able to measure the difference
quantitatively between the 2009/10 baseline and 2012 (if there is any discernible
difference over such a short period).
3737
Reporting framework
60 targets and indicators
51 are measuring Community
outcomes
9 are measuring Council
outputs (all in governance)
37
Of the 60 targets and indicators, 51 are measuring Community outcomes and 9
are measuring Council outputs.
3838
Measuring progress
The targets and indicators in Waverley Together 2
can be measured in one of two ways:
Either as an objective change in a physical target
or as a change in consensus about a subjective
indicator of quality of life
Taken together the objective and subjective
measures give an “indication” of QBL progress
They’re our community indicators
38
Example of a “target”
30% reduction of
[community] greenhouse
gas emissions by 2020
based on 2003/04 levels
Example of an “indicator”
The proportion of
residents who agree
there is a sense of
community in Waverley
The targets and indicators can be measured in one of two ways:
either as an objective change in a physical target – like greenhouse gas
emissions,
or as a change in consensus about a subjective indicator of quality of life- like
perceptions of sense of community.
Taken together the objective and subjective measures give an “indication” of the
direction and quantum of QBL progress.
3939
The first report
The first end of term report will
show movement forwards or
backwards from the 2010
baseline point of all 60 targets
and indicators
It will show relative proportional
movement away from the line
drawn in the sand in 2009/10
39
2010 right direction wrong direction
The first End of Term Report shows movement forwards or backwards from the
2009/10 baseline point of all 60 targets and indicators.
And it shows relative proportional movement away from the line drawn in the
sand in 2009/10.
4040
The first report
Results will also help councillors provide advice
to the next council on any of Council’s services
that require review
This is possible because the connection
between Council’s services and the targets of
the CSP has been fully mapped
40
Contribution of Council services to the
directions of the CSP is mapped in the
workforce plan
As I said before, the results will help councillors provide advice to the next
council on any of Council’s services that require review.
This is possible because the connection between Council’s services and the
targets and vision of the CSP has been mapped out in the Workforce Plan.
41
41
Council’s
deliverables
Community
outcomes
Service Plus 22 main service categories comprising 150 sub-
services contribute directly to efficient
implementation of …
Directions/Strategies the 33 Directions/Strategies in Waverley
Together 2 to assist the community to meet …
Targets 60 Targets/Indicators for quadruple bottom line
sustainability that, if met, will …
Vision enable the community to realise all 14 Vision
elements of Waverley by 2022.
How do Council’s services help make the Vision
of Waverley Together 2 a reality?
Our service package, called Service Plus, has 22 main services, which contribute
directly to the implementation of 33 directions and strategies to assist the
community to meet 60 targets for QBL sustainability that, if met, should enable
the community to realise all 14 elements of their vision for a better quality of life
in Waverley by 2022.
4242
42
2010
right direction wrong direction
Waverley Together 2
Movement towards or away from a sustainable environment
19%
-5%
14%
5%
-53%
-1%
-3%
-3%
-14%
4%
36%
3%
-11%
-100% -50% 0% 50% 100%
50. Satisfaction with Council's environmental management
and education is increasing.
49. Our community rates the environment as an important
issue.
43. The proportion of residents who rate the water quality
in beaches and waterways as clean is steady or
increasing.
42. More than 345 clean beach days per annum (>95%)
based on DECCW Beachwatch Water Quality Results.
40. 50% reduction in Council’s mains water consumption
by 2020 based on 2005/06 levels.
39. Zero increase in the LGA’s mains water consumption
by 2020 based on 2005/06 levels.
38. 75% of the LGA’s domestic and commercial waste is
diverted from landfill by 2020.
37. No net increase in overall waste generation by 2020
based on 2007/08 levels.
36.40% of the total daily distance travelled by residents is
by public transport, walking or cycling.
35. The average kilometres travelled by Waverley residents
per day by private car declines by 15% by 2020 based on
kilometres travelled in 2006.
34. 30% of electricity used in the LGA comes from
renewable sources by 2020 (solar power kWs generation
capacity by community - baseline Jan 2011).
33. 30% reduction in Council’s greenhouse gas emissions
by 2020 based on 2003/04 levels.
31. 30% reduction in the Waverley community's
greenhouse gas emissions by 2020 based on 2003/04
levels.
% movement towards (green) or away (red) from targets for a sustainable community
The service / direction/ target / vision map enables us to tease out not only if life
got better but in what way.
For instance in terms of a sustainable environment – have we moved in the right
or wrong direction?
Well it’s line ball there I think, which is not too great.
4343
43
2010
right direction wrong direction
Waverley Together 2
Movement towards or away from sustainable living
18%
8%
12%
15%
-50%
-1%
17%
-2%
19%
40%
15%
27%
11%
2%
14%
-100% -50% 0% 50% 100%
30. Satisfaction with on-street parking management is
steady or increasing.
29. Proportion of residents who think that public
transport is adequate for their needs is increasing.
28. Proportion of residents who view Waverley as a safe
area for cyclists is increasing.
27. Proportion of residents who view Waverley as a
safe area for pedestrians is steady or increasing.
26. 4-wheel drive vehicles registered in Waverley declines
by 5% by 2020 based on 2007 numbers.
25. The number of private passenger vehicles (cars)
registered in Waverley is stabilised by 2020 at 2007 levels.
24. Satisfaction with local traffic management is
increasing.
23. The number of vehicle accidents and pedestrian
accidents per annum is equal to or less than the number in
2005 (2010 data).
22. Satisfaction with Council's building development,
planning and controls is increasing.
21. The proportion of residents who think that graffiti is
adequately controlled is steady or increasing.
20. The proportion of residents who think that litter is
adequately controlled is steady or increasing.
19. Satisfaction with the removal of dumped rubbish is
increasing.
18. Satisfaction with the look of public places is steady
or increasing.
17. The level of business activity in each of our commercial
centres and villages is minimum of 85% (average
occupancy of commercial premises since base year).
16. The level of unemployment in our area remains low.
% movement towards (green) or away (red) from targets for a sustainable community
Or in terms of a sustainable lifestyle and economy.
You can see that the news is pretty good and this quadrant is mostly moving in
the right direction except for all those Waverley residents buying rather large
numbers of 4WD cars. We don’t know what that’s about but it’s certainly not
conducive to sustainable transport.
4444
44
Vision has 14 elements
Mapping the path of the
services towards the vision is
complex but worth the
exercise
Helps ensure the plan is as
powerful as possible
Ultimately we can get a view of whether we have moved towards or away from
the vision which for Waverley is quite detailed compared to your average vision
statement but which really helps us map progress to the QBL – like so.
4545
45
 wrong direction right direction
2010
Have we moved closer to or further away from the vision of
Waverley Together 2 ?
-40% -20% 0% 20% 40% 60% 80%
We are confident our leaders will reflect thoughtfully on our views and best
interests when making decisions for our future
As a local community we have the courage to take a leading place in
achieving the environmental aims of a global society
Local economic prosperity provides opportunity for all
Scarce resources are conserved and fairly shared
Vital services are fully accessible
The architectural landscape is cared for and developed at a human scale,
and design is sensitive to the natural, historical and social contexts
The beauty of our beaches, cliffs and coastal lands endures
We act together as a compassionate society
We can express our essential selves through our traditions, our arts, our
cultures, and our lifestyles
Everyone is welcomed to participate positively in community life
We are inspired and able to renew our physical and spiritual wellbeing
Connections within families and between generations can remain unbroken
We are reconciled with and value our indigenous past
We are safe
% of community who feel we have moved further away from the vision % of community who feel we have moved closer to the vision
You can see from these results that the community view at least is that we have
on balance moved towards the vision (in green) rather than away from it (in red).
Although once we added in the physical data on the environment, economy, and
governance it became pretty clear that perception didn’t really align with reality.
4646
46
VisionVisionVisionVision
Perception of
progress towards
the vision
Progress taking into
account perception
and physical
measures
We are safe
We are reconciled with and value our indigenous past
Connections within families and between generations can remain unbroken
Everyone, from near and far, is welcomed to participate positively in community life
We are inspired and able to renew our physical and spiritual wellbeing
We can express our essential selves through our traditions, our arts, our cultures, and
our lifestyles
We act together as a compassionate society
The beauty of our beaches, cliffs and coastal lands endures
The architectural landscape is cared for and developed at a human scale and design is
sensitive to the natural and historical context  
Vital services are fully accessible
Scarce resources are conserved and fairly shared 
Local economic prosperity provides opportunity for all  
As a local community we have the courage to take a leading place in achieving the
environmental aims of a global society 
We are confident our leaders will reflect thoughtfully on our views and best interests
when making decisions for our future  
Perceived and actual progressPerceived and actual progressPerceived and actual progressPerceived and actual progress
Waverley Together 2 VisionWaverley Together 2 VisionWaverley Together 2 VisionWaverley Together 2 Vision
Actual
progress
The community is of the view that the main areas to work on are:
the architectural landscape – which is about living with the good and bad of
urban density
economic sustainability, and
the community’s confidence in whether our leaders will reflect thoughtfully on
their views and best interests when making decisions for their future.
But the full data strongly suggest that the economy is rosier than they feel and the
environment is worse than they feel, and we’re not the resource conservationists
we think we are.
Still, the common feature of the areas of concern is that it will take increased
investment and partnership by all levels of government, business and the
community, not just change by Council, to fix it.
So we have a powerful instrument here to influence the plans of other levels of
government, which gets us a bit further advanced towards all the big benefits,
particularly big benefit #5 – staying relevant. Or, if you’re a councillor, getting
re-elected.
4747
47
IP&R – the means of changing the face of local government so that we match
the vision for the industry by 2036
The extent to which we can access these benefits is limited by a range of things.
But implementation of the IP&R framework probably has more potential than
most other actions in Destination 2036 to change the face of the industry so that
we match the vision for local government by 2036.
If you read through the Destination 2036 Action Plan it actually doesn’t mention
IP&R much. It’s as though the authors thought “well we’ve already done that one
so there’s not too much need to go into it further here”, which is of course true.
But if Destination 2036 is about remaking our sector so that we can achieve
strong sustainable communities, then the means by which we plan the actual
futures of those communities has to be central and if not overarching.
IP&R should become an embedded skill in Local Government in the next decade
and if we succeed in that I would argue that IP&R will extend the benefits of any
reforms of the sector, like those coming from the Local Government Review
Panel, long after they have been implemented.
IP&R is the means of implementing much of the Destination 2036 Action Plan
and is bound to be more effective and lasting than say structural reforms, many of
which have limited utility if they’re not matched by process improvement –
namely continuous improvement in holistic planning and integration with other
levels of government.
I hope you all have fun using it in the next decade and get as much out of it as
you can for your community.
Thanks for listening.

Contenu connexe

Tendances (13)

Investing in Shared Lives
Investing in Shared LivesInvesting in Shared Lives
Investing in Shared Lives
 
How to target your Discretionary Housing Payments well
How to target your Discretionary Housing Payments wellHow to target your Discretionary Housing Payments well
How to target your Discretionary Housing Payments well
 
Mv unconvention
Mv unconventionMv unconvention
Mv unconvention
 
Budget Committee Presentation
Budget Committee PresentationBudget Committee Presentation
Budget Committee Presentation
 
BIDP FE FINAL REPORT 1_July 11
BIDP FE FINAL REPORT 1_July 11BIDP FE FINAL REPORT 1_July 11
BIDP FE FINAL REPORT 1_July 11
 
Final full PDF
Final full PDFFinal full PDF
Final full PDF
 
Forum towards a new strategy 28 march 2013 2
Forum towards a new strategy 28 march 2013 2Forum towards a new strategy 28 march 2013 2
Forum towards a new strategy 28 march 2013 2
 
Investment Opportunities in Social Housing
Investment Opportunities in Social HousingInvestment Opportunities in Social Housing
Investment Opportunities in Social Housing
 
State school aid overview 2019 draft
State school aid overview  2019 draftState school aid overview  2019 draft
State school aid overview 2019 draft
 
Welfare reforms and reducing rent arrears
Welfare reforms and reducing rent arrears Welfare reforms and reducing rent arrears
Welfare reforms and reducing rent arrears
 
Sustainability Initiative
Sustainability InitiativeSustainability Initiative
Sustainability Initiative
 
Dcc Neighbourhood Strategy Eng%5 B1%5 D
Dcc Neighbourhood Strategy Eng%5 B1%5 DDcc Neighbourhood Strategy Eng%5 B1%5 D
Dcc Neighbourhood Strategy Eng%5 B1%5 D
 
Expiry of operating agreements may 2015
Expiry of operating agreements  may 2015Expiry of operating agreements  may 2015
Expiry of operating agreements may 2015
 

Similaire à Pres195-IP&RforIndustryReform-IPRConferencePortStephens-a-Notes

Total place report
Total place reportTotal place report
Total place report30088
 
UDIA WA Policy Priorities 2019
UDIA WA Policy Priorities 2019UDIA WA Policy Priorities 2019
UDIA WA Policy Priorities 2019Gemma Osiejak
 
Long Term Integrated Community Facilities Plan 2015
Long Term Integrated Community Facilities Plan 2015Long Term Integrated Community Facilities Plan 2015
Long Term Integrated Community Facilities Plan 2015Council2016
 
Localis Facing the future
Localis Facing the futureLocalis Facing the future
Localis Facing the futureBarry Maginn
 
A partnership framework for coordinating resources in Kenya April 2014
A partnership framework for coordinating resources in Kenya April 2014A partnership framework for coordinating resources in Kenya April 2014
A partnership framework for coordinating resources in Kenya April 2014irunguh
 
Modernising Commissioning Green Paper - ecdp response (Dec 2010)
Modernising Commissioning Green Paper - ecdp response (Dec 2010)Modernising Commissioning Green Paper - ecdp response (Dec 2010)
Modernising Commissioning Green Paper - ecdp response (Dec 2010)Rich Watts
 
Annual plan 2016 2017
Annual plan 2016 2017Annual plan 2016 2017
Annual plan 2016 2017Council2016
 
Realising Social Value within Facilities Management
Realising Social Value within Facilities ManagementRealising Social Value within Facilities Management
Realising Social Value within Facilities ManagementSunil Shah
 
A-Shareholders-Guide-to-Rural-Services
A-Shareholders-Guide-to-Rural-ServicesA-Shareholders-Guide-to-Rural-Services
A-Shareholders-Guide-to-Rural-ServicesKirsty Tait
 
Rob Whiteman, LG Group - challenges under the coalition government
Rob Whiteman, LG Group - challenges under the coalition governmentRob Whiteman, LG Group - challenges under the coalition government
Rob Whiteman, LG Group - challenges under the coalition governmentSocitm
 
conference presentation
conference presentationconference presentation
conference presentationPeter McKinlay
 
New microsoft office word document
New microsoft office word documentNew microsoft office word document
New microsoft office word documentDevi Behera
 
Plan 2040 Online Public Meeting 2
Plan 2040 Online Public Meeting 2Plan 2040 Online Public Meeting 2
Plan 2040 Online Public Meeting 2ARC
 
Localis Total Neighbourhood
Localis Total NeighbourhoodLocalis Total Neighbourhood
Localis Total NeighbourhoodBarry Maginn
 
Salga chair speaking notes ndp conference stellenbosch
Salga chair speaking notes  ndp conference stellenboschSalga chair speaking notes  ndp conference stellenbosch
Salga chair speaking notes ndp conference stellenboschmeagz24
 
Serco Incentives Report Final
Serco Incentives Report FinalSerco Incentives Report Final
Serco Incentives Report FinalRobin Davies
 
Discuss in 2-3 pages the benefits of preparing a multi-year capital .pdf
Discuss in 2-3 pages the benefits of preparing a multi-year capital .pdfDiscuss in 2-3 pages the benefits of preparing a multi-year capital .pdf
Discuss in 2-3 pages the benefits of preparing a multi-year capital .pdfinfoeyecare
 

Similaire à Pres195-IP&RforIndustryReform-IPRConferencePortStephens-a-Notes (20)

Total place report
Total place reportTotal place report
Total place report
 
UDIA WA Policy Priorities 2019
UDIA WA Policy Priorities 2019UDIA WA Policy Priorities 2019
UDIA WA Policy Priorities 2019
 
Long Term Integrated Community Facilities Plan 2015
Long Term Integrated Community Facilities Plan 2015Long Term Integrated Community Facilities Plan 2015
Long Term Integrated Community Facilities Plan 2015
 
Localis Facing the future
Localis Facing the futureLocalis Facing the future
Localis Facing the future
 
A partnership framework for coordinating resources in Kenya April 2014
A partnership framework for coordinating resources in Kenya April 2014A partnership framework for coordinating resources in Kenya April 2014
A partnership framework for coordinating resources in Kenya April 2014
 
Modernising Commissioning Green Paper - ecdp response (Dec 2010)
Modernising Commissioning Green Paper - ecdp response (Dec 2010)Modernising Commissioning Green Paper - ecdp response (Dec 2010)
Modernising Commissioning Green Paper - ecdp response (Dec 2010)
 
Annual plan 2016 2017
Annual plan 2016 2017Annual plan 2016 2017
Annual plan 2016 2017
 
Realising Social Value within Facilities Management
Realising Social Value within Facilities ManagementRealising Social Value within Facilities Management
Realising Social Value within Facilities Management
 
A-Shareholders-Guide-to-Rural-Services
A-Shareholders-Guide-to-Rural-ServicesA-Shareholders-Guide-to-Rural-Services
A-Shareholders-Guide-to-Rural-Services
 
Loc govt turnaround strategy South Africa
Loc govt turnaround strategy South AfricaLoc govt turnaround strategy South Africa
Loc govt turnaround strategy South Africa
 
Rob Whiteman, LG Group - challenges under the coalition government
Rob Whiteman, LG Group - challenges under the coalition governmentRob Whiteman, LG Group - challenges under the coalition government
Rob Whiteman, LG Group - challenges under the coalition government
 
conference presentation
conference presentationconference presentation
conference presentation
 
New microsoft office word document
New microsoft office word documentNew microsoft office word document
New microsoft office word document
 
Plan 2040 Online Public Meeting 2
Plan 2040 Online Public Meeting 2Plan 2040 Online Public Meeting 2
Plan 2040 Online Public Meeting 2
 
Somerville, MA: CDBG Recommendations FY06, from Disability Commission Chair
Somerville, MA: CDBG Recommendations FY06, from Disability Commission ChairSomerville, MA: CDBG Recommendations FY06, from Disability Commission Chair
Somerville, MA: CDBG Recommendations FY06, from Disability Commission Chair
 
Community energy planning roadmap
Community energy planning roadmapCommunity energy planning roadmap
Community energy planning roadmap
 
Localis Total Neighbourhood
Localis Total NeighbourhoodLocalis Total Neighbourhood
Localis Total Neighbourhood
 
Salga chair speaking notes ndp conference stellenbosch
Salga chair speaking notes  ndp conference stellenboschSalga chair speaking notes  ndp conference stellenbosch
Salga chair speaking notes ndp conference stellenbosch
 
Serco Incentives Report Final
Serco Incentives Report FinalSerco Incentives Report Final
Serco Incentives Report Final
 
Discuss in 2-3 pages the benefits of preparing a multi-year capital .pdf
Discuss in 2-3 pages the benefits of preparing a multi-year capital .pdfDiscuss in 2-3 pages the benefits of preparing a multi-year capital .pdf
Discuss in 2-3 pages the benefits of preparing a multi-year capital .pdf
 

Pres195-IP&RforIndustryReform-IPRConferencePortStephens-a-Notes

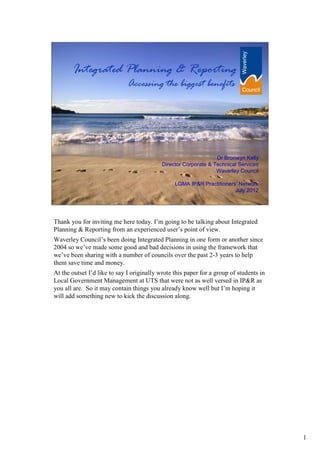
  • 1. 1 Dr Bronwyn Kelly Director Corporate & Technical Services Waverley Council LGMA IP&R Practitioners’ Network July 2012 Integrated Planning & Reporting Accessing the biggest benefits Thank you for inviting me here today. I’m going to be talking about Integrated Planning & Reporting from an experienced user’s point of view. Waverley Council’s been doing Integrated Planning in one form or another since 2004 so we’ve made some good and bad decisions in using the framework that we’ve been sharing with a number of councils over the past 2-3 years to help them save time and money. At the outset I’d like to say I originally wrote this paper for a group of students in Local Government Management at UTS that were not as well versed in IP&R as you all are. So it may contain things you already know well but I’m hoping it will add something new to kick the discussion along.
  • 2. 2 Integrated Planning & Reporting has been law in NSW since 2009 IP&R As we all know, in 2009 both houses of the NSW Parliament unanimously voted to make Integrated Planning & Reporting law for councils in NSW. The legislation didn’t create much of a ripple in the world and its arrival wasn’t heralded in the media. Perhaps the unanimous passage of an obviously sensible but apparently dry bureaucratic process reform didn’t strike much of a chord with the press as a story warranting fanfare. This is understandable. After all it’s just this funny little circle of planning and reporting that on the face of it looks similar to any number of other funny little circles for continuous improvement that public and private sector change agents are seen to indulge in or impose on others from time to time.
  • 3. 3 If you’re out there at the coalface trying to keep up with the sisyphean task of delivering services to a demanding, indeed insatiable, electorate, the little circle might seem more like yet another big rock to push up that hill – more of a burden than a help. But looked at closely, and used properly, this particular reform should offer a number of opportunities to help break the cycle of rock pushing – at least to the extent that a few less of the rocks will roll back down again as they did every time for Sisyphus. If eternal rock pushing is your definition of hell, IP&R probably offers the best opportunity we’ll get in the 25 year program of Destination 2036 to break that cycle and achieve sustainable mircoeconomic reform within the local government sector. By using IP&R effectively Waverley Council secured a mandate from its community in 2011 to double their rates over 7 years. So I can vouch for the fact that IP&R has a number of big benefits. And I can assure you further that these benefits apply for all councils, regardless of whether they need a rate rise or not. But today I’m going to concentrate on what I think are the big 5 benefits and then give just a few practical examples of how councils can access some of these benefits.
  • 4. 4 Hands planning power directly to communities to set and control their future Gives local government primacy of place in planning for community futures and driving all levels of government towards those futures Top down approach to planning is replaced by a bottom up approach to achieve a vision at the lowest long run cost IP&R – Big benefit #1 Community Strategic Plans are meant to express the entirety of the community’s aspirations, not just those priorities a council may be able to satisfy 1. IP&R’s first big benefit – and all the others hinge on this one – is that it hands planning power for the first time directly to communities and councils, giving them a chance to work together to set their future and then drive all levels of government towards it. • The peak plan in the framework – the Community Strategic Plan – is meant to express the entirety of the community’s aspirations, not just those priorities that a council may be able to satisfy. • Because of this, IP&R allows us to capitalise on our natural advantage of being the level of government closest to the community, take the lead, and shape a community’s whole future. It gives local government primacy of place not just in developing plans with the community, but in creating the necessary partnerships between the various levels of government, the business sector and the community itself to deliver on those plans, and to deliver them at the lowest long run cost.
  • 5. 5 Increases our capacity to reform the funding structure and financial security of the local government sector Quality IP&R: will become the dominant means by which we attract funding from other levels of government is already the means of securing increases in rates income IP&R – Big benefit #2 2. The second benefit is that IP&R has the capacity to totally reform the funding structure and financial security for the local government sector. • If we add a few tweaks from time to time and closely integrate our plans over the next few years with the plans of other levels of government, particularly those for infrastructure funding, land use planning and city planning, IP&R will become the dominant means by which we attract funding from other levels of government. • It’s already the only means by which we can garner community support and a mandate for increased investment in vital services and assets via rate rises. So it’s central to our future as a financially sustainable industry.
  • 6. 6 Provides a mechanism to organise investment in asset renewal without having to cut services to fund that renewal IP&R – Big benefit #3 3. Thirdly, IP&R provides a mechanism to organise ongoing investment in services and infrastructure sensibly, affordably and equitably. • It does this by taking the focus off the short term and setting it squarely on prioritisation of investment according to community targets that have been agreed in advance through genuine engagement. As such it holds out the possibility of gradually overcoming backlog infrastructure asset renewal bills without having to cut services to fund that renewal.
  • 7. 7 Offers the possibility of major productivity gains Councils can: raise the profile of their contribution to QBL outcomes test their comparative advantage in service provision improve their performance and credibility in providing value for money IP&R – Big benefit #4 4. And 4 – although I think, in the NSW model, this particular potential hasn’t really been recognised yet – IP&R holds out the possibility of major productivity gains for the local government sector. • IP&R makes councils focus on strategies for achieving quadruple bottom line results for: • sustainable communities, • sustainable lifestyles and economies, • a sustainable environment, and • sustainable governance. • Because of this IP&R has the capacity to help councils raise the profile of their contribution to valuable community outcomes and shape and promote their comparative advantage as the most efficient level of government to deliver those outcomes. So it’s the foundation for improving our performance, and credibility, in providing value for money. Do we want to attain credibility as the most efficient and productive level of government? Well, IP&R, used well, might just give us the means to achieve that.
  • 8. 8 The “R” in IP&R helps maintain quality relationships with our communities Helps us and our services to remain relevant IP&R – Big benefit #5 5. And 5 – The R in IP&R will have significant value in helping us maintain quality relationships with our communities. • The IP&R framework requires us to transparently show the extent of progress towards or away from the vision and targets of the Community Strategic Plan. Because of this it provides a basis for ongoing trust between councils and their communities and the means of our staying relevant as service providers. This is probably the biggest or most lasting benefit, particularly for councillors. The R of IP&R should ideally keep them locked in step with their communities, which in turn should maximise their chances of being re- elected. You never know – one day government might move beyond politics.
  • 9. 9 Benefit #1 Communities and councils can plan a sustainable future and the partnerships necessary to achieve it Benefit #5 The community can ensure services will be the most relevant and potent for achieving their vision Benefit #4 Councils can maximise QBL outcomes and productivity Benefit #3 Councils can achieve sustainable investment in services and assets Benefit #2 Councils can secure finance for their contribution to the community’s future IP&R Benefits Accessing all these benefits is of course going to be tricky and being realistic, may take up to a decade. Contrary to the less thoughtful tabloid opinion, most councils aren’t generally flush with resources, especially rural councils. Some councils are quite well off and secure of course. And some can quite deftly do quite a lot with very little. But nevertheless there is a wide variability in both well resourced and not so well resourced councils in their capacity to develop visionary Community Strategic Plans, let alone the detailed long term Resourcing Strategies and mature quadruple bottom line reporting envisaged by the Act. Councils will need a lot of practical and financial assistance and collaboration if the weight of the new planning rock is to be made lighter.
  • 10. 10 Action PlanAction Plan In this regard, some of the best money that might be spent under the Destination 2036 Action Plan would be in Initiative 1 – for human resource development, particularly if it focuses on developing holistic planning and community engagement skills. Some of the second best money would probably be spent on Initiative 10 – for aligning state and local government planning frameworks. As I said before, integration of the plans of different levels of government is going to become the dominant means by which we attract funding from other levels of government. So anything we can do in inter-governmental alignment plans is going to maximise our share of national funds. In the mean time, however, while we are waiting for Destination 2036 to really get up some speed, we should concentrate on how we can access the considerable benefits of IP&R at home. The main things we can work on to get the biggest benefits as quickly as possible are: •community engagement, •asset and financial planning, and •end of term reporting. I’ll start with community engagement.
  • 11. 11 Community engagement is the enabling feature of great IP&R The better the engagement the bigger the benefits Community Engagement Quality community engagement is the great enabling feature of great IP&R. It’s the biggest money saver because it will allow us to work out with our communities how we can achieve the most at the lowest long run cost – particularly in terms of asset renewal. If we collect quality data from our communities in this engagement, it’s also going to help us have the maximum influence on the plans of other levels of government – which in turn will make them commit the sort of services and funds that will enhance our communities’ desired QBL outcomes the most. Ultimately this should, in theory, take the pressure off our sector, at least a little. The pressure to constantly fill service gaps left by State and Federal Government without having the necessary resources should drop. We might even begin to reduce the effects of various types of cost shifts that tend very much to run only one way at the moment, i.e., down to local councils. The recent carbon price is a good example of a classic cost shift that in the past we might not have had anywhere near the wherewithal to offset. Pre-IP&R, we would have just had to absorb it and cut other things to fund it. Post-IP&R, we have at least some chance of offsetting the cost shift, for both councils and the community, by developing partnerships with the community to ultimately obviate the need to pay the tax, namely by developing a low carbon lifestyle. Post IP&R, something like the carbon tax can do the work it’s designed to do much more quickly and efficiently than it otherwise would.
  • 12. 12 12 View all our plans by clicking on this link on the front page of our website Community engagement and partnership building via IP&R is going to open up a wide range of similar opportunities. To give you an idea of some of those opportunities I’m going to use Waverley as a case study. Waverley Council’s been getting better, slowly, at community engagement. We’re a Group 1 council for purposes of IP&R. We became compliant to a high degree in 2010 after six years of planning and consultation. You can view our plans by clicking on this link on the front page of our website. That will take you to this tree of plans. Each of the little pictures in the tree is a live link. If you click on them they will take you directly to the plans you want.
  • 13. 13 13 View all our plans by clicking on this link on the front page of our website Waverley started the IP&R thing pretty early because we could see we were going to run out of money. The threat of execution focuses the mind wonderfully, as Samuel Johnson would say, so our plans are quite heavily detailed and explicit. And you can see the influence of community engagement in their evolution, especially in consultation about required service levels for assets. Community engagement on these plans was conducted over a two year period in two main stages. You can view the results of the first stage in the report in the top circle and the results of the second stage in the report in the bottom circle.
  • 14. 14 14 The first stage of consultation was to create the Community Strategic Plan which for us is called Waverley Together 2. The second was to secure funding for the council services necessary to help the community meet the vision and targets of that plan.
  • 15. 15 Community strategic plan 15 $200 million shortfall over 11 years A funding shortfall Long term financial plan Two stages of consultation were necessary for Waverley because the first stage had resulted in a Community Strategic Plan, an Asset Management Plan, an Environmental Plan and a stark demand for services that, from our long term financial planning, we knew we couldn’t fully fund. There was a $200 million shortfall over 11 years for services required from Waverley Council to help the community meet some of their targets in Waverley Together 2. Part of this shortfall – and I emphasise only part – was for backlog asset renewal. The remainder was for services. So we were facing the prospect of having to cut services because there wasn’t enough money to keep them going, and then cut them even further to fund backlog asset renewal. Community engagement to develop integrated plans has got us out of that problem at least for the moment. Here’s the quick story on how that happened.
  • 16. 16 Waverley asset renewal estimates 16 2003/04 Annual Financial Statements – Schedule 7 Asset category Cost to bring to a satisfactory condition Cost to maintain at a satisfactory standard Roads $31,950,000 $2,555,000 Footpaths $12,950,000 $1,850,000 Kerbs & gutters $5,900,000 $1,180,000 Stormwater assets $37,200,000 $1,800,000 Buildings $5,235,000 $1,353,000 Total $93,235,000 $8,738,000 Waverley Council Asset Maintenance Costs Reported June 2004 The first thing we did was to use IP&R to get the asset backlog problem under control as much as possible. In 2004, as we saw it, this was our biggest problem. In that year, well prior to implementing IP&R fully, Waverley Council was reporting estimates of $93 million to bring just 5 categories of assets to a satisfactory standard and $8.7 million a year thereafter to keep them there. These estimates were being derived by using asset valuation and depreciation, very much as we all do, albeit that we were admittedly not using these estimating methods all that well. $93 million is a big figure – at the time it was more than our annual income. Obviously we couldn’t fund this so we were highly motivated to ask ourselves whether the estimate was really correct. As it turned out, mercifully – it wasn’t correct – nowhere near it.
  • 17. 17 Revised asset renewal estimates 17 2003/04 2010/11 Asset category Cost to bring to a satisfactory condition Cost to maintain at a satisfactory standard Roads $31,950,000 $2,555,000 Footpaths $12,950,000 $1,850,000 Kerbs & gutters $5,900,000 $1,180,000 Stormwater assets $37,200,000 $1,800,000 Buildings $5,235,000 $1,353,000 Total $93,235,000 $8,738,000 Waverley Council Asset Maintenance Costs Reported June 2004 Asset category Cost to bring to a satisfactory condition Cost to maintain at a satisfactory standard Roads $1,350,000 $1,350,000 Footpaths $1,757,000 $1,490,000 Kerbs & gutters $730,000 $730,000 Stormwater assets $3,503,000 $1,650,000 Buildings $5,207,000 $2,420,000 Total $12,547,000 $7,640,000 Waverley Council Asset Maintenance Costs Reported June 2011 Today Waverley Council is routinely reporting less than $15 million to bring those same assets to a satisfactory standard and, depending on the year, between about $5.5 and $7.5 million a year to keep them there. Effectively we’ve wiped out the backlog for roads, footpaths, kerbs and gutters and most of the drainage. We still have one shocker of an asset in the form a of 16 hectare cemetery that needs some major work to stop it sliding into the sea and some buildings that need to be brought up to acceptable service levels. But by and large the asset renewal program has been brought within our reach. And we’ve got a community that’s willing to organise investment in its assets to keep them in the shape they want at what we know is the lowest long run cost.
  • 18. 18 Reduced asset backlog 18 Reporting Year Cost to bring to a satisfactory condition Cost to maintain at a satisfactory standard Reported 2003/04 $93,235,000 $8,738,000 Reported 2010/11 $12,547,000 $7,640,000 Reduction 87% 13% Waverley Council Change in Reported Asset Maintenance Costs Overall since 2004 there’s been an 84% drop in the estimate for the backlog and, depending on the year, a 12%-35% drop in expected ongoing annual maintenance costs. That drop was achieved by a combination of sensible engineering investigations and ultimately by working with the community in a simple integrated consultative and planning process to check that we’re taking an acceptable approach to setting service levels and investment programs. I’m short on time of course so I’m going to give you the potted version of the Integrated Planning method for assets.
  • 19. 1919 Asset planning using IP&R 1. Look at the physical condition of the assets Don’t use age as an indicator of condition 2. Use engineering expertise and knowledge of current asset condition, set a “floor” for an expenditure program – a minimum necessary expenditure to avoid risk and future cost increases Test the “floor” with councillors and set rules to reduce risk 3. Engage with the community to test that the “floor” expenditure will result in a total portfolio of assets that will deliver satisfactory service 19 It’s got 3 main features: First, it looks at the actual physical condition of assets, instead of making assumptions about their condition, or their remaining life, based on their age. Second, it uses good old engineering know-how to set a floor for the minimum expenditure necessary to achieve safe and least cost asset renewal cycles – and it confirms this floor by consulting with councillors and getting them to take the leadership they’re elected to take. Third, it requires entry into dialogue with the community to see whether they’ll insist on more than the floor expenditure. That might sound like basic common sense, and it is. But I can say it wasn’t all that easy to work out the consultation part of it. It certainly wasn’t easy to work out a simple consultation program, as the engineering manuals tend to complicate rather than simplify the language you can use for consulting on desired service levels. It also took a while to build up the courage to jettison a few assumptions inherent in current thinking on asset economics.
  • 20. 20 … as most of our infrastructure was built in the 1950s and 1960s it is now “nearing the end of its economic life” … Australian Infrastructure Financial Management Guidelines IPWEA, 2009 20 That thinking is based on the assumption that economic life can be measured by age and that once an asset has been in use for a certain number of years it can no longer deliver acceptable service without being entirely replaced. The implication of this is that if our infrastructure is say 60 to 70 years old it’s been fully consumed and will need to be entirely replaced – and soon. As a manager – neither an accountant nor an engineer – I’m not convinced that this is correct, partly because “economic life” isn’t necessarily measured by age, or even deterioration. I, for instance, could be said to be an asset in “medium deterioration” (at least) and I’m now drawing a pension for transfer to retirement so I’m on the wrong side of middle age, but I might flatter myself that I have quite a deal more useful life and value left in me than those years or that condition would imply. And I think there’s cause for optimism that it’s the same for our infrastructure, perhaps more so, because I can guarantee you that infrastructure assets respond more readily to maintenance than biological assets. At least I hope this is the case because the pessimistic views mean that only the wealthiest councils will be able to afford to address asset backlogs without raising rates well above CPI or cutting services, or both.
  • 21. 2121 Asset planning using IP&R Question the concept that an asset needs to be completely re-built at the end of its useful life • Plan just-in-time maintenance programs to extend the life of the assets for less money Many assets may be in a lot better condition than their age will imply 21 If Waverley was to avoid having to triple or quadruple rates we had no alternative but to question and ultimately move away from the concept that an asset needs to be completely rebuilt at the end of a notional economic life. We had to move away from loading the cost of that notional re-build into the life cycle cost estimate and shift our emphasis to planning just-in-time maintenance programs which would extend the life of the assets for less money. In the first instance we had to spend a fair bit of money to save this money – about $1 million in asset condition surveys for our mere 9.2 square kilometres of land area. So big councils will need financial assistance to do this. The good news though is that when you actually go out and look at the real condition of an asset, our experience is that you’re likely to find that that assets can be in a much better condition than their age would imply – especially from the point of view of their capacity to provide satisfactory service. So it’s probably going to be cheaper – perhaps much cheaper – to renew them than you think. Not always but mostly, especially for city councils with well established asset bases. If we understand the actual condition of assets we can lengthen or shorten renewal intervals until we get the lowest long run renewal cost. We can, in some cases, lengthen the renewal interval indefinitely. For a lot of assets, good maintenance based on up to date knowledge of condition can displace full reconstruction to some considerable extent. We’re adhering to the old engineer’s mantra – give a well-built road a tight roof and a dry floor and it can last.
  • 22. 22 22 The Appian Way, Rome - 2300 years old, brilliantly engineered, and still going strong The Romans have proved this. That’s the Appian Way in Rome. It’s a magic piece of engineering, 2,300 years old and still going strong. It’s a layered construction with a brilliant drainage system. It’s said that the stones in the top layer all fit together so perfectly that a knife can’t be wedged in between them. Its longevity is secured by its dryness and as a result it’s still fit for purpose, although the purpose has changed through time. It’s transported centuries of people, goods and armies. Mussolini drove tanks on it. Now the service level required for the road seems thankfully to be mainly to transport the sheep and to act as a remarkable monument to the ingenuity, sweat and blood of millions of Romans, not to mention hundreds of crucified Spartans. But it is indeed more than fit for its current purpose and the Romans have certainly had their money’s worth.
  • 23. 23 Consulting using IP&R 23 As to using consultation to control the costs of asset renewal, Waverley took advantage of the opportunity provided by the introduction of the Integrated Planning reforms in 2009 to place the consultation about the need to maintain assets in the wider context of conversations about demand: •for community services, •for management of the natural environment and •for a strong local economy. This helped us avoid a situation where people would drive up demand for better assets leaving us with the problem of having to cut services to fund unnecessary asset renewal.
  • 24. 24 Consulting on the “floor” using pictures 24 We consulted on: − Roads, footpaths, kerbs & gutters − Buildings − Trees and parks landscapes We deliberately didn’t consult on some assets: − Drainage − Retaining infrastructure − Infrastructure in parks and cemeteries − No point in asking someone if they mind a wall falling down or being flooded 47% 32% 11% 10% 0% Condition 1 - Good condition Condition 2 - Minor deterioration Condition 3 - Medium deterioration Condition 4 - Major deterioration Condition 5 - Unserviceable We used pictures and maps to lift the community’s vision above the parochial and self-centred. With that sort of clear information they made trade-offs to pull the cost down to something more like what seemed the best value for money. And luckily that seemed to be what the majority felt they could also afford. In that process they realised that assets don’t need to be in top condition all the time to deliver acceptable levels of service and that indeed having assets reconstructed as new would be over-servicing. They also realised that it might just be affordable to maintain both services and assets. In other words they won’t have to trade one off to get the other if they just get the funds organised efficiently and don’t delay overdue investment too much longer. I don’t think it’s possible for me to make this completely clear or credible in a few minutes but it may be encouraging for cash strapped councils to hear that when you look at what an asset is valued for by the community, rather than what it’s valued at by an accounting method, you get a different and generally lower idea of the bill for maintaining it. And it is possible to motivate communities to solve this problem. People aren’t stupid. They know that an expenditure delayed is a bill increased not just for their kids but for them too. They want long term planning, and when you give them clear sensible information they give you clear sensible preferences in return. And they gain confidence to invest a bit more than they otherwise might.
  • 25. 25 25 HVRF Community Survey 2010 Is a rate rise of 120% over 7 years reasonable? 0% 10% 20% 30% 40% 50% 60% Can't decide Disagree or strongly disagree it's reasonable Agree or strongly agree it's reasonable HVRF Community Survey 2010 Is a rate rise of 120% over 7 years affordable for you? 0% 10% 20% 30% 40% 50% 60% Can't decide Disagree or strongly disagree it's affordable Agree or strongly agree it's affordable Waverley Council went out and asked the community if they would double their rates over 7 years to pay for the QBL lifestyle they wanted. Actually we asked them if they would increase them by 120%. A significant majority in a statistically valid survey said yes. Depending on the magnitude of the rate rise, for every 1 person against a rate rise after this integrated planning process, there were 1.7 to 2.3 who were for it.
  • 26. 26 Community regard for Council rose steeply 50% of participants thought the better of Council after this process Only 10% thought the worse of Council Improvement in Community Perceptions of Waverley Council from the "Funding the Future" Consultation Program and Service Plus 0% 10% 20% 30% 40% 50% 60% Council's performance in long term planning Council as a trusted partner Importance of Council's role in delivering a better lifestyle Value for money of Council's services Importance of services % of community more negative about Council % of community more positive about Council Improved confidence in us But on top of that, in the process their view of the importance of Council’s services and their confidence in Council itself as a trusted partner and planner changed for the better. You can see from this slide that 50% of our resident respondents in the statistically valid survey (the people in the blue bars) thought the better of us on several fronts – after they’d agreed, in the majority, to double their rates. Only about 10% (the people in the red bars) thought the worse of Council. The opinion of the rest remained unchanged.
  • 27. 27 Benefit #1 Communities and councils can plan a sustainable future and the partnerships necessary to achieve it Benefit #5 The community can ensure services will be the most relevant and potent for achieving their vision Benefit #4 Councils can maximise QBL outcomes and productivity Benefit #3 Councils can achieve sustainable investment in services and assets Benefit #2 Councils can secure finance for their contribution to the community’s future IP&R Benefits It took a very interactive engagement and survey process to achieve this result. But I think it’s pretty clear why I’ve derived the view about benefit #4 of IP&R – that being that IP&R is the foundation for improving our performance, and credibility, in providing value for money. Basically the lesson we learned is that if you provide sensible information in an accessible format, people will act rationally, even generously, and you will narrow down the error margin in long term financial planning. Self interest and the common interest are more likely to begin to merge for participants in this interactive sort of process. But even if they don’t merge, when it comes to something like local government infrastructure, if you use a method which excludes community engagement you’re more likely than not to end up trying to put aside money that you might not need at all. Which brings me to the point about how the sector as a whole might begin to make some serious inroads towards accessing benefit #2 of IP&R – financial security for the sector.
  • 28. 2828 Accessing benefit #2 A hypothesis: Published estimates of backlog infrastructure renewal: $4.2 billion to $6.3 billion in NSW alone (100 largest councils only) - Fiscal Star $14.5 billion nationally - Price Waterhouse Coopers Let’s assume these estimates are over-stated Let’s also assume that there’s enough funds in total in the sector to deal with asset backlogs without cutting services, but that access to the funds is poorly distributed 28 $ security Here’s a hypothesis about accessing benefit #2: Let’s assume that the local government sector’s liability for assets is probably not as big as the big end of town accounting firms have been suggesting. It’s possibly less than the published estimates of $4 to $6 billion in NSW or $14.5 billion nationally. And further, let’s assume we are a relatively wealthy country and that the industry as a whole has access to enough sources of funds in total to deal with the infrastructure issue at the reduced estimate, but that access to the funds is poorly distributed. Some have enough and can access more when they need it, and some can’t.
  • 29. 2929 Accessing benefit #2 A proposition: Can we re-distribute access to funds to achieve long term asset and service sustainability, without having to sacrifice services for assets, or assets for services? In other words can we achieve QBL sustainability? 29 We can match that hypothesis with a proposition: And that proposition is that if we can re-distribute the access to total funding somehow, we may be able to achieve long term asset and service sustainability within available funding and without having to sacrifice services for assets, or assets for services. In other words we may actually be able to achieve QBL sustainability.
  • 30. 3030 Accessing benefit #2 Currently funds are locked up in artificial ways: Metro councils have access to rates, grants, user charges, contributions, etc due to large populations Rural councils at the other extreme have limited populations and are dependent in the main on grants If we can achieve a standard of IP&R that more accurately funds real liabilities and service necessities in the city, can we free up some funds for regional areas to catch up more quickly with asset renewal and creation? 30 At the moment, funds are locked up in odd ways by virtue of the history of council boundaries, population and land use distribution. The metropolitan areas are probably corralling funds including rates, grants, fees, charges and contributions, that, at least in terms of total asset liability, the metro region doesn’t need or if they do need it they can raise by other means due to their larger markets and populations – just like Waverley’s done in getting a big rate rise and setting up a parking system and buying and selling big property. I’m sure if you’re a city council you’ll have noticed the federal grant cake is getting smaller in total and you’re getting less of this smaller cake as the federal government has been re-directing funding to the regions and rural areas – where for the moment, in my humble opinion, it should be going anyway. These are the areas where they probably do have daunting asset backlogs and insufficient population to overcome their asset problems. In that context: •if city councils can all use IP&R to tap efficiently and fairly into available funds and prepare long term financial plans that accurately reflect their real liabilities – not the sort of liabilities for instance which are calculated by assuming long lived assets need to be fully replaced after a mid life crisis at age 50 – but the real liabilities; and •if those city councils can also consult with their communities to optimise investment in the most efficient assets slowly over the next decade; then it might free up more of the limited federal grant funds for diversion to the rural and regional areas. Councils in those remote areas might be able to break out of the sisyphean cycle they’ve been consigned to without having even sinned.
  • 31. 3131 Accessing benefit #2 Funding replacement of short-lived assets with long-lived assets has a lower long run cost 31 They might be able to stop for instance putting in roads that simply replace a short-lived asset with yet another short-lived asset that will fail in the next big storm. If we jettison that rather silly, in fact sinfully wasteful, system we have at the moment of giving councils grants for roads and then, by the terms of the grant, restricting them to replacing like with like, we might be able to get some decent proper roads into regions and markedly increase national GDP as a result. Farm produce won’t be held up for weeks after a flood. And kids in rural areas won’t have missed a year of school by the time they’re 12 – which actually happens in some areas now. 10-15 years of concentrated cooperative effort should be enough to achieve replacement of short-lived roads with some decent road and drainage assets that can be maintained for a fraction of the cost of the current ones.
  • 32. 3232 Accessing benefit #2 Exchange this … for this… 32 This is a major productivity contribution that the local government sector can make for itself and the country, simply by re-organising access to funding for a temporary period of about a decade. Of course achieving it without creating too many adverse effects in the cities will be tricky. But guided by good IP&R we can probably do it. And if that is complimented by some thoughtful fine-tuning of policy in creating better access to funding for areas of the city where they probably do have financial challenges – namely councils on the metropolitan fringe that are struggling to provide services for new development while developer contributions have been capped – then we should be able to organise the money to ensure the most efficient investments are made in the cities. At the moment the policy debate is developing on this issue with, for example, suggestions from IPART recently that inner city councils might be levied with a special levy to support metropolitan fringe councils who are struggling to provide infrastructure and services to new developments with $30,000 cap per block. I’m not sure myself that hitting up people in the central metro areas to fund expensive development on the fringe is quite the way to establish economically efficient investment decisions. I would have thought we should be developing accessible sources of funds that will encourage developers to consolidate more within already developed areas, rather than develop blocks in fringe areas with high marginal costs. And we should be revising the rate capping system to ensure access to tax income is appropriately distributed. The right economic answer is still to come.
  • 33. 33 Benefit #1 Communities and councils can plan a sustainable future and the partnerships necessary to achieve it Benefit #5 The community can ensure services will be the most relevant and potent for achieving their vision Benefit #4 Councils can maximise QBL outcomes and productivity Benefit #3 Councils can achieve sustainable investment in services and assets Benefit #2 Councils can secure finance for their contribution to the community’s future IP&R Benefits In the meantime, successive cycles of IP&R with four year revisions to develop new and better Community Strategic Plans might gradually work out some of the policy bugs. The quality of future CSPs will depend very heavily on the quality of the “R” in our IP&R. Accessing big benefit #5 – quality relationships and trust with our communities – will be critical if we’re going to be able to get them to continue to invest with us in efficient equitable patterns. Quality reporting is the means of securing that benefit.
  • 34. 3434 34 Did life get better? and Was it something we did? The “R” of IP&R For quality End of Term Reporting: We need to set up meaningful community targets with good baseline data in our Community Strategic Plans so that at the end of every term of an elected council we can answer the questions: •Did life get better?, and •Was it something that we did?
  • 35. 3535 35 If life got better, which strategies helped most? and If it got worse, what else might we try? The “R” of IP&R And if it got better, which strategies helped the most? If it got worse, what else might we try? The outgoing council needs to pass the learning from this to the incoming council with suggestions about where to try new partnerships and which policies need to be changed or services improved by all levels of government, not just the council.
  • 36. 3636 End of term reporting Waverley Together 2 is set up with 60 targets and indicators for reporting on how life has changed Baseline data are already established for every target and indicator, so the community can see where we were back when the plan was adopted We’re able to measure the difference quantitatively between the 2009/10 baseline and 2012 (if there is any difference over such a short period) 36 We’ve drawn a baseline in the sand at 2009/10 Answering these questions will mean that our CSPs need to be set up in a certain way. If you’re looking for some guidance on that, Waverley Together 2 and the End of Term Report on it might be helpful. Waverley Together 2 is set up with 60 targets and indicators for reporting on how the community’s life has changed in the term of office of the council. That’s their whole of life including whether they have moved towards or away from their vision for a sustainable community, a sustainable lifestyle and economy, a sustainable environment and sustainable governance. Baseline data are already established and published in Waverley Together 2 for every target and indicator, so the community can see where we were back when the plan was adopted. In the End of Term Report we’re now able to measure the difference quantitatively between the 2009/10 baseline and 2012 (if there is any discernible difference over such a short period).
  • 37. 3737 Reporting framework 60 targets and indicators 51 are measuring Community outcomes 9 are measuring Council outputs (all in governance) 37 Of the 60 targets and indicators, 51 are measuring Community outcomes and 9 are measuring Council outputs.
  • 38. 3838 Measuring progress The targets and indicators in Waverley Together 2 can be measured in one of two ways: Either as an objective change in a physical target or as a change in consensus about a subjective indicator of quality of life Taken together the objective and subjective measures give an “indication” of QBL progress They’re our community indicators 38 Example of a “target” 30% reduction of [community] greenhouse gas emissions by 2020 based on 2003/04 levels Example of an “indicator” The proportion of residents who agree there is a sense of community in Waverley The targets and indicators can be measured in one of two ways: either as an objective change in a physical target – like greenhouse gas emissions, or as a change in consensus about a subjective indicator of quality of life- like perceptions of sense of community. Taken together the objective and subjective measures give an “indication” of the direction and quantum of QBL progress.
  • 39. 3939 The first report The first end of term report will show movement forwards or backwards from the 2010 baseline point of all 60 targets and indicators It will show relative proportional movement away from the line drawn in the sand in 2009/10 39 2010 right direction wrong direction The first End of Term Report shows movement forwards or backwards from the 2009/10 baseline point of all 60 targets and indicators. And it shows relative proportional movement away from the line drawn in the sand in 2009/10.
  • 40. 4040 The first report Results will also help councillors provide advice to the next council on any of Council’s services that require review This is possible because the connection between Council’s services and the targets of the CSP has been fully mapped 40 Contribution of Council services to the directions of the CSP is mapped in the workforce plan As I said before, the results will help councillors provide advice to the next council on any of Council’s services that require review. This is possible because the connection between Council’s services and the targets and vision of the CSP has been mapped out in the Workforce Plan.
  • 41. 41 41 Council’s deliverables Community outcomes Service Plus 22 main service categories comprising 150 sub- services contribute directly to efficient implementation of … Directions/Strategies the 33 Directions/Strategies in Waverley Together 2 to assist the community to meet … Targets 60 Targets/Indicators for quadruple bottom line sustainability that, if met, will … Vision enable the community to realise all 14 Vision elements of Waverley by 2022. How do Council’s services help make the Vision of Waverley Together 2 a reality? Our service package, called Service Plus, has 22 main services, which contribute directly to the implementation of 33 directions and strategies to assist the community to meet 60 targets for QBL sustainability that, if met, should enable the community to realise all 14 elements of their vision for a better quality of life in Waverley by 2022.
  • 42. 4242 42 2010 right direction wrong direction Waverley Together 2 Movement towards or away from a sustainable environment 19% -5% 14% 5% -53% -1% -3% -3% -14% 4% 36% 3% -11% -100% -50% 0% 50% 100% 50. Satisfaction with Council's environmental management and education is increasing. 49. Our community rates the environment as an important issue. 43. The proportion of residents who rate the water quality in beaches and waterways as clean is steady or increasing. 42. More than 345 clean beach days per annum (>95%) based on DECCW Beachwatch Water Quality Results. 40. 50% reduction in Council’s mains water consumption by 2020 based on 2005/06 levels. 39. Zero increase in the LGA’s mains water consumption by 2020 based on 2005/06 levels. 38. 75% of the LGA’s domestic and commercial waste is diverted from landfill by 2020. 37. No net increase in overall waste generation by 2020 based on 2007/08 levels. 36.40% of the total daily distance travelled by residents is by public transport, walking or cycling. 35. The average kilometres travelled by Waverley residents per day by private car declines by 15% by 2020 based on kilometres travelled in 2006. 34. 30% of electricity used in the LGA comes from renewable sources by 2020 (solar power kWs generation capacity by community - baseline Jan 2011). 33. 30% reduction in Council’s greenhouse gas emissions by 2020 based on 2003/04 levels. 31. 30% reduction in the Waverley community's greenhouse gas emissions by 2020 based on 2003/04 levels. % movement towards (green) or away (red) from targets for a sustainable community The service / direction/ target / vision map enables us to tease out not only if life got better but in what way. For instance in terms of a sustainable environment – have we moved in the right or wrong direction? Well it’s line ball there I think, which is not too great.
  • 43. 4343 43 2010 right direction wrong direction Waverley Together 2 Movement towards or away from sustainable living 18% 8% 12% 15% -50% -1% 17% -2% 19% 40% 15% 27% 11% 2% 14% -100% -50% 0% 50% 100% 30. Satisfaction with on-street parking management is steady or increasing. 29. Proportion of residents who think that public transport is adequate for their needs is increasing. 28. Proportion of residents who view Waverley as a safe area for cyclists is increasing. 27. Proportion of residents who view Waverley as a safe area for pedestrians is steady or increasing. 26. 4-wheel drive vehicles registered in Waverley declines by 5% by 2020 based on 2007 numbers. 25. The number of private passenger vehicles (cars) registered in Waverley is stabilised by 2020 at 2007 levels. 24. Satisfaction with local traffic management is increasing. 23. The number of vehicle accidents and pedestrian accidents per annum is equal to or less than the number in 2005 (2010 data). 22. Satisfaction with Council's building development, planning and controls is increasing. 21. The proportion of residents who think that graffiti is adequately controlled is steady or increasing. 20. The proportion of residents who think that litter is adequately controlled is steady or increasing. 19. Satisfaction with the removal of dumped rubbish is increasing. 18. Satisfaction with the look of public places is steady or increasing. 17. The level of business activity in each of our commercial centres and villages is minimum of 85% (average occupancy of commercial premises since base year). 16. The level of unemployment in our area remains low. % movement towards (green) or away (red) from targets for a sustainable community Or in terms of a sustainable lifestyle and economy. You can see that the news is pretty good and this quadrant is mostly moving in the right direction except for all those Waverley residents buying rather large numbers of 4WD cars. We don’t know what that’s about but it’s certainly not conducive to sustainable transport.
  • 44. 4444 44 Vision has 14 elements Mapping the path of the services towards the vision is complex but worth the exercise Helps ensure the plan is as powerful as possible Ultimately we can get a view of whether we have moved towards or away from the vision which for Waverley is quite detailed compared to your average vision statement but which really helps us map progress to the QBL – like so.
  • 45. 4545 45  wrong direction right direction 2010 Have we moved closer to or further away from the vision of Waverley Together 2 ? -40% -20% 0% 20% 40% 60% 80% We are confident our leaders will reflect thoughtfully on our views and best interests when making decisions for our future As a local community we have the courage to take a leading place in achieving the environmental aims of a global society Local economic prosperity provides opportunity for all Scarce resources are conserved and fairly shared Vital services are fully accessible The architectural landscape is cared for and developed at a human scale, and design is sensitive to the natural, historical and social contexts The beauty of our beaches, cliffs and coastal lands endures We act together as a compassionate society We can express our essential selves through our traditions, our arts, our cultures, and our lifestyles Everyone is welcomed to participate positively in community life We are inspired and able to renew our physical and spiritual wellbeing Connections within families and between generations can remain unbroken We are reconciled with and value our indigenous past We are safe % of community who feel we have moved further away from the vision % of community who feel we have moved closer to the vision You can see from these results that the community view at least is that we have on balance moved towards the vision (in green) rather than away from it (in red). Although once we added in the physical data on the environment, economy, and governance it became pretty clear that perception didn’t really align with reality.
  • 46. 4646 46 VisionVisionVisionVision Perception of progress towards the vision Progress taking into account perception and physical measures We are safe We are reconciled with and value our indigenous past Connections within families and between generations can remain unbroken Everyone, from near and far, is welcomed to participate positively in community life We are inspired and able to renew our physical and spiritual wellbeing We can express our essential selves through our traditions, our arts, our cultures, and our lifestyles We act together as a compassionate society The beauty of our beaches, cliffs and coastal lands endures The architectural landscape is cared for and developed at a human scale and design is sensitive to the natural and historical context   Vital services are fully accessible Scarce resources are conserved and fairly shared  Local economic prosperity provides opportunity for all   As a local community we have the courage to take a leading place in achieving the environmental aims of a global society  We are confident our leaders will reflect thoughtfully on our views and best interests when making decisions for our future   Perceived and actual progressPerceived and actual progressPerceived and actual progressPerceived and actual progress Waverley Together 2 VisionWaverley Together 2 VisionWaverley Together 2 VisionWaverley Together 2 Vision Actual progress The community is of the view that the main areas to work on are: the architectural landscape – which is about living with the good and bad of urban density economic sustainability, and the community’s confidence in whether our leaders will reflect thoughtfully on their views and best interests when making decisions for their future. But the full data strongly suggest that the economy is rosier than they feel and the environment is worse than they feel, and we’re not the resource conservationists we think we are. Still, the common feature of the areas of concern is that it will take increased investment and partnership by all levels of government, business and the community, not just change by Council, to fix it. So we have a powerful instrument here to influence the plans of other levels of government, which gets us a bit further advanced towards all the big benefits, particularly big benefit #5 – staying relevant. Or, if you’re a councillor, getting re-elected.
  • 47. 4747 47 IP&R – the means of changing the face of local government so that we match the vision for the industry by 2036 The extent to which we can access these benefits is limited by a range of things. But implementation of the IP&R framework probably has more potential than most other actions in Destination 2036 to change the face of the industry so that we match the vision for local government by 2036. If you read through the Destination 2036 Action Plan it actually doesn’t mention IP&R much. It’s as though the authors thought “well we’ve already done that one so there’s not too much need to go into it further here”, which is of course true. But if Destination 2036 is about remaking our sector so that we can achieve strong sustainable communities, then the means by which we plan the actual futures of those communities has to be central and if not overarching. IP&R should become an embedded skill in Local Government in the next decade and if we succeed in that I would argue that IP&R will extend the benefits of any reforms of the sector, like those coming from the Local Government Review Panel, long after they have been implemented. IP&R is the means of implementing much of the Destination 2036 Action Plan and is bound to be more effective and lasting than say structural reforms, many of which have limited utility if they’re not matched by process improvement – namely continuous improvement in holistic planning and integration with other levels of government. I hope you all have fun using it in the next decade and get as much out of it as you can for your community. Thanks for listening.