Contenu connexe
Similaire à The Colony TX - Feb/March 2011 - Housing Market Report
Similaire à The Colony TX - Feb/March 2011 - Housing Market Report (15)
The Colony TX - Feb/March 2011 - Housing Market Report
- 1. Valarie Littles Ultima Real Estate
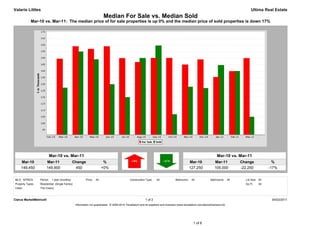
Median For Sale vs. Median Sold
Mar-10 vs. Mar-11: The median price of for sale properties is up 0% and the median price of sold properties is down 17%
Mar-10 vs. Mar-11 Mar-10 vs. Mar-11
Mar-10 Mar-11 Change % Mar-10 Mar-11 Change %
149,450 149,900 450 +0% 127,250 105,000 -22,250 -17%
MLS: NTREIS Period: 1 year (monthly) Price: All Construction Type: All Bedrooms: All Bathrooms: All Lot Size: All
Property Types: Residential: (Single Family) Sq Ft: All
Cities: The Colony
Clarus MarketMetrics® 1 of 2 04/02/2011
Information not guaranteed. © 2009-2010 Terradatum and its suppliers and licensors (www.terradatum.com/about/licensors.td).
1 of 6
- 2. Valarie Littles Ultima Real Estate
Median For Sale vs. Median Sold
Mar-10 vs. Mar-11: The median price of for sale properties is up 0% and the median price of sold properties is down 17%
For Sale # Properties Sold # Properties Price
Time Period Median For Sale Median Sold Difference
Mar-11 149,900 278 105,000 22 -44,900
Feb-11 139,900 244 140,000 25 100
Jan-11 135,500 241 144,611 21 9,111
Dec-10 148,900 247 127,000 27 -21,900
Nov-10 145,000 261 128,000 25 -17,000
Oct-10 149,999 269 106,950 28 -43,049
Sep-10 150,000 256 159,550 27 9,551
Aug-10 146,900 264 149,950 48 3,050
Jul-10 149,900 274 120,000 27 -29,900
Jun-10 159,000 223 129,900 40 -29,100
May-10 157,000 191 149,000 59 -8,000
Apr-10 159,000 259 155,000 50 -4,000
Mar-10 149,450 248 127,250 58 -22,200
Clarus MarketMetrics® 2 of 2 04/02/2011
Information not guaranteed. © 2009-2010 Terradatum and its suppliers and licensors (www.terradatum.com/about/licensors.td).
2 of 6
- 3. Valarie Littles Ultima Real Estate
Supply & Demand by Month
Mar-10 vs. Mar-11: The number of for sale properties is up 12% and the number of sold properties is down 62%
Mar-10 vs. Mar-11 Mar-10 vs. Mar-11
Mar-10 Mar-11 Change % Mar-10 Mar-11 Change %
248 278 30 +12% 58 22 -36 -62%
MLS: NTREIS Period: 1 year (monthly) Price: All Construction Type: All Bedrooms: All Bathrooms: All Lot Size: All
Property Types: Residential: (Single Family) Sq Ft: All
Cities: The Colony
Clarus MarketMetrics® 1 of 2 04/02/2011
Information not guaranteed. © 2009-2010 Terradatum and its suppliers and licensors (www.terradatum.com/about/licensors.td).
3 of 6
- 4. Valarie Littles Ultima Real Estate
Supply & Demand by Month
Mar-10 vs. Mar-11: The number of for sale properties is up 12% and the number of sold properties is down 62%
# Properties Average DOM # Properties Average DOM
Time Period For Sale For Sale Sold Sold
Mar-11 278 91 22 87
Feb-11 244 117 25 86
Jan-11 241 134 21 50
Dec-10 247 145 27 88
Nov-10 261 149 25 75
Oct-10 269 157 28 53
Sep-10 256 154 27 52
Aug-10 264 149 48 53
Jul-10 274 139 27 62
Jun-10 223 149 40 67
May-10 191 153 59 55
Apr-10 259 127 50 64
Mar-10 248 130 58 66
Clarus MarketMetrics® 2 of 2 04/02/2011
Information not guaranteed. © 2009-2010 Terradatum and its suppliers and licensors (www.terradatum.com/about/licensors.td).
4 of 6
- 5. Valarie Littles Ultima Real Estate
Months Supply of Inventory
Mar-10 vs. Mar-11: The average months supply of inventory is up 231%
Mar-10 vs. Mar-11
Mar-10 Mar-11 Change %
2.9 9.7 6.7 +231%
MLS: NTREIS Period: 1 year (monthly) Price: All Construction Type: All Bedrooms: All Bathrooms: All Lot Size: All
Property Types: Residential: (Single Family) Sq Ft: All
Cities: The Colony
Clarus MarketMetrics® 1 of 2 04/02/2011
Information not guaranteed. © 2009-2010 Terradatum and its suppliers and licensors (www.terradatum.com/about/licensors.td).
5 of 6
- 6. Valarie Littles Ultima Real Estate
Months Supply of Inventory
Mar-10 vs. Mar-11: The average months supply of inventory is up 231%
# Units For Sale # UC Units UC Average
Time Period Last Day of Month During Month MSI DOM
Mar-11 222 23 9.7 98
Feb-11 196 27 7.3 79
Jan-11 182 31 5.9 76
Dec-10 187 26 7.2 56
Nov-10 212 24 8.8 94
Oct-10 203 21 9.7 79
Sep-10 209 26 8.0 53
Aug-10 199 37 5.4 62
Jul-10 205 46 4.5 55
Jun-10 183 25 7.3 83
May-10 155 18 8.6 56
Apr-10 148 79 1.9 49
Mar-10 172 59 2.9 70
Clarus MarketMetrics® 2 of 2 04/02/2011
Information not guaranteed. © 2009-2010 Terradatum and its suppliers and licensors (www.terradatum.com/about/licensors.td).
6 of 6