Kernel development

Mechanisms and tools of development and monitoring in Linux Kernel A brief presentation about the tools and mechanisms about development for the Linux Kernel to help understanding of what is required. Tools that create an execution profile or provide instrumentation through static or dynamic methods, the Linux Kernel code, will be presented. Also discussed will be the GDB debugger and how through a remote virtual serial connection to a virtual machine it can be used to debug a live Kernel and Linux Kernel modules. Also demonstrated will be how a deeper understanding of the code can be attained by attaching the memory locations used by the Kernel module to the GDB session. Lastly, some of the Kernel execution contexts, such as, interrupts, deferrable work, context, etc. are presented.

Recommandé
Recommandé
Contenu connexe
Tendances
Tendances (20)
En vedette
En vedette (15)
Similaire à Kernel development
Similaire à Kernel development (20)
Dernier
Dernier (20)
Kernel development
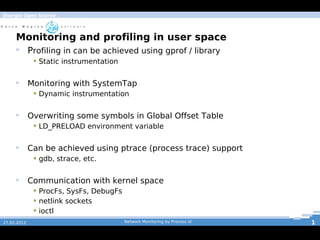
- 1. Energia Open Source Monitoring and profiling in user space Profiling in can be achieved using gprof / library Static instrumentation Monitoring with SystemTap Dynamic instrumentation Overwriting some symbols in Global Offset Table LD_PRELOAD environment variable Can be achieved using ptrace (process trace) support gdb, strace, etc. Communication with kernel space ProcFs, SysFs, DebugFs netlink sockets ioctl 27.02.2012 Network Monitoring by Process id 1
- 2. Energia Open Source Kernel Development Downloading the kernel sources and C compiling tools Linux Cross Reference site (good for browsing code) cscope good program to cross information of different C files C language (useful some knowledge of assembly and gcc extensions) Understand how the user space interacts with kernel space Useful virtualised environment (Virtualbox, vmware, kvm) to boot the new kernel Debug a remote kernel (with gdb) 27.02.2012 Network Monitoring by Process id 2
- 3. Energia Open Source Debug a remote kernel Using a virtual machine and a virtual serial connection On host machine Uncompressed kernel image (on the guest) Virtual serial connection (can be done with socat command) gdb On guest If the kernel already has support (kgdb or kgdb light) Patch it with kgdb Sysrq + g key or write to /proc/sysrq the 'g' value 27.02.2012 Network Monitoring by Process id 3
- 4. Energia Open Source Debug remote kernel II On the host machine it will call target remote ttyS0 The two machines are now linked with virtual serial console for debugging From now the guest machine is completely over the control of the host gdb What can we do at this stage? Can set breakpoints, inspect data, do backtraces, etc. The usual gdb session 27.02.2012 Network Monitoring by Process id 4
- 5. Energia Open Source Can I debug a local kernel ? Local debugging of a kernel is also possible Still needs the uncompressed kernel image, gdb and /proc/kcore file Can I still stop my machine with breakpoints? No, you can't. It's only possible to inspect some global data on the kernel Kernel modules information (metadata), etc. 27.02.2012 Network Monitoring by Process id 5
- 6. Energia Open Source Debugging / profiling tools production systems Ltt / Lttng Oprofile Kprobes Ftrace printk (the information is written on the kernel log) /var/log/ directory (using Ksyslog) dmesg command Maybe DTrace is coming to Linux...? 27.02.2012 Network Monitoring by Process id 6
- 7. Energia Open Source Debug kernel module Inspect kernel module code /sys/module/”module name”/sections text section data section, bss section (uninitialized data), etc. In gdb do add-symbol-file “module-name” .text_address = ... objdump tool Disassemble the kernel module 27.02.2012 Network Monitoring by Process id 7
- 8. Energia Open Source Kernel Contexts Interrupts Top half and bottom half Top half needs to be very brief and if needed schedule a bottom half Bottom halves (deferrable work) Soft irq Tasklet Work queues Process Context System calls The kernel runs on behalf of user programs 27.02.2012 Network Monitoring by Process id 8
- 9. Energia Open Source Kernel Development Doing kernel development is not as difficult as it once was As mentioned many tools can help us to debug and profile our modules This was just a brief overview of some information gathered during the development of my master thesis 27.02.2012 Network Monitoring by Process id 9