Lucknow Call girls - 8800925952 - 24x7 service with hotel room
Cancer facts & figures 2012
1. Cancer Facts
& Figures 2012
WA
35,790 NH
MT 8,350 ME
ND VT
5,550 8,990
3,510 MN 4,060
OR
28,060
21,370 MA
ID
SD WI NY 38,470
7,720
4,430 31,920 109,440
WY RI
MI
2,650 6,310
57,790
IA PA
NV NE 17,010 78,340 CT 21,530
13,780 9,030 OH NJ 50,650
UT IL IN 66,560
CA 10,620 65,750 35,060 DE 5,340
CO WV
165,810 22,820 KS VA MD 31,000
MO 11,610
14,090 KY 41,380
33,440 DC 2,980
25,160
NC
TN 51,860
AZ OK 35,610
31,990 NM 19,210 AR SC
9,640 16,120 26,570
MS AL GA
15,190 26,440 48,130
TX
110,470 LA
23,480
AK
3,640 FL
117,580
US
1,638,910
PR
HI N/A
6,610
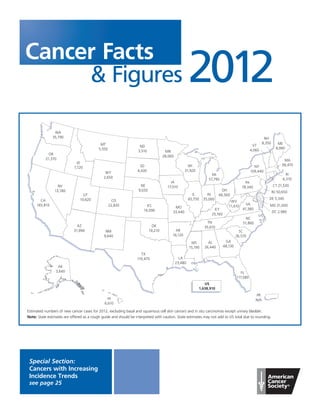
Estimated numbers of new cancer cases for 2012, excluding basal and squamous cell skin cancers and in situ carcinomas except urinary bladder.
Note: State estimates are offered as a rough guide and should be interpreted with caution. State estimates may not add to US total due to rounding.
Special Section:
Cancers with Increasing
Incidence Trends
see page 25
3. Lifetime risk refers to the probability that an individual will
Basic Cancer Facts develop or die from cancer over the course of a lifetime. In the
US, men have slightly less than a 1 in 2 lifetime risk of developing
cancer; for women, the risk is a little more than 1 in 3.
What Is Cancer? Relative risk is a measure of the strength of the relationship
Cancer is a group of diseases characterized by uncontrolled between risk factors and a particular cancer. It compares the risk
growth and spread of abnormal cells. If the spread is not con- of developing cancer in persons with a certain exposure or trait
trolled, it can result in death. Cancer is caused by both external to the risk in persons who do not have this characteristic. For
factors (tobacco, infectious organisms, chemicals, and radiation) example, male smokers are about 23 times more likely to develop
and internal factors (inherited mutations, hormones, immune lung cancer than nonsmokers, so their relative risk is 23. Most
conditions, and mutations that occur from metabolism). These relative risks are not this large. For example, women who have a
causal factors may act together or in sequence to initiate or pro- first-degree relative (mother, sister, or daughter) with a history
mote the development of cancer. Ten or more years often pass of breast cancer have about twice the risk of developing breast
between exposure to external factors and detectable cancer. cancer, compared to women who do not have this family history.
Cancer is treated with surgery, radiation, chemotherapy, hormone
All cancers involve the malfunction of genes that control cell
therapy, biological therapy, and targeted therapy.
growth and division. About 5% of all cancers are strongly heredi-
tary, in that an inherited genetic alteration confers a very high
Can Cancer Be Prevented? risk of developing one or more specific types of cancer. However,
All cancers caused by cigarette smoking and heavy use of alcohol most cancers do not result from inherited genes but from damage
could be prevented completely. The American Cancer Society to genes occurring during one’s lifetime. Genetic damage may
estimates that in 2012 about 173,200 cancer deaths will be caused result from internal factors, such as hormones or the metabolism
by tobacco use. Scientific evidence suggests that about one-third of nutrients within cells, or external factors, such as tobacco,
of the 577,190 cancer deaths expected to occur in 2012 will be chemicals, and excessive exposure to sunlight.
related to overweight or obesity, physical inactivity, and poor
nutrition and thus could also be prevented. Certain cancers are How Many People Alive Today Have Ever
related to infectious agents, such as hepatitis B virus (HBV), Had Cancer?
human papillomavirus (HPV), human immunodeficiency virus
The National Cancer Institute estimates that nearly 12 million
(HIV), Helicobacter pylori (H. pylori), and others, and could be pre-
Americans with a history of cancer were alive in January 2008.
vented through behavioral changes, vaccines, or antibiotics. In
Some of these individuals were cancer free, while others still had
addition, many of the more than 2 million skin cancers that are
evidence of cancer and may have been undergoing treatment.
diagnosed annually could be prevented by protecting skin from
intense sun exposure and avoiding indoor tanning.
How Many New Cases Are Expected to Occur
Regular screening examinations by a health care professional This Year?
can result in the detection and removal of precancerous growths,
About 1,638,910 new cancer cases are expected to be diagnosed
as well as the diagnosis of cancers at an early stage, when they
in 2012. This estimate does not include carcinoma in situ (nonin-
are most treatable. Cancers of the cervix, colon, and rectum can
vasive cancer) of any site except urinary bladder, and does not
be prevented by removal of precancerous tissue. Cancers that
include basal and squamous cell skin cancers, which are not
can be diagnosed early through screening include cancers of the
required to be reported to cancer registries.
breast, colon, rectum, cervix, prostate, oral cavity, and skin.
However, screening is known to reduce mortality only for cancers
of the breast, colon, rectum, and cervix. A heightened awareness How Many People Are Expected to Die
of changes in the breast or skin may also result in detection of of Cancer This Year?
these tumors at earlier stages. Cancers that can be prevented or In 2012, about 577,190 Americans are expected to die of cancer,
detected earlier by screening account for at least half of all new more than 1,500 people a day. Cancer is the second most com-
cancer cases. mon cause of death in the US, exceeded only by heart disease,
accounting for nearly 1 of every 4 deaths.
Who Is at Risk of Developing Cancer?
Anyone can develop cancer. Since the risk of being diagnosed What Percentage of People Survive Cancer?
with cancer increases with age, most cases occur in adults who The 5-year relative survival rate for all cancers diagnosed
are middle aged or older. About 77% of all cancers are diagnosed between 2001 and 2007 is 67%, up from 49% in 1975-1977 (see
in persons 55 years of age and older. Cancer researchers use the page 18). The improvement in survival reflects both progress in
word “risk” in different ways, most commonly expressing risk as diagnosing certain cancers at an earlier stage and improvements
lifetime risk or relative risk.
Cancer Facts & Figures 2012 1
11. estrogen and progestin hormone therapy), physical inactivity,
Selected Cancers and alcohol consumption. Medical findings that predict higher
risk include high breast tissue density (a mammographic mea-
sure of the amount of glandular tissue relative to fatty tissue in
Breast the breast), high bone mineral density (women with low density
are at increased risk for osteoporosis), and biopsy-confirmed
New Cases: An estimated 226,870 new cases of invasive breast
hyperplasia (overgrowth of cells), especially atypical hyperpla-
cancer are expected to occur among women in the US during
sia (overgrowth of cells that do not appear normal). High-dose
2012; about 2,190 new cases are expected in men. Excluding can-
radiation to the chest for cancer treatment also increases risk.
cers of the skin, breast cancer is the most frequently diagnosed
Reproductive factors that increase risk include a long menstrual
cancer in women. The breast cancer incidence rate began to
history (menstrual periods that start early and/or end later in
decline in 2000 after peaking at 142 per 100,000 women in 1999.
life), recent use of oral contraceptives, never having children,
The dramatic decrease of almost 7% from 2002 to 2003 has been
and having one’s first child after age 30.
attributed to reductions in the use of menopausal hormone ther-
apy (MHT), previously known as hormone replacement therapy, Risk is also increased by a family history of one or more first-
following the publication of results from the Women’s Health degree relatives with breast cancer (though most women with
Initiative in 2002; this study found that the use of combined breast cancer do not have a family history of the disease). Inher-
estrogen plus progestin MHT was associated with an increased ited mutations (alterations) in breast cancer susceptibility genes
risk of breast cancer, as well as coronary heart disease. From account for approximately 5%-10% of all female and male breast
2004-2008, the most recent five years for which data are avail- cancer cases, but are very rare in the general population (much
able, breast cancer incidence rates were stable. less than 1%). Most of these mutations are located in BRCA1 and
BRCA2 genes, although mutations in other known genes have
In addition to invasive breast cancer, 63,300 new cases of in situ
also been identified. Individuals with a strong family history of
breast cancer are expected to occur among women in 2012. Of
breast cancer and cancer at other sites, such as ovarian and
these, approximately 85% will be ductal carcinoma in situ
colon cancer, should consider counseling to determine if genetic
(DCIS). Since 2004, in situ breast cancer incidence rates have
testing is appropriate. Prevention measures may be possible for
been stable in white women and increasing in African American
individuals with breast cancer susceptibility mutations. In BRCA1
women by 2.0% per year.
and BRCA2 mutation carriers, studies suggest that prophylactic
Deaths: An estimated 39,920 breast cancer deaths (39,510 removal of the ovaries and/or breasts decreases the risk of breast
women, 410 men) are expected in 2012. Breast cancer ranks sec- cancer considerably, although not all women who choose this
ond as a cause of cancer death in women (after lung cancer). surgery would have developed breast cancer. Women who con-
Death rates for breast cancer have steadily decreased in women sider prophylactic surgery should undergo counseling before
since 1990, with larger decreases in younger women; from 2004 reaching a decision.
to 2008, rates decreased 3.1% per year in women younger than 50
The International Agency for Research on Cancer has concluded
and 2.1% per year in women 50 and older. The decrease in breast
that there is limited evidence that tobacco smoking and shift
cancer death rates represents progress in earlier detection,
work, particularly at night, are associated with an increased risk
improved treatment, and possibly decreased incidence.
of breast cancer.
Signs and symptoms: Breast cancer typically produces no
Modifiable factors that are associated with a lower risk of breast
symptoms when the tumor is small and most treatable. There-
cancer include breastfeeding, moderate or vigorous physical
fore, it is important for women to follow recommended screening
activity, and maintaining a healthy body weight. Two medications,
guidelines for detecting breast cancer at an early stage, before
tamoxifen and raloxifene, have been approved to reduce breast
symptoms develop. Larger tumors may become evident as a pain-
cancer risk in women at high risk. Raloxifene appears to have a
less mass. Less common symptoms include persistent changes to
lower risk of certain side effects, such as uterine cancer and
the breast, such as thickening, swelling, distortion, tenderness,
blood clots.
skin irritation, redness, scaliness, or nipple abnormalities, such
as ulceration, retraction, or spontaneous discharge. Typically, Early detection: Mammography can often detect breast cancer
breast pain results from benign conditions and is not an early at an early stage, when treatment is more effective and a cure is
symptom of breast cancer. more likely. Numerous studies have shown that early detection
with mammography saves lives and increases treatment options.
Risk factors: Besides being female, increasing age is the most
Steady declines in breast cancer mortality among women since
important risk factor for breast cancer. Potentially modifiable
1990 have been attributed to a combination of early detection and
risk factors include weight gain after age 18, being overweight or
improvements in treatment. Mammography is a very accurate
obese (for postmenopausal breast cancer), use of MHT (combined
screening tool, both for women at average and increased risk;
Cancer Facts & Figures 2012 9
13. It is recommended that all patients with ductal carcinoma in Signs and symptoms: Early symptoms are usually nonspecific.
situ (DCIS) be treated to avoid potential progression to invasive Parents should ensure that children have regular medical check-
cancer. Treatment options for DCIS include lumpectomy with ups and be alert to any unusual, persistent symptoms. Signs of
radiation therapy or mastectomy; either of these options may be childhood cancer include an unusual mass or swelling; unex-
followed by treatment with tamoxifen if the tumor is hormone plained paleness or loss of energy; sudden tendency to bruise; a
receptor-positive. Removal of axillary lymph nodes is not gener- persistent, localized pain; prolonged, unexplained fever or illness;
ally needed. A report by a panel of experts convened by the frequent headaches, often with vomiting; sudden eye or vision
National Institutes of Health concluded that in light of the non- changes; and excessive, rapid weight loss. Major categories of
invasive nature and favorable prognosis of DCIS, the primary pediatric cancer and specific symptoms include:
goal for future research is the ability to accurately group patients • Leukemia (34% of all childhood cancers), which may be
into risk categories that will allow the most successful outcomes recognized by bone and joint pain, weakness, pale skin,
with the minimum necessary treatment. bleeding, and fever
Survival: The 5-year relative survival rate for female breast cancer • Brain and other nervous system (27%), which may cause
patients has improved from 63% in the early 1960s to 90% today. headaches, nausea, vomiting, blurred or double vision,
The 5-year relative survival for women diagnosed with localized dizziness, and difficulty walking or handling objects
breast cancer (cancer that has not spread to lymph nodes or • Neuroblastoma (7%), a cancer of the nervous system that is
other locations outside the breast) is 99%; if the cancer has most common in children younger than 5 years of age and
spread to nearby lymph nodes (regional stage) or distant lymph usually appears as a swelling in the abdomen
nodes or organs (distant stage), the survival rate falls to 84% or
• Wilms tumor (5%), a kidney cancer that may be recognized
23%, respectively. For all stages combined, relative survival rates
by a swelling or lump in the abdomen
at 10 and 15 years after diagnosis are 82% and 77%, respectively.
Caution should be used when interpreting long-term survival • Non-Hodgkin lymphoma (4%) and Hodgkin lymphoma (4%),
rates because they represent patients who were diagnosed many which affect lymph nodes but may spread to bone marrow
years ago and do not reflect recent advances in detection and and other organs, and may cause swelling of lymph nodes in
treatment. For example, 15-year relative survival is based on the neck, armpit, or groin, as well as weakness and fever
patients diagnosed as early as 1990. • Rhabdomyosarcoma (3%), a soft tissue sarcoma that can
occur in the head and neck, genitourinary area, trunk, and
Many studies have shown that being overweight adversely
extremities, and may cause pain and/or a mass or swelling
affects survival for postmenopausal women with breast cancer.
In addition, women who are more physically active are less likely • Retinoblastoma (3%), an eye cancer that is typically recognized
to die from the disease than those who are inactive. because of discoloration of the eye pupil and usually occurs
in children younger than 5 years of age
For more information about breast cancer, see the American
• Osteosarcoma (3%), a bone cancer that most often occurs in
Cancer Society’s Breast Cancer Facts & Figures 2011-2012, avail-
adolescents and commonly appears as sporadic pain in the
able online at cancer.org/statistics.
affected bone that may worsen at night or with activity, with
eventual progression to local swelling
Childhood Cancer
• Ewing sarcoma (1%), another type of cancer that usually
New cases: An estimated 12,060 new cases are expected to arises in bone, is most common in adolescents, and typically
occur among children 0 to 14 years of age in 2012. Childhood appears as pain at the tumor site.
cancers are rare, representing less than 1% of all new cancer
diagnoses. Overall, childhood cancer incidence rates increased (Proportions are provided for all races combined and may vary
slightly by 0.5% per year from 2004 to 2008, a consistent trend according to race/ethnicity.)
since 1975. Treatment: Childhood cancers can be treated by a combination
Deaths: An estimated 1,340 cancer deaths are expected to occur of therapies (surgery, radiation, and chemotherapy) chosen based
among children 0 to 14 years of age in 2012, about one-third of on the type and stage of the cancer. Treatment is coordinated by a
these from leukemia. Although uncommon, cancer is the second team of experts, including pediatric oncologists, pediatric nurses,
leading cause of death in children, exceeded only by accidents. social workers, psychologists, and others who assist children and
Mortality rates for childhood cancer have declined by 66% over their families. Because these cancers are uncommon, outcomes
the past four decades, from 6.5 (per 100,000) in 1969 to 2.2 in are more successful when treatment is managed by a children’s
2008. The substantial progress in reducing childhood cancer cancer center. If the child is eligible, placement in a clinical trial,
mortality is largely attributable to improvements in treatment which compares a new treatment to the best current treatment,
and high rates of participation in clinical trials. should also be considered.
Cancer Facts & Figures 2012 11