
Recommandé
Recommandé
Contenu connexe
Tendances
Tendances (14)
Dernier
Dernier (20)
OECD-FAO Agricultural Outlook 2022-2031 - slides (EN)
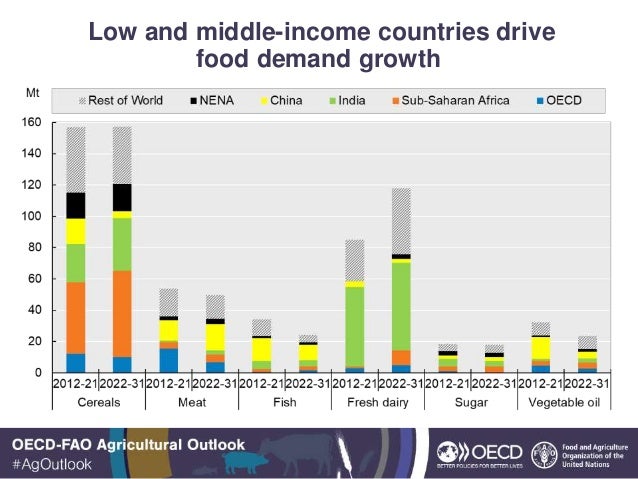
- 1. Low and middle-income countries drive food demand growth
- 2. Limited convergence in diet composition Per capita availability of the main food groups (in calories)
- 3. Biofuel share of agricultural commodities is stabilizing Biofuel as a share of total use
- 4. Growth in crop production driven by growth in yields
- 5. A few countries/regions dominate livestock production
- 6. Limited change in agricultural land use 2019-21 to 2030
- 7. Declining carbon intensity of agricultural production Annual change in agricultural output and direct GHG emissions, 2022-31
- 8. Increasing differentiation between net exporting and net importing regions Net trade, in constant 2014-16 USD
- 9. Real prices are projected to decline
- 10. Acceleration in productivity growth needed to achieve Zero Hunger and GHG reductions by 2030
Notes de l'éditeur
- Note: Estimates are based on historical time series from the FAOSTAT Food Balance Sheets database which are extended with the Outlook database. Products not covered in the Outlook are extended by trends. The 38 individual countries and 11 regional aggregates in the baseline are classified into the four income groups according to their respective per-capita income in 2018. The applied thresholds are: low: < USD 1 550, lower-middle: < USD 3 895, upper-middle: < USD 13 000, high: > USD 13 000. Staples include cereals, roots and tubers and pulses. Animal products include meat, dairy products (excluding butter), eggs and fish. Fats include butter and vegetable oil. Sweeteners include sugar and HFCS. The category others includes other crop and animal products.
- Note: Figure shows the decomposition of total production growth (2012-21 and 2022-31) into growth in land use, land intensification through growth in multi-cropped land, and growth in yields. It covers the following crops: cotton, maize, other coarse grains, other oilseeds, pulses, rice, roots and tubers, soybean, sugarbeet, sugarcane, wheat and palm oil.
- Note: Milk production is expressed in Mt of milk solids. Title proposal: Livestock production growth will mainly originate from developing countries
- Note: This figure shows projected annual growth in direct GHG emissions from agriculture together with annual growth in the estimated net value of production of crop and livestock commodities covered in the Outlook (measured in constant USD 2014-16 prices). Estimates are based on historical time series from the FAOSTAT Emissions Agriculture databases which are extended with the Outlook database.CO2 equivalents are calculated using the global warming potential of each gas as reported in the IPCC Sixth Assessment Report (AR6). Emission types that are not related to any Outlook variable (organic soil cultivation and burning Savannahs) are kept constant at their latest available value. The category ''other'' includes direct GHG emissions from burning crop residues, burning savanna, crop residues, and cultivation of organic soils. The Net Value of Production uses own estimates for internal seed and feed use.
- Note: Net trade (exports minus imports) of commodities covered in the Agricultural Outlook, measured in constant 2014-16 USD. Net trade figures include intra regional trade but exclude intra-EU trade. The regions Developed and East Asia, and South and South East Asia are defined as in Chapter 2.